

The decennial census plays an essential role in American democracy. The stakes are huge for California, and 2020 is fast approaching. This series of blog posts takes a detailed look at California communities that may be at risk of being undercounted.
PPIC’s new interactive maps are an important tool for Californians working to ensure an accurate census count. They highlight hard-to-count communities across the state, providing an overall assessment of how hard an area will be to count and pinpointing reasons why certain areas may be hard to reach.
The overall assessment is based on an area’s “low response score,” a measure developed by the Census Bureau using historical trends. This score (what we call the “predicted nonresponse rate”) helps visualize a community’s vulnerability to being omitted from the census. However, it doesn’t capture all areas that will be hard to count in 2020, and it doesn’t indicate the underlying reasons why a community might be hard to count. PPIC’s new maps expand our understanding of hard-to-count communities in several ways.
As shown in the graphic below, the maps provide information for multiple geographies. First, you can select whether you want to see data by county, congressional district, state assembly district, or state senate district. Then, you can examine data for those broad regions or for individual census tracts. Zooming in allows you to identify which census tracts have the highest predicted nonresponse rates in a particular region.
In addition, by selecting different categories, you can get a sense of why these areas might be hard to count:
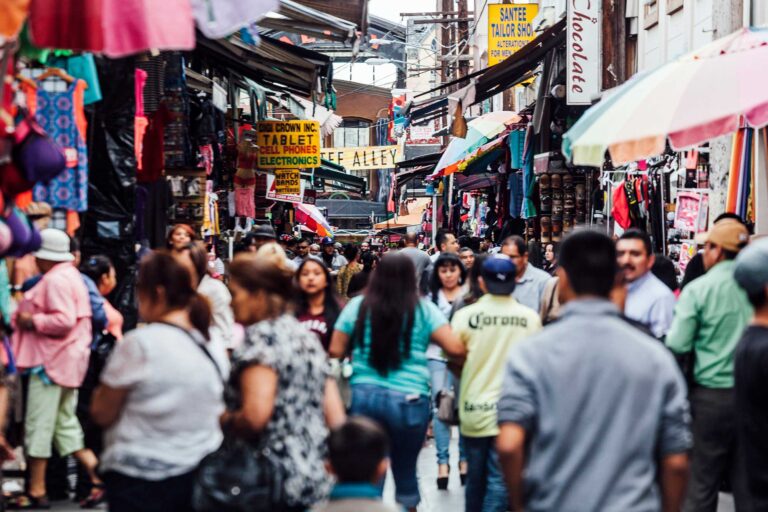
- Does the area have high shares of people that are typically undercounted? Certain racial/ethnic groups—African Americans, Latinos, and Native Americans—and young children are historically undercounted in the census. Counties in the San Joaquin Valley and southern parts of California tend to have higher shares of these vulnerable populations.
- Does the area have many noncitizens? The census is supposed to count all residents, but noncitizens may be less likely to respond in 2020 due to the planned addition of a citizenship question and concerns about privacy and deportation. Monterey County on the central coast has the highest share of noncitizens (22%), followed by Santa Clara County (18%) and Los Angeles County (17%).
- Does the area have a lot of renters, overcrowded housing, and other factors that can make it hard for the Census Bureau to locate residents? To examine this issue, we created a housing score using data on renters and mobile homes. Seventeen counties in various regions of the state have scores indicating they may face particular challenges counting residents due to their housing conditions.
- Does the area seem to have adequate internet access? The Census Bureau plans to collect the majority of responses online in 2020—a departure from its usual practice. We provide data on residential high-speed internet connections—a measure created by the Federal Communications Commission that does not include mobile data plans—as a proxy for service coverage. Rural areas are less likely to have residential high-speed internet access.
Overall, the maps show there are hard-to-count communities across the entire state—and regions have different risk factors for being undercounted. In addition, communities may be hard to count for multiple reasons: for example, low-income populations are more likely to live in hard-to-find housing like garages and trailers, and they are also less likely to have reliable internet access.
We hope these maps help local leaders determine the likelihood that their communities might not be accurately counted and provide guidance on targeting outreach efforts. Stay tuned for future posts that examine hard-to-count communities in specific regions of the state.
Topics
Census census undercount decennial census Health & Safety Net Political Landscape PopulationLearn More
2020 Census: The Political Impact on California

Californians and the 2020 Census

Census-Related Funding in California

Policy Brief: How Accurate Was California’s 2020 Census?
The 2020 Census and Political Representation in California