

The California Department of Education recently released 2018 SBAC test scores that showed very modest improvement. Since last year, the percent of students meeting or exceeding state standards grew 1.1 percentage points in math. But focusing only on these year-to-year comparisons means that we miss the longer-term picture. That is, we don’t see how the same group of students are progressing over time. When we look at SBAC math scores in this manner, we have some cause for concern—but there are bright spots, too.
In the figure below, we show the growth in math test scores from grade to grade—that is, we can see how last year’s third graders performed in fourth grade, and so on. If growth is less than 100 percent, students aren’t keeping up with grade-level standards. If it is greater than 100 percent, student growth is outpacing what is expected by the standards. For instance, fourth grade students gained roughly 80 percent of the increase needed to keep pace with the proficiency standards.
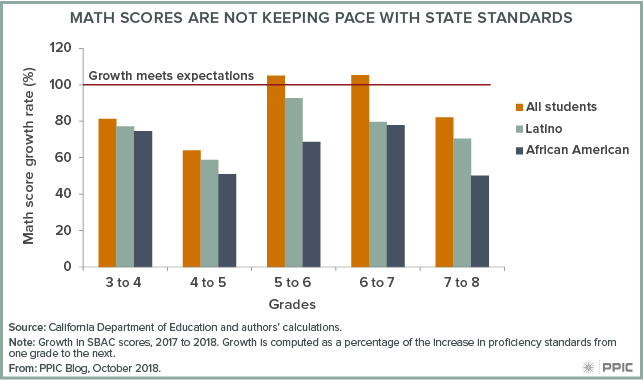
Across all grades student scores grew, but only in grades 6 and 7 did the average student growth keep pace with the growth in standards. In all other grades students fell behind, with fewer keeping pace with the growth in grade-level standards. Perhaps more discouraging, the math scores of African American and Latino students grew less than the average student across all grades, meaning that racial and ethnic disparities are growing as students progress through school. These results suggest that growth among low-income students also lags the standards, since African American and Latino students account for more than 75 percent of economically disadvantaged students.
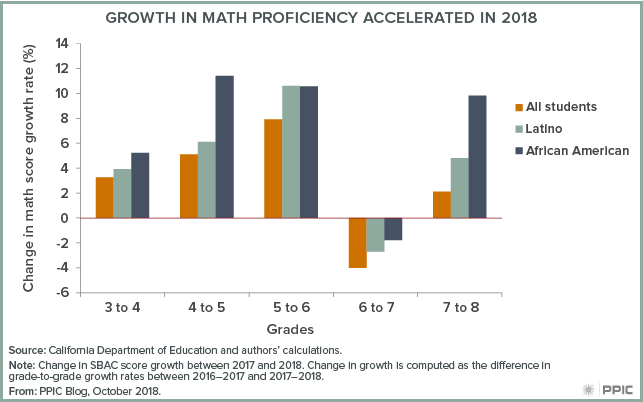
There is a silver lining in the 2018 growth numbers. Across most grades, growth in math was higher in 2018 than it was in 2017, meaning that fewer students are falling behind as they progress through school. This can be seen in the figure below, which shows how math score growth has changed between 2017 and 2018. Growth did slow for seventh graders, yet as the previous figure shows they still managed enough growth to outpace state standards, despite the slowdown.
Also encouraging: racial disparities in growth rates are smaller in 2018 than they were in 2017, as African American and Latino student improvement in math was greater than average student improvement across every grade. For instance, among African American fifth graders math scores improved about 11 percent more in 2018 than their counterparts’ improved in 2017. Thus, while achievement gaps still grow as students advance, gaps in growth are shrinking, and these disparities are growing more slowly than in years prior.