
This piece is excerpted from a presentation at the USC Annenberg School for Communication and Journalism given on March 30, 2018, in Los Angeles.
Many eyes will be on California in this midterm election year, especially since control of Congress may hinge on the outcome of 10 competitive House races in the Golden State. Currently, more than a quarter of the state’s residents are born outside the US—and one in five immigrants make up what we consider likely voters in California elections. With federal immigration policy playing a lead role in today’s polarized political discussions, will California’s immigrants have an impact—and to who’s advantage—in the 2018 election?
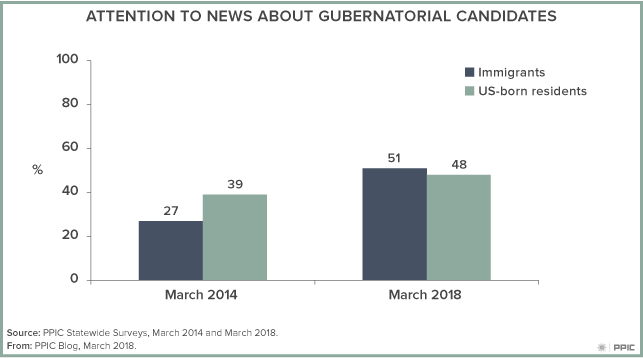
Typically, California’s immigrants are less interested in politics than their US born counterparts. But not when it comes to the 2018 election cycle. Among likely voters in our current survey, immigrants and nonimmigrants are similarly likely to be following the news about gubernatorial candidates “very” or “fairly” closely (51% immigrants, 48% US born). Both groups say that voting this year is more important than in past midterm elections (47% immigrants, 51% US born). Perhaps most telling for this year, both likely voter groups mention immigration and illegal immigration when asked about the issue that they would most like to hear the gubernatorial candidates talk about before the June primary (23% immigrants, 23% US born).
When it comes to current candidate choices, we do see some divergence between immigrant and US-born likely voters:
- Democrat Gavin Newsom slightly trails Democrat Antonio Villaraigosa among immigrants (17% to 23%), while he is favored by three to one over Villaraigosa among nonimmigrants (30% to 9%).
- Republican John Cox does equally well with both groups (15% immigrants, 14% US born).
- Democrat Dianne Feinstein is favored by large margins over Democrat Kevin de León both among immigrants (50% to 18%) and nonimmigrants (40% to 16%). She has a higher approval rating among immigrants than nonimmigrants (68% to 51%).
- Immigrants are more likely than nonimmigrants to favor the Democratic candidates in their local House races (63% to 51%) and less likely to favor the Republican candidates (30% to 41%). Immigrants also give higher approval ratings than nonimmigrants to their current local House member (59% to 51%).
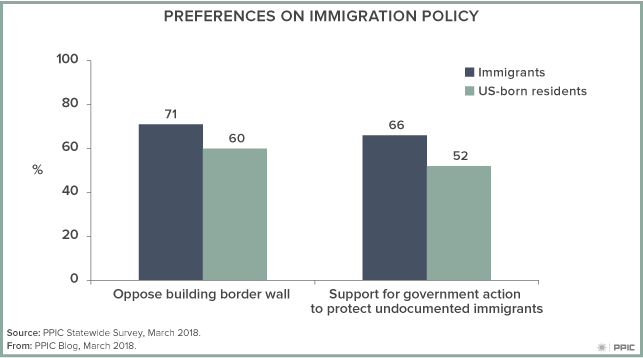
Despite these differences, immigrant and nonimmigrant Californians are aligned in their views of the current policy landscape. Majorities in both likely voter groups disapprove of President Donald Trump (63% immigrants, 60% US born), oppose the new federal tax law (65% immigrants, 56% US born), want gun laws to be stricter (82% immigrants, 67% US born), and oppose building a wall along the entire border with Mexico (71% immigrants, 60% US born). When it comes to state and local governments making their own policies and taking action separate from the federal government, majorities in both likely voter groups say they are in favor of protecting the legal rights of undocumented immigrants (66% immigrants, 52% US born).
One of the political wildcards in this California mid-term election is whether the strong opposition to federal immigration policy will motivate more naturalized citizens to vote and more noncitizens to become citizens and register to vote. As noted earlier, immigrants make up a larger share of the state’s population than is reflected in the likely voter group—leaving much room for growth that could transform the state’s electorate. The PPIC Statewide Survey will be closely monitoring the trends in political engagement and ballot choices in this consequential election for California and the nation.