
Who’s in Poverty in California?
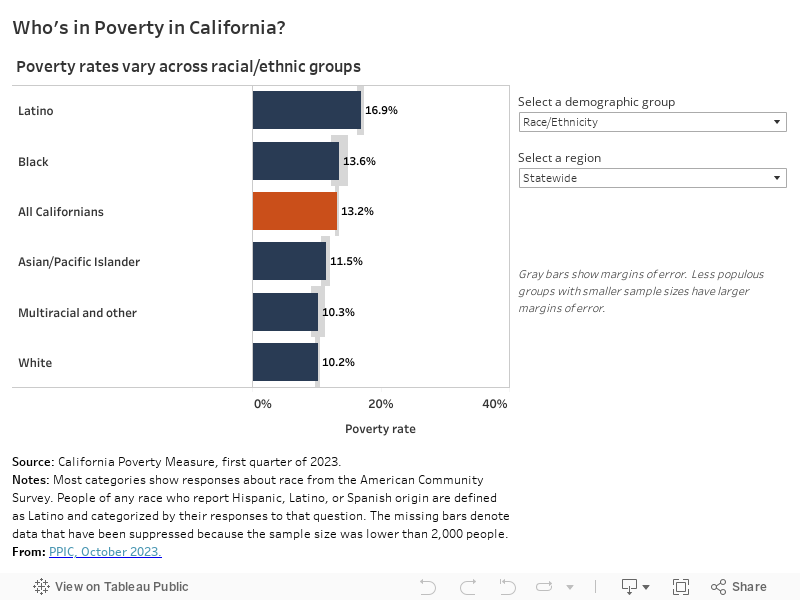
This interactive shows poverty rates from the first quarter of 2023 across demographic groups in California, according to the California Poverty Measure (CPM). It shows poverty rates by age, education, employment, family composition, immigrant status, and race/ethnicity. In addition to showing statewide rates, it also shows rates across nine major regions of the states. The CPM is a joint research effort between PPIC and the Stanford Center on Poverty and Inequality that, unlike the official poverty measure, takes into account the cost of living and resources from social safety net programs. See Poverty in California: Technical Appendices for regional definitions and adapted methods used in the CPM as compared to pre-pandemic years.
For more information or questions, please contact Caroline Danielson, Patricia Malagon, and Sarah Bohn.
This research was supported with funding from the Blue Shield of California Foundation, the James Irvine Foundation, and Tipping Point Community.
Related Content
Blog Post
A Look at Demographic Differences in Poverty across Regions in California
Fact Sheet
Poverty in California
Poverty in California, Technical Appendicies
Interactive
California Poverty by County and Legislative District