

Summary
The 2014-15 school year was the first in which the Smarter Balanced assessments (referred to here as the SBAC) were administered statewide. While educators and policymakers agree that multiple measures over multiple years are the best way to gauge student, school, and district performance, the first-year SBAC results provide an important baseline for assessing implementation of the Common Core State Standards and the Local Control and Accountability Plans (LCAPs).
These results may also have implications for the evolution of accountability measures at the district and state levels-especially in relation to high-need students. The California State Board of Education has not yet devised a replacement for the Academic Performance Index (API), which was suspended in the 2014-15 school year. Districts have developed goals and measures in their LCAPs but the rubrics that state and the county offices of education will use are not yet in place. In the meantime, a close look at the results of the first year of testing can help us track achievement gaps between student groups and identify districts and schools with the largest tasks ahead.
One of the major goals of the Local Control Funding Formula (LCFF) is to help districts address a long-standing achievement gap between high-need students-economically disadvantaged students and English Learners (ELs)—and other students. However, we find that the test score gap is larger for 4th-grade EL and economically disadvantaged students when measured with the SBAC than with the state’s prior assessment (the California Standards Test, or CST). Generally speaking, as the share of high-need students in a district or school increases, the proportion of students meeting the standards falls. However, when we compare results across demographically similar schools and districts, we find that some schools performed better than expected.
Results for English Learners are particularly useful for local and state policymakers as they implement new EL standards and consider how to revise reclassification standards. Notably, in a relatively large number of schools, no EL students scored at or above the standards for English language arts (ELA) and math. In the past, 30 percent of districts required ELs to meet the ELA standard on the CST to be reclassified.
Our main conclusion is that high-need students are far behind other student groups-indeed, they may be farther behind than we thought. Schools and districts can use this analysis to take stock of their implementation of the Common Core and their progress toward their LCAP goals for EL and economically disadvantaged students. And schools and districts with large gaps-especially those performing below expectations-can find examples of similar districts and schools that exceeded expectations.
First-Year Results Indicate a Wider Test Score Gap
The much anticipated first-year Smarter Balanced assessment (SBAC) test results were largely unsurprising: a smaller share of California students scored at or above the benchmark for the new Common Core State Standards (CDE 2015; EdSource 2015). However, the results for English Learner and economically disadvantaged students suggest that high-need students are further behind than educators may have thought.
The overall outcome was widely anticipated, and California is not alone-many other states that are implementing the Common Core standards and new assessments saw lower shares meeting their new standards than their old standards (Butrymowicz and Felton 2015; Harris 2015). There are many reasons for the lower scores: the new standards being taught changed and are being implemented unevenly across school districts (Warren and Murphy 2014; McLaughlin, Glaab and Carrasco 2014, Harrington 2016); the definition of having met the standards changed; and the testing method changed (London and Warren 2015).1 While it is true that these assessments are in many ways not comparable (indeed, legislation passed in 2013 prohibits the CDE and local education agencies from doing so),2 it is useful to understand which districts and schools are doing consistently well on both tests, and whether districts doing well on the SBAC English language arts (ELA) also do well on the SBAC math.
Defining High-Need Students
English Learner (EL): A student whose first language is not English who is deemed without sufficiently fluent academic English to succeed unsupported in classroom settings. EL students receive English Language Development instruction until their academic English improves and they are reclassified.
Economically disadvantaged: A student who qualifies for free or reduced-price school meals.
High-need: A student who is either an EL, economically disadvantaged, or foster youth. High-need students generate extra funding for their school district (or school, in the case of charter schools) through the Local Control Funding Formula. In this report, we do not disaggregate test scores for foster youth.
However, the drop in scores was particularly pronounced among high-need students. For example, only 12 percent of 4th-grade ELs met the SBAC ELA standard, compared to 30 percent the last time the CST was administered. Similarly, 26 percent of economically disadvantaged 4th graders met the SBAC standard, while more than half (53%) met the standard the last time the CST was administered (2012-13). As a result, the test score gaps between high-need students and white students are larger on the SBAC than they were on CST for both math and ELA (Figure 1).3 In particular, the gap in math between EL students and white students was 80 percent on the SBAC, compared to 38 percent on the CST-in other words, the share of EL students who met the standard for the SBAC was 80 percent lower than the share of white students who met those standards. For the ELA test, the SBAC score gap was 79 percent, rather than 61 percent on the CST. These gaps were larger for EL students than any other group. Gaps between economically disadvantaged students and white students are larger as well. For math, the gap between economically disadvantaged students and white students was 59 percent on the SBAC and 22 percent on the CST. For the ELA test, the gap was 54 percent on the SBAC and 31 percent on the CST.
Figure 1. Achievement gaps among 4th graders are larger on the SBAC than on the CST
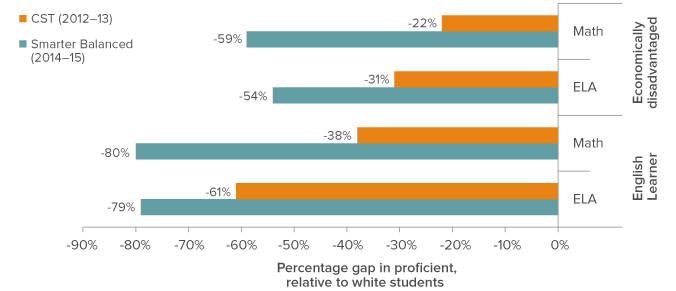
SOURCES: 2012-13 CST and 2014-15 SBAC.
NOTE: All students, statewide.
Not only are these gaps larger in the first year of SBAC testing, but the ELA gaps for English Learner and economically disadvantaged students are now similar to the math gaps whereas previously the gaps were larger for ELA. This is not entirely unexpected: educators were expecting that some students would find math especially challenging because Common Core math requires more ELA proficiency than California’s old standards.4 But it does suggest that, as measured in the first year of the SBAC, high-need students have farther to go-perhaps further than the old standards and assessments indicated.
Tracking Score Gaps Across Tests
CST: California Standards Test. Implemented in 1998 to accompany new statewide standards and administered until the 2012-13 school year.
SBAC: Assessments developed by the Smarter Balanced Assessment Consortium to assess student progress toward meeting the Common Core State Standards. These standardized tests were administered to students statewide for the first time in 2014-15 school year. California adopted the Common Core standards in 2010, but did not require implementation until 2013-14.
Scaled score: Number of correct answers (raw score) converted to a standardized and consistent score. For 4th graders on the SBAC ELA assessment, the scaled score ranges from 2,131 to 2,663. Scaled score ranges correspond to achievement levels (for example, scores from 2,416 to 2,472 correspond to a level called “standard nearly met”).
Meeting the standard: The benchmark for meeting the standard varies by grade and subject matter. For 4th graders on the ELA portion of the SBAC, the scaled score must be at least 2473.
Test score gap: The percentage difference between the share meeting the standard for two student groups. For example, if 10 percent of group A and 15 percent of group B met the standard, the test score gap for group A is 50 percent. Said another way, group A’s scores are 50 percent lower than those of group B.
To better understand the test score gap, we explored the relationship between the share of students who are high-need in a district (or school) and the share of EL and economically disadvantaged students who met the SBAC standards. We explored the same relationship with the CST in order to identify the largest gaps for high-need students with SBAC and whether they are the same districts and schools with low scores on the CST. Before the SBAC results were released, there were cautions issued against comparing the test results. As we-ve already noted, the SBAC test assesses students according to different (arguably more difficult) standards that are in the early phases of implementation, and the test itself is very different. However, highlighting the districts and schools that have done well with both tests may prove useful for districts and schools looking to improve their results. Similarly, districts and schools that did well with the CST but are now struggling with the SBAC may need to change course.
We focus on English language arts results in the 4th grade both because early test scores have proven useful in predicting later educational outcomes (see an example in Zau and Betts 2008) and because so many English Learners are reclassified at this grade level (Hill, Weston, and Hayes 2014). The decision to move students out of EL status, which has historically depended heavily on scores on the ELA portion of the CST, has important implications for long-term student success. We include comparable findings for math in the appendix.
Assessing Test Scores at the District Level
In school districts with higher percentages of high-need students, smaller shares of students meet or exceed either the new Common Core standards as measured by the SBAC, or the old standards as measured by the CST. This is why the Local Control Funding Formula (LCFF) directs more funding (on a per pupil basis) to districts with a higher proportion of high-need students (Rose and Weston 2013). Along with the extra funding, districts have more spending flexibility. But they also have more responsibility for improving all student outcomes and closing achievement gaps for EL, economically disadvantaged, and other students.
District-designed accountability plans (known as LCAPs) include a variety of measures, including test scores. These plans are meant to help local stakeholders assess school and district progress, but the accountability mechanism is not yet clear. Policymakers at the state level are designing a replacement for the state’s old accountability metric (the API), but what it will include is still uncertain. While the SBAC is just one measure of academic achievement, it is an important one and will likely be a part of the state’s new accountability measure.
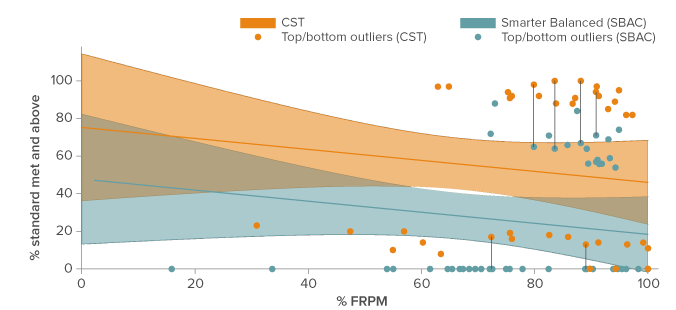
The solid diagonal lines in Figure 2 illustrate the relationship between the share of high-need students and the share meeting the standards at school districts, with orange for the CST and teal for the SBAC.5 We find a statistically measurable difference in the strength of the relationship between SBAC and CST scores and the district-wide percentage of high-need students. This is additional evidence that many districts-particularly those serving large high-need populations-had a difficult time adjusting to the new standards.
In Figure 2, the curved lines provide a sense of how this relationship varied across districts.6 The lines indicate the upper and lower bounds for the shares of 4th graders who met the ELA standard in 68 percent of demographically similar school districts.7 Overall, the scores were lower in districts with larger shares of high-need students, but in some districts student performance was either better or worse than expected, based on the shares of high-need students.8 The orange dots (for the CST) and the teal dots (for the SBAC) represent the 20 school districts that were furthest above or below expectations-these dots are mostly outside the curved lines.
These findings are important for districts that are performing below expectations for two reasons. First, these districts may not be aware of how far below average their high-need students are; and second, struggling districts may be able to learn from districts that are outperforming expectations.
Figure 2. In some districts, ELA results for high-need 4th graders are better-or worse-than expected
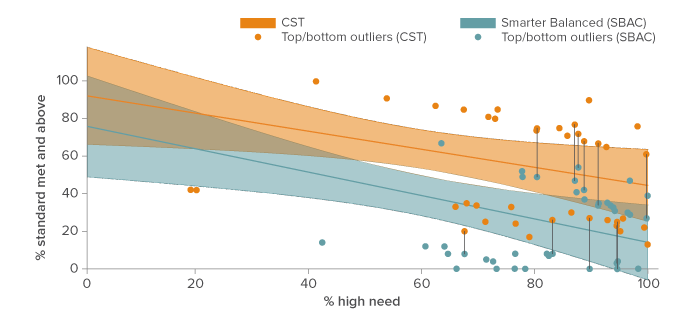
SOURCES: 2012-13 CST and 2014-15 SBAC.
NOTES: Figure includes all school districts. Top 20 and bottom 20 school districts are among those with at least 100 students tested in all grades. Schools only needed to be in operation for one test to be included in our analysis. County Office of Education schools (16 in total) were included.9
In some districts, high-need students performed similarly on both tests. In Figure 2, we indicate that a district that is a top-20 performer on both the CST and the SBAC with a line that connects its test score dots. This shows that even in top performing school districts, a much lower share of students met the standard on the new test. Six the top 20 districts on the CST also performed in the top 20 on the SBAC. Five of the bottom 20 districts on the CST were also in the bottom 20 for on SBAC.10
We further explore the relationship in performance across the two tests, still focusing on high-need students, but analyzing the results separately for EL and economically disadvantaged students, both of which are treated separately in LCAPs and accountability measures.
Economically disadvantaged students
We find among the top 50 districts for SBAC ELA performance for economically disadvantaged students, 30 percent of these districts were also top performers on the CST ELA.11 Nearly one-third of districts that exceeded expectations under the old standards are doing much better than expected with the new standards, as measured by these tests. Fifty-eight percent of districts in which economically disadvantaged students did well on the ELA portion of the SBAC were also likely to have good results on the math portion of the SBAC. More than a fifth (22%) of districts with good ELA results were also top performers on the CST ELA-as well as in SBAC math. At the other end of the spectrum, we found that 38 percent of districts among the lowest 50 performers were also at the bottom on the CST ELA. More than half of the districts with performance that was worse than expected on the SBAC ELA also fared poorly on the SBAC math (52%).
Figure 3. The 50 districts with the highest ELA scores on the Smarter Balanced for economically disadvantaged 4th graders had varying results on other tests
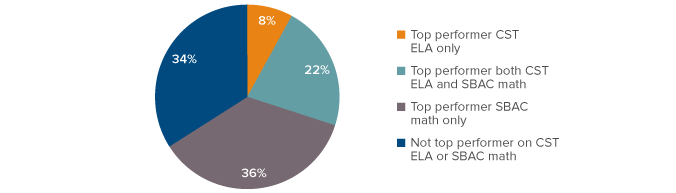
SOURCES: 2012-13 CST and 2014-15 SBAC.
NOTES: Top 50 districts are among those with at least 100 students tested in all grades. Schools only needed to be in operation for one test to be included in our analysis. County Office of Education schools (16 in total) were included.
English Learner students
To better understand the SBAC performance of EL students at the district level, we explored the degree to which districts with relatively high English Learner performance on the SBAC ELA overlap with top performers on other exams. Overall, 58 percent of the high-performing districts on the SBAC were also top performers on the CST ELA.12 Nearly three-quarters (72 percent) of the 50 top performing districts on the SBAC ELA were also top performers on the SBAC math. More than two-fifths (44 percent) of districts that were high performers on the ELA portion were also high performers on the CST ELA and in SBAC math. Among the 50 districts in which the EL population performed much worse than expected, 38 percent also underperformed on the CST ELA and 54 percent were underperformers on the SBAC math test.13 In 20 school districts, no 4th-grade EL students scored at or above the state standard on the ELA assessment. This means that many students will fall short of the standards for reclassification-as recently as 2012-13, 30 percent of school districts required scores of “proficient” on the CST in order for ELs to be reclassified (Hill, Weston, and Hayes 2014). Our finding implies that 4 percent of school districts would have no students eligible for reclassification based on that cut-off. In other words, some school districts have a great deal of work to do to improve EL student outcomes.
Figure 4. The 50 districts with the highest ELA scores on the Smarter Balanced for English Learner 4th graders had varying results on other tests
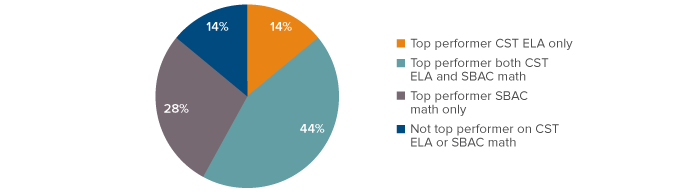
SOURCES: 2012-13 CST and 2014-15 SBAC.
NOTES: Top 50 districts are among those with at least 100 students tested tested in all grades. Schools only needed to be in operation for one test to be included in our analysis. County Office of Education schools (16 in total) were included.
Despite differences in standards, assessments, testing methods, and benchmarks for meeting the standards, there is some overlap between high-performing districts on the SBAC and CST. However, more than half of high-performing districts on the SBAC were not high performing on the CST.14 And for many districts, what worked well in the past does not appear to be working as well now. Future research could help low-performing high-need districts understand how other districts with similar shares of high-need students managed to exceed expectations.
Assessing Test Performance at the School Level
LCFF dollars flow to districts, and districts have both the responsibility and opportunity for improving all student outcomes and closing achievement gaps for students at their district schools. Annual results from the Smarter Balanced assessments should help districts evaluate progress toward those LCAP goals that rely on SBAC scores and evaluate whether their LCFF funding is being directed toward students and schools in the most beneficial manner. Here, we examine the performance of economically disadvantaged students and EL students at schools throughout the state.15 As with the district analysis, we focus on English language arts results for 4th graders. We find that as the share of economically disadvantaged or EL students increases at a school, those students exhibit lower test scores, on average, and we examine the performance of EL and economically disadvantaged students separately at their schools.
Economically disadvantaged students
Our analysis of school-level test results indicates that as the share of economically disadvantaged students in a school increases, the share of those students scoring at or above the level of the standard falls on both the CST and the SBAC. In Figure 5, this is illustrated with the solid, downward trending line. As we did at the district level, we find that some schools exceed or fall far below expectations. Because districts are responsible for improving educational outcomes, it is important to identify the schools that may need the most help. These struggling schools may benefit from the experience of schools that are faring relatively well on the SBAC.16
Four of the 20 schools in which economically disadvantaged students scored better than expected on the SBAC were also in the top 20 performers on the CST.17 Conversely, three of the 20 schools with scores that were much worse than expected on the SBAC were also low performers on the CST.18
Figure 5. In some schools, ELA results for economically disadvantaged 4th graders are better-or worse-than expected
SOURCES: 2012-13 CST and 2014-15 SBAC.
NOTES: Figure includes all schools. Top 20 and bottom 20 schools are among those with at least 100 students tested in all grades. Schools only needed to be in operation for one test to be included in our analysis. County Office of Education schools (16 in total) were included.
When we compare the results from top and bottom performing schools on the SBAC ELA to their experiences with the CST, we find that 26 of the top 100 SBAC performers were also among the 100 schools that exceeded expectations on the CST the most. Almost half (47%) of the top performing schools on the ELA portion of the SBAC were also top performers on the math portion. At the other end of the spectrum, we find that 18 of the bottom 100 performing schools were also among the bottom performers on the CST. Just 29 percent were on the bottom-performing lists for both the SBAC ELA and math tests.19
English Learner students
EL students are the least likely of all student groups to meet the state standards as measured by the SBAC-only 12 percent of 4th-grade ELs did so in the first year of testing. This means that in hundreds of schools, no EL students are meeting the state ELA standard. In Table 1, we list the schools with EL test scores in the top 20 on the SBAC (on the left) and the CST (on the right). Only three schools (Brentwood Academy in Ravenswood City Elementary School District, Otay Elementary in Chula Vista, and Robert Louis Stevenson in Wright Elementary School District) are top performers on both the CST and SBAC. (These schools are highlighted in the table.)
The biggest overachiever in terms of EL scores on the SBAC was Newhall Elementary in Newhall School District. Based on the school’s demographic profile, 6 percent of EL students would have been expected to meet or exceed the state ELA standard, but 52 percent actually did so.
Table 1. Three schools had top 20 results for 4th-grade ELs on both the SBAC and CST
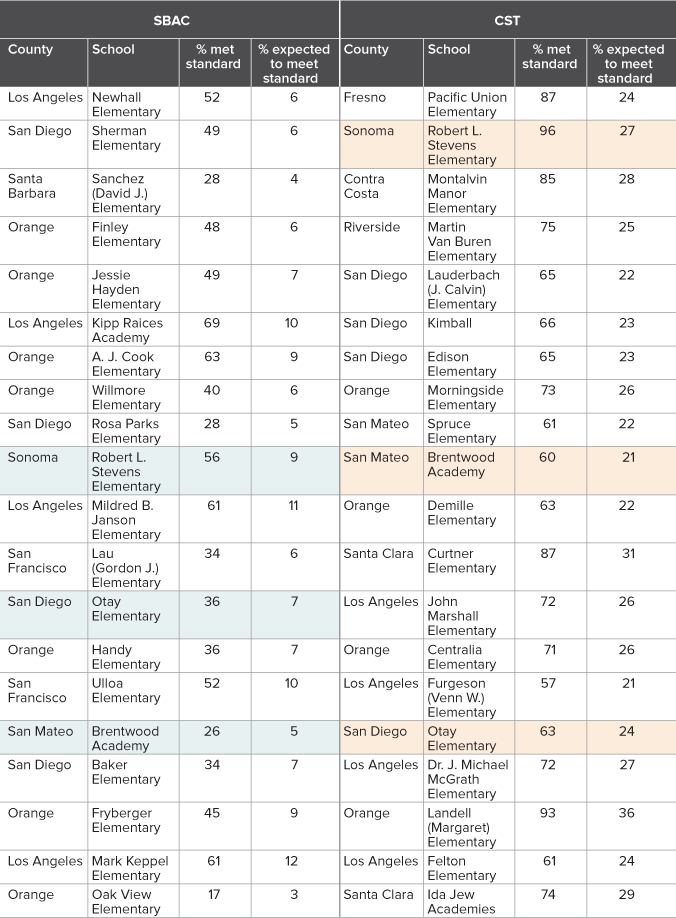
SOURCES: 2012-13 CST and 2014-15 SBAC.
NOTES: Schools that were top performers on both the SBAC and the CST are shaded in teal for the SBAC, orange for the CST. Only schools where at least 100 ELs were tested in all grades are included in the table. Schools only needed to be in operation for one test to be included in our analysis. County Office of Education schools (16 in total) were included. Table is sorted by the percentage difference between the expected and acutal score.
Four of the top 20 performers are in Westminster School District in Orange County, two are in San Diego Unified School District, and two are in San Francisco Unified School District.
Of the 1,653 schools with at least 100 EL students taking the SBAC, 273 (or 17%) had no 4th-grade EL students who met the ELA standards. The shares of EL students in these schools ranged from about 25 percent to 84 percent. We found no relationship between EL test scores (as opposed to the percentage who met the standard) and shares of EL students at these schools. Mean ELA scaled scores for ELs in these schools range from 2,307 to 2,396 (out of 2,663 possible points) at the lowest achievement level (“Standard Not Met”). When we include all schools with enough tested ELs (10 or more) to have their scores reported by CDE, we find that in 740 out of 3,464 schools (21%), no 4th-grade ELs who met the state ELA standard; in 748 of these schools, no ELs met the math standard.
The schools with no EL students meeting the SBAC standards are distributed across the state (Figure 6). In counties with at least 10 schools that administered tests to 100 or more ELs, the shares of schools in which no 4th-grade ELs met the state ELA standard are indicated by shading.
Figure 6. At hundreds of schools, no 4th-grade ELs met the state ELA standard
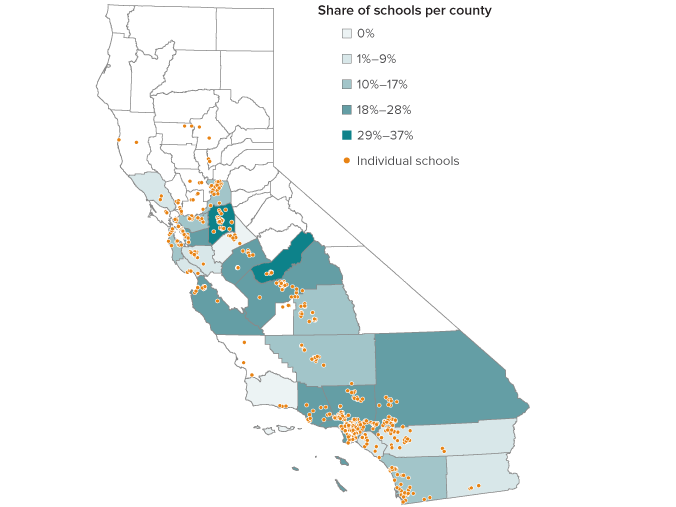
SOURCE: 2014-15 Smarter Balanced assessments.
NOTE: We calculated the share of schools where no students met the state ELA standard in counties with sufficiently large EL populations, excluding counties that had fewer than ten schools with more than 100 ELs. County Office of Education schools are included. Unshaded areas are counties in which there are fewer than 10 schools with at least 100 ELs, so we did not calculate the county share for schools not meeting the standard. We do report any individual schools where no 4th-grade ELs met the ELA standard.
In more than 30 percent of the schools in Madera and San Joaquin Counties that administered tests to 100 or more EL students, no ELs met the SBAC standards. The district with the largest number of schools in which no EL students met the ELA standards is Los Angeles Unified School District: in 182 of the 343 schools with more than 100 EL students, no students met the standards. There were 21 such schools in Oakland Unified (out of 34); and there were 31 schools (out of 45) with 100 or more ELs in which no ELs met the standards in Fresno Unified, 22 (out of 31) in Stockton, and 12 (out of 25) in Ontario Montclair.20
Overall, 30 percent of SBAC high-performing schools and 17 percent of SBAC low-performing schools are similarly ranked for the CST. In addition, there is a high degree of overlap in over-performers on the SBAC ELA and math tests (53%).21 However, there is much less overlap-just 8 percent-in the bottom performing lists for both ELA and math.
While there are some schools with high concentrations of successful EL students, many more are falling far short-in more than 700 schools, no tested EL students met the state standard. It will be important for these schools to find ways to help their EL students master the standards, especially because scores on the SBAC are likely to be an important criterion by which EL students will be evaluated for reclassification.
Policy Implications
With the advent of the Common Core standards and the SBAC assessments, the bar for “meeting the standard: is clearly higher. The first-year test results indicate that English Learners and economically disadvantaged students have the most ground to cover. However, in some districts and schools these students performed relatively well, including some whose students performed well on the CST, but also some in which students did not.
As California’s new accountability framework is being developed, educators at the district and school levels have a unique and important opportunity to examine their performance, and to learn from schools and districts that are having more success with the SBAC. The state should play a role in facilitating this process; the CORE districts’ peer matching program may prove to be a useful model. The CORE districts, a collection of 10 districts representing more than one million students, pair “schools of distinction” with demographically similar low-performing schools to encourage collaboration between their teachers and administrators. The State Board of Education could also facilitate research and encourage or require the California Collaborative for Educational Excellence and the county offices of education to enlist peer schools to provide technical assistance to struggling districts and schools.22
There is strong evidence that English Learner students have the farthest to go in meeting the new standards. In the past, the state ELA test was a critical factor in reclassification decisions. If this carries over to the new reclassification policy, the SBAC may become a large barrier to reclassification for many EL students. State policymakers should consider the findings we have presented when implementing the new EL standards and deciding how EL students will be reclassified.
Accountability in California is still evolving-there are many questions about the LCAP, the LCAP rubrics, the state replacement for the Academic Performance Index (API), and the federal Every Student Succeeds Act (ESSA). But, however these questions are resolved, the goal of the LCFF is clear: to improve outcomes for all students and close achievement gaps for high-need students. The first-year SBAC results provide an important call to action for districts and schools that are struggling to educate high-need students.
Topics
K–12 Education