
Summary
California’s nursing homes provide a major source of personal and medical care for the state’s most vulnerable residents-the elderly and the disabled. By 2030 the state’s 65-and-over population will grow by 87 percent. The number of people requiring skilled nursing care could increase by 32,000, far outstripping current capacities. We find that there will be significant disparities in regional growth rates across racial/ethnic groups and in regions’ abilities to absorb higher numbers of patients. Specifically:
- The Bay Area and the Inland Empire have the largest discrepancies between existing nursing home capacity and projected demand in 2030; Los Angeles and Northern California (excluding the Bay Area) have the smallest.
- Regional growth rates in the 65-and-over population vary widely within racial/ethnic groups. For example, rates among Latinos range from 159 percent on the state’s Southern Border (Imperial and San Diego Counties) to 193 percent in the Inland Empire; among Asians they range from 93 percent in the Central Coast to 212 percent in Northern California (excluding the Bay Area).
In order to meet the growing and changing demands for senior care at the statewide and regional levels, policymakers will need to address ways to increase nursing home capacity. These solutions must also include recruiting and training health workers who can provide effective, culturally competent care, whether in skilled nursing facilities or home- and community-based settings.
Introduction
California’s nursing homes provide support for some of the most vulnerable members of our society-the elderly and disabled. The number of people in these skilled nursing facilities is a small fraction of the population, but they comprise a disproportionate share of the demand for health equipment and services. Medi-Cal alone spent $4.5 billion on beneficiaries in nursing homes in fiscal year 2014 (Kaiser Family Foundation 2015). Over the past two decades, home- and community-based (HCBS) alternatives have become more widely accessible for patients with acute care needs, leading to a decline in the nursing home population. However, as the Baby Boomers reach retirement age demographic trends will lead to increased demand.1
Previous work by PPIC’s Laurel Beck and Hans Johnson projected that California’s 65-and-over population will grow dramatically by the year 2030-increasing by 87 percent from 4.6 to 8.7 million people-and estimated the number of people in nursing homes in 2030 statewide. The state’s seniors will also become considerably more racially and ethnically diverse, with high growth rates among the Latino and Asian populations (Beck and Johnson 2015).
These statewide trends are not uniformly distributed. Nursing home utilization will be affected by significant regional variations in population size and racial/ethnic makeup. For a number of reasons, nursing homes are used at very different rates across racial/ethnic groups. Anticipating these trends will be critical in effectively planning for the physical and human resources to support people with the greatest care needs. Stakeholders must anticipate not only the number of people requiring care, but also their language and other cultural characteristics.2
In this report, we examine projected differences across eight regions: the Bay Area, the Central Coast, the Inland Empire, the Los Angeles area, Northern California (excluding the Bay Area), the Sacramento Area, the San Joaquin Valley/Central Sierra, and the Southern Border (Imperial and San Diego Counties). We then compare these projections with current capacity. We highlight the regions likely to see the greatest increase in demand for care, as well as those likely to see the biggest shift in racial and ethnic makeup. Finally, we provide recommendations for state and local policymakers to help prepare for these changes.
Demographic Trends Will Shift Nursing Home Demand
In order to assess and prepare for the impact of rapid senior population growth on skilled nursing facilities by 2030, we must also project how this might differ across regions. For our initial analysis, we use projections from the California Department of Finance on the size, gender, and racial/ethnic composition of county populations in the year 2030. We begin by grouping the 58 counties into eight geographic regions.3 Figure 1 shows that although the number of people over 65 will grow at a high rate throughout the state, there is significant regional variation. The Inland Empire’s levels in 2030 will increase 105 percent over 2012 levels, compared to 68 percent in Northern California and 69 percent in the Central Coast. These projections are described in greater detail in Technical Appendix A.
Figure 1. Growth in the senior population will vary across regions
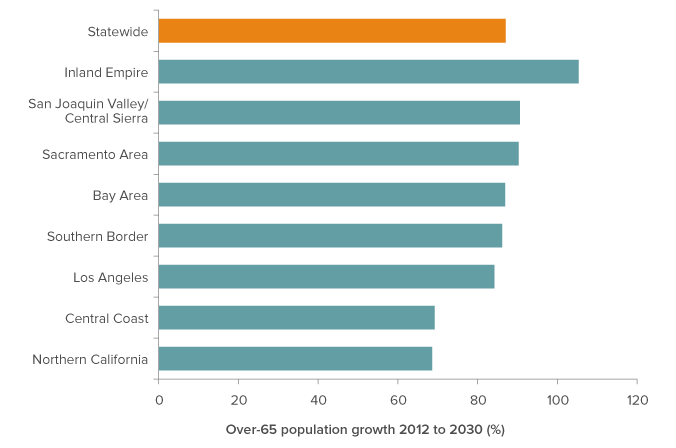
SOURCE: Authors’ calculations from California Department of Finance data.
NOTE: Regions comprise the following counties. Northern California: Butte, Colusa, Del Norte, Glenn, Humboldt, Lake, Lassen, Mendocino, Modoc, Nevada, Plumas, Shasta, Sierra, Siskiyou, Tehama, Trinity. Sacramento Area: El Dorado, Placer, Sacramento, Sutter, Yolo, Yuba. Bay Area: Alameda, Contra Costa, Marin, Napa, San Francisco, San Mateo, Santa Clara, Santa Cruz, Solano, Sonoma. San Joaquin Valley & Central Sierra: Alpine, Amador, Calaveras, Fresno, Inyo, Kern, Kings, Madera, Mariposa, Merced, Mono, San Joaquin, Stanislaus, Tulare, Tuolumne. Central Coast: Monterey, San Benito, San Luis Obispo, Santa Barbara. Los Angeles: Los Angeles, Orange, Ventura. Inland Empire: Riverside, San Bernardino. Southern Border: Imperial, San Diego.
Regional growth rates by race and ethnicity
Projected growth rates of California’s 65-and-over populations among racial/ethnic groups differ widely (Figure 2). Regional senior populations will become more diverse because of the fast growth rate in Latino and other minority populations, which are not distributed evenly throughout the state. The white population will grow significantly but at a slower rate.
In 2012, 61 percent of California’s seniors were white. By 2030 this will shrink to 50 percent (Beck and Johnson 2015). Regional growth rates vary widely within racial/ethnic groups as well (Table 1). For example, rates among Latinos range from 159 to 193 percent (Southern Border and Inland Empire, respectively), and among Asians from 93 to 212 percent (Central Coast and Northern California, respectively).
Figure 2. Regions across the state will have different racial/ethnic makeups
SOURCE: Based on authors’ calculations from California Department of Finance data.
NOTE: Specific growth rates for each racial/ethnic group from 2012 to 2030 are included in Technical Appendix B.
Regional Nursing Home Demand
To project the number of seniors in each region who will be in nursing homes in 2030, we supplement the Department of Finance’s population projections with survey data from the American Community Survey (ACS), which asks respondents about their age, race/ethnicity, and gender, but also about their marital status, whether they have difficulty caring for themselves, and whether they live in an institution.4 We use historical trends in those outcomes over time to project the likelihood of a person in each category residing in an institution in the year 2030. Table 1 presents regional projections for 2030. In general, we observe that the regions with the highest senior population growth will also have the largest increase in projected senior demand, although they are not perfectly correlated.
Table 1. All regions are projected to see an increase in demand for nursing home care
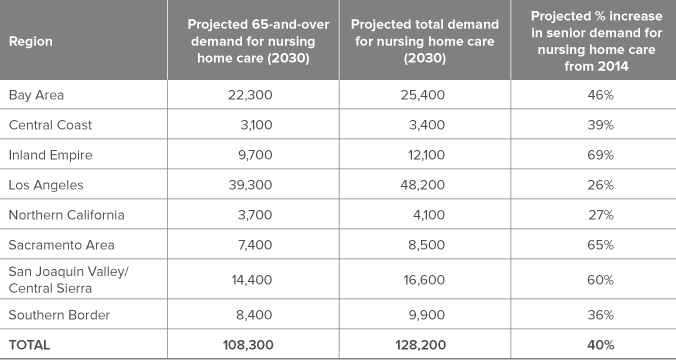
SOURCE: OSHPD Long-Term Care Utilization Data (2014). Authors’ calculations based on California Department of Finance data.
NOTE: Numbers may not sum exactly due to rounding. Projected Total Demand includes people of all ages, not limited to seniors. In 2014, 17 percent of state nursing home beds were used by patients under age 65. Growth in the under-65 nursing home population is assumed to match projected growth in the under-65 population within the region.
The percent increase in demand from 2014 to 2030 varies widely across regions.5 For example, Los Angeles will see the smallest increase —26 percent, and the Inland Empire the largest-69 percent.
We observe significant differences in nursing home utilization rates across age and racial/ethnic groups. The wide range in the growth rates of each region’s nursing home population is due to a number of factors, including current accessibility and historical usage. For example, greater HCBS availability in Los Angeles may have led to lower growth in demand.6
Diverse regional patient populations
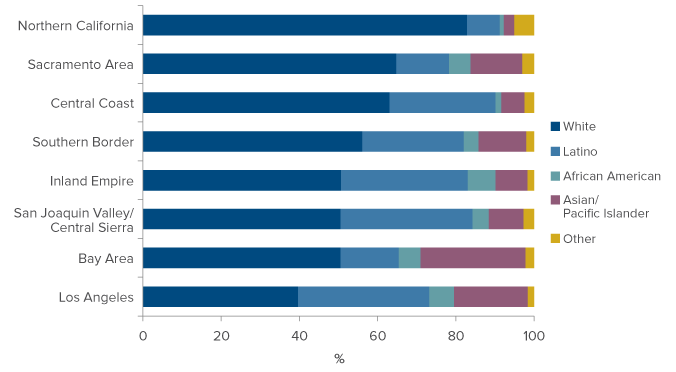
The variation across the state’s diverse regions will lead to very different nursing home patient populations. Historically, racial and ethnic minorities have used skilled nursing homes at lower rates than their representation in the general population. Nationally, there has been a decline in use within the older white population, coupled with an increase among older African American, Latino, and Asian/Pacific Islander populations (US Senate Commission on Long-Term Care 2013; Feng, et al. 2011). This reflects a number of factors, including financial resources, health disparities, enrollment in Medicaid (which will pay for long term nursing care for qualified enrollees), cultural preferences, family and community supports, and disparities in access to support services.7
Figure 3 displays the significant variation in racial/ethnic breakdowns of each region’s projected nursing home population. Northern California’s patients will be 83 percent white, compared to 44 percent in Los Angeles. African Americans will range from 3 percent in Northern California and the Central Coast to 13 percent in Los Angeles and the Inland Empire. The Bay Area will have the highest fraction of Asian/Pacific Islanders at 19 percent. The San Joaquin Valley/Central Sierra and Los Angeles regions will both have around 28 percent Latino patients.
Figure 3. Racial/ethnic composition of the 65-and-over nursing home population in 2030 will vary across the state
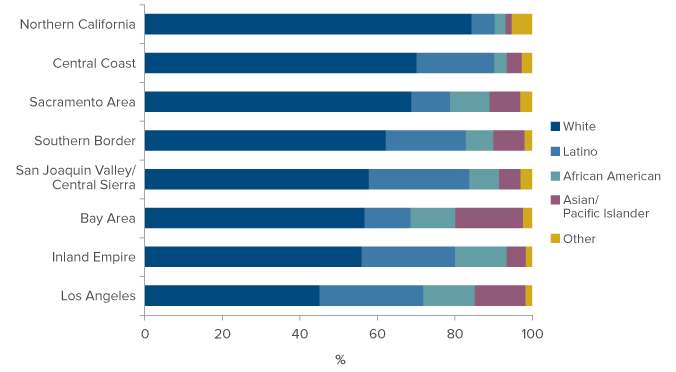
SOURCE: Based on authors’ calculations from Decennial Census and American Community Survey data.
NOTE: The projected population includes people over age 65 who will report living in institutional group quarters, adjusted to exclude projected prison populations.
Much of this variation can be attributed to the diversity of the total senior population in these regions, but across all regions we find that whites and African Americans will be overrepresented relative to their share of the total population and Asian/Pacific Islanders underrepresented. As we will cover later in this report, all of these demographic breakdowns are critical for anticipating the specific characteristics of each region’s potential nursing home clientele.
Current Regional Nursing Home Capacity
Current nursing home capacity and occupancy rates can help us understand projected demand. Table 2 presents estimates using Long-Term Care Utilization Data from the Office of Statewide Health Planning and Development (OSHPD). Capacity (measured in beds, 2014) varies widely across regions, but is largely proportional to population size. Occupancy rates, however, vary only slightly across regions, hovering around an average of 87 percent. In 2014, nursing homes statewide used an average of 70 percent of their total capacity to care for seniors, and 17 percent to care for adults younger than 65. Regionally, senior occupancy rates exhibit similar variation as total occupancy rates.
Table 2. Regions currently have different nursing home capacity
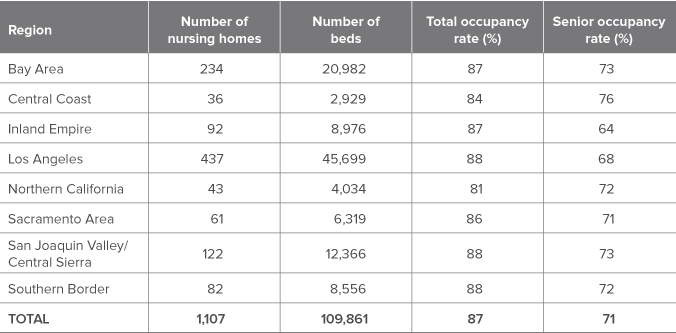
SOURCE: Office of Statewide Health Planning and Development, Long-Term Care Data 2014.
NOTE: Table information is limited to facilities currently operating and listed as “Skilled Nursing Facilities.” Total occupancy rate refers to the number of total number of nursing home patients divided by the number of beds. Senior occupancy rate includes only patients 65-and-over.
Meeting the Demand for Services
As we look forward to decades of growth in the senior population, we can expect greater demand for all health and personal services, including skilled nursing care. One approach to meeting demand will be to simply increase the number of facilities and beds available to patients requiring round-the-clock care. In addition, it is important to ensure that other living and care arrangements are affordable and accessible to patients requiring less support.
Increasing capacity statewide
As we anticipate an increase in the demand for skilled nursing care, we can also consider how the supply of beds has been changing over time. Figure 4 presents the number of beds available in California between 2004 and 2014. After a period of decline culminating in 2007, capacity increased statewide.8 Between 2007 and 2014, an average of 930 beds per year were added across the state. At that rate, the overall number of beds would be 124,700 by the year 2030, less than our projected total demand of 128,200.
Figure 4. Statewide nursing home capacity has been growing since 2007
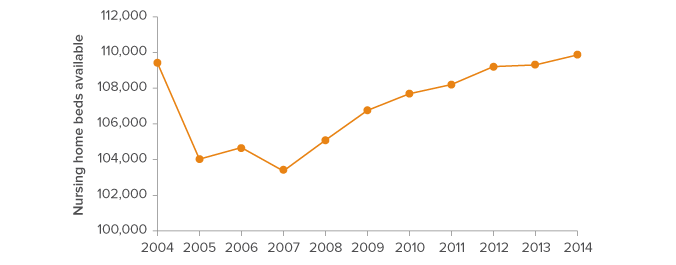
SOURCE: Office of Statewide Health Planning and Development, Long-Term Care Data 2014.
NOTE: Capacity is limited to facilities operating and listed as “Skilled Nursing Facilities.”
The statewide growth in nursing home capacity is driven by an increase in beds across most regions. As of 2014, each region had some excess capacity across their skilled nursing facilities. However, our projections show that all regions will see demand grow beyond their existing capacity by 2030 (Figure 5). As we have discussed above, the need for additional capacity will vary by region.9 In particular, San Joaquin Valley/Central Sierra, the Inland Empire, and the Bay Area will have far higher demand (4,234, 3,124, and 4,418 people, respectively) than the number of beds counted in the 2014 OSHPD data.
Figure 5. Most regions would need to increase capacity to meet projected demand
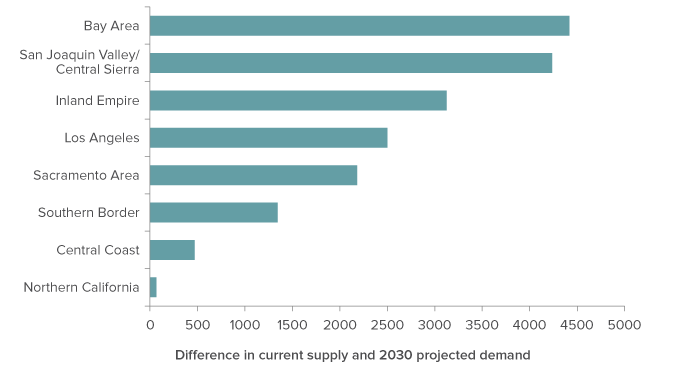
SOURCE: Office of Statewide Health Planning and Development, Long-Term Care Data 2014; author calculations based on Decennial Census and American Community Survey data.
NOTE: Current number of skilled nursing facility beds is based on 2014 data. Projected 2030 total demand includes both the over- and under-65 nursing home populations.
This does not imply that these regions will necessarily face a shortage of beds down the road; a lot can happen before 2030. Private sector companies may continue to increase capacity as demand grows. We may see a continued shift away from nursing home care towards HCBS care, or technological advances that enable more people to remain at home. But private and public stakeholders must be mindful of the need to increase nursing care capacity or to supply alternative living and care arrangements where appropriate.
Alternatives to skilled nursing care
In addition to increasing skilled nursing facility capacity across the state, we can also work to reduce improper placements in nursing homes. AARP estimates that 11.4 percent of seniors in California’s nursing homes do not require that level of care. For them, home- and community-based services and Residential Care Facilities for the Elderly (RCFEs) could be intermediate steps between independent living at home and placement in a skilled nursing facility.
In-Home Support Services
Most seniors prefer to receive care in their own homes, rather than move into an assisted living or skilled nursing facility (Pew Research Center Survey 2014). Not only is this arrangement often less expensive for people requiring only a little assistance, it can contribute to a higher quality of life. For low-income seniors and disabled adults who qualify for Medi-Cal (California’s Medicaid program), In-Home Supportive Services (IHSS) is a vital program.
IHSS provides funds to recipients who meet Medi-Cal’s eligibility requirements and who require some assistance with personal care. Beneficiaries can use the funds to hire a care provider, either a family member or someone from the community. In 2014, the average monthly number of IHSS recipients was 467,000 (Beck 2015). Higher income Californians do not qualify for IHSS, but may be able to hire personal or health support workers to enable them to remain in place. These services are often expensive, but cost considerably less than nursing home residence.
Residential Care Facilities for the Elderly
When seniors become unable to stay in their own home but do not require skilled nursing care, they can use Residential Care Facilities for the Elderly (RCFEs) otherwise known as assisted living facilities, retirement homes, or board-and-care homes. RCFEs are residential homes that provide supervision and non-medical care primarily for people age 60 and older.
Statewide the number of RCFE beds (180,596) significantly outnumbers skilled nursing facility beds. They are mostly in small homes, with a median facility size of six beds. The primary function of RCFEs is to provide assistance with non-medical daily activities. RCFEs cannot take care of individuals with specific medical needs or those requiring 24-hour nursing care.
Culturally competent care
The increasing diversity of California’s population highlights the importance of enabling disabled adults and seniors to remain connected to their communities, and training support workers and other health care professionals in the skills to care for them effectively. The 2013 Senate Commission on Long-Term Care included “awareness of an individual’s needs, preferences, cultural traditions, family situation, and values’ as part of their recommendation of maintaining a person- and family-centered long term services and supports (LTSS) system (US Senate Commission on Long-Term Care 2013). In addition to differences across racial/ethnic groups, there is considerable diversity in language, religion, and culture within each group. California policymakers face the challenge of providing this diverse population of seniors with culturally competent care.
Supporting those with the greatest need
The growing availability of HCBS provides valuable options for many seniors who would prefer not to move to a nursing home but require some assistance. However, skilled nursing facilities are sometimes the best environment for people with serious self-care limitations. For seniors struggling with multiple chronic conditions, or who suffer from dementia or Alzheimer’s disease, round-the-clock care may be necessary.10
For many people, finding an affordable home near family that provides specialized services is nearly impossible. Nursing home utilization rates within racial and ethnic groups has varied over time, which may reflect disparities in access to either nursing homes or HCBS.
State and local leaders have the dual task of providing options for disabled adults and seniors who want to avoid a skilled nursing facility, but also ensuring facility-based care for those who need one. In 2015 the California Senate Select Committee on Aging and Long-Term Care issued a report and recommendations focused on statewide leadership and planning to provide a less fragmented, person- and family-centered system. Their plan included reducing nursing home placements and planning for long term care needs, both of which would help the state address the potential shortfall we identify in this report (California Senate Select Committee on Aging and Long-Term Care).
Conclusion
In this report, we present projections of the size and makeup of California’s senior population in 2030, and how they will vary across regions. We find that growth rates, cultural diversity, and the need for increased capacity will differ significantly across the state. People age 65 and older who require care will need both physical facilities and qualified professionals with the training to support their health and cultural needs.
Coordinated planning will be critical in the following areas: increasing capacity, reducing improper nursing home placement, facilitating alternatives, taking into account racial/ethnic differences, and supporting patients with the greatest need. These projections imply significant challenges at all levels, but with foresight, policymakers can help seniors and disabled adults, and ensure equitable access to adequate, culturally competent services.
Topics
Health & Safety Net Population