

Summary
Despite strong economic growth, California continues to struggle with high rates of child poverty. Adverse circumstances faced by young children can have long-term physical, social, and behavioral consequences-negatively affecting their future education and economic well-being. A nuanced understanding of how child poverty varies across the state would help address this challenge. In this report, we examine regional and local differences in the economic circumstances of poor families with young children age 0-5. We find that:
- One-quarter of young children in California live in poverty. Regionally, child poverty ranges from around 20 percent in the Bay Area, Sacramento area, and Northern region to nearly 30 percent in the Central Coast and Los Angeles County. Statewide, Latino children and children with immigrant, young, or single parents are much more likely to be poor. Interventions that target one or more of these groups hold promise for reaching more young children in poverty.
- Most poor families with young children have at least one working adult. Parents in higher-cost regions are more likely to be working-not surprising, since these regions tend to offer more work opportunities and higher wages. In the Bay Area, Central Coast, and Orange County, between 79 and 81 percent of young children in poverty have at least one parent working full- or part-time, compared to around 60 percent in the Central Valley and Sierra. Reducing poverty in inland regions requires attention to improving employment readiness and job opportunities.
- Coping with housing costs while maintaining access to work is difficult in higher-cost regions. Despite higher earnings, poor families with young children in the Bay Area, Orange County, and San Diego County are more likely to be housing burdened, that is, to have housing costs that exceed half of total family resources. They are also more likely than those in inland and northern regions to live in overcrowded housing. Efforts to increase access to affordable housing-through more construction and more housing subsidies-will help.
- Safety net programs reduce child poverty, with more of an impact in lower-cost regions. Without the safety net, poverty rates among young children would be 24 percentage points higher in the Central Valley and Sierra, compared to 8-9 points higher in the Bay Area and Orange County. Poor families in higher-cost regions are less likely to be eligible for safety net programs, which usually do not account for variation in the cost of living. In the long term, adjusting eligibility and benefits to accommodate differences in cost of living may deserve further consideration, but in the short term, there is room for improvement to broaden the reach of these programs, even without expanding their scope.
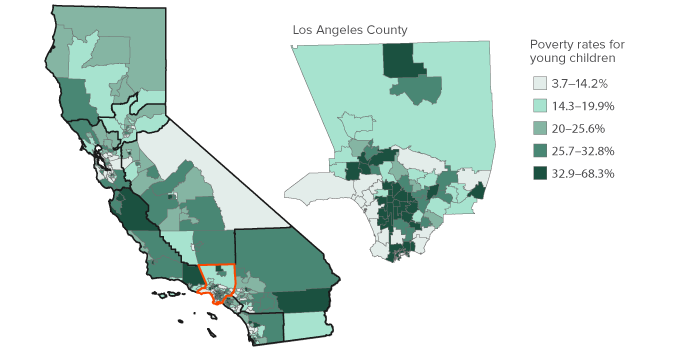
We also find that local variation in economic circumstances can overwhelm broader regional differences. For example, in Los Angeles, the poverty rate among young children ranges from 4 percent to 68 percent between southwestern and southcentral parts of the county-the lowest and highest rates in California. This report accompanies an online interactive tool that allows for in-depth exploration of the complexity of child poverty across the state.
Child poverty can be tackled in multiple ways, and policy responses may need to take different forms in various parts of California. Accounting for geographic differences can lead to more tailored approaches for alleviating child poverty and, in turn, help provide economic security for more young children.
Introduction
One-quarter of children in California live in families that lack sufficient resources to meet their basic needs (Bohn and Danielson 2017; Bohn and Danielson 2014). This level of need-among the highest in the country-has been slow to improve even during the state’s strong economic expansion following the Great Recession (Renwick and Fox 2016).1 Poverty among young children is a particularly critical issue. Adverse circumstances faced by young children can contribute to negative educational, employment, and health outcomes over the long term, and as such are the focus of much attention among policymakers and the public (Chetty et al. 2016; Ratcliffe 2015; Engle and Black 2008).
This report documents the geographic concentration of poverty and related factors to help policymakers and local stakeholders better understand the complex economic circumstances of poor young children age 0-5 in California. First, we assess variation in child poverty rates and the characteristics of young children in poverty, including demographic traits and family resources. Next, we look at education and employment, cost of living, and social safety net programs-three areas that lend themselves to policy intervention. This analysis does not examine the causes of poverty in different parts of California. Rather, by identifying geographic commonalities, we aim to shed light on prevailing factors connected to child poverty in local areas and broader regions.
We have long known that the poverty rate varies across regions and counties in the state. But our current analysis finds dramatic differences within regions and counties: even in parts of California with fewer poor children, we see high poverty rates concentrated in relatively small local areas. This is concerning: recent research finds that the geographic concentration of poverty results in diminished economic opportunity for children as they grow up (Chetty and Hendron 2015). However, a more comprehensive understanding of local factors could help improve approaches to reducing poverty.
This report focuses on broad regional trends in the economic circumstances of poor young children across the state. PPIC’s online interactive tool permits an in-depth exploration of this topic at the local, regional, and state levels. Our research describes patterns across the following geographies:
- 9 regions: the Northern region, the Sacramento area, the Bay Area, the Central Valley and Sierra, the Central Coast, the Inland Empire, Los Angeles County, Orange County, and San Diego County.2
- 265 areas: designated by the US Census Bureau, these Public Use Microdata Areas (PUMAs)—which we refer to as “areas” or “local areas” comprise at least 100,000 people. They represent the smallest area identified in large-scale Census Bureau survey data that allows us to parse detailed socioeconomic characteristics of young children. In populous parts of the state, counties are made up of multiple local areas, but in rural regions, local areas may comprise an entire county or group of counties.3
To better understand the geographic variation in child poverty, we rely on the California Poverty Measure (CPM) for the years 2011-2014. The CPM is an ongoing joint research effort between PPIC and the Stanford Center on Poverty and Inequality (Bohn et al. 2013). Data used in the CPM are based on large-scale Census Bureau surveys of the population, augmented with information from California administrative sources, tax records, and more. Unlike the federal poverty measure, the CPM accounts for all resources families have on hand to meet their basic needs-in particular, measuring the value of social safety net resources and out-of-pocket medical and child care expenses. Additionally, instead of benchmarking family resources to a federal poverty standard that is the same everywhere in the country, the CPM judges poverty by comparing resources to a standard that accounts for the variable cost of living in different counties of California. This cost-adjusted poverty threshold ranges from a low of $23,800 in Imperial County to a high of $37,100 in San Francisco County (for a family of four with young children who rents).4
Notes on Methodology
- This report focuses on young children age 0-5. Detailed tabulations for young children and all children (age 0-17) are available here.
- Poverty is determined using the California Poverty Measure, which compares family resources to a threshold of basic needs adjusted for family size, cost of living, and whether the family rents or owns a home (with or without a mortgage).
- Family resources are measured comprehensively, including earnings, taxes paid or tax credits received, and the cash value of safety net benefits, minus medical and work-related expenses (such as child care).
- Safety net benefits include the largest safety net programs: CalFresh (the state’s food stamps program, known federally as the Supplemental Nutrition Assistance Program, or SNAP); CalWORKs (the state’s cash assistance program for families with children, known federally as Temporary Assistance for Needy Families, or TANF); General Assistance; the federal Earned Income Tax Credit (EITC); the federal Child Tax Credit (CTC); Supplemental Security Income (SSI/SSP); federal housing subsidies; the Supplemental Nutrition Program for Women, Infants, and Children (WIC); and school breakfast and lunch.
- All statistics refer to the average over 2011-2014.
- All dollar values are presented in 2014 terms.
- See Technical Appendix A for additional details.
A Geographic Overview of Child Poverty
Poverty among young children in California is high. About 754,000 young children (25% of all children age 0-5) live in poverty. On average, poor families with young children have resources that total about two-thirds (67.7%) of the poverty line. For the average young child in poverty, this means that their family has total resources, including earnings and safety net benefits, below $26,100 per year for a family of four.5
The severity of the gap between resources and needs-how far below the poverty line poor families fall-affects children’s education, employment, and health outcomes over the long term (Ratcliffe 2015; Engle and Black 2008). Although many young children experience poverty, a much smaller share are in deep poverty, defined as having total resources that are less than half of the poverty line. About 172,600 young children (5.7% of all children age 0-5) are in deep poverty across the state. Among families with young children in deep poverty, resources average $12,500 per year for a family of four, or under a third of the poverty line.
Local Variation in Child Poverty Is Dramatic
Across regions, poverty among young children is lowest, around 20 percent, in Northern California (the Northern region, Sacramento area, and Bay Area) and highest, nearly 30 percent, in Los Angeles County and the Central Coast.6 However, variation in poverty rates at the local level overwhelms these broader regional differences.7 Even more prosperous regions of the state include geographically concentrated areas with high rates of child poverty.
Across local areas, the share of young children in poverty ranges dramatically: one in five local areas have child poverty rates below about 14 percent and, at the other extreme, one in five have child poverty rates above roughly 33 percent. In fact, Los Angeles County has both the lowest and highest estimated poverty rates among young children in the state-only 4 percent in an area that includes Redondo Beach, Manhattan Beach, and Hermosa Beach in the southwestern part of the county, compared to 68 percent in southeastern Los Angeles and eastern Vernon Cities (see online interactive tool).8
Figure 1. Poverty among young children is highly variable, especially in coastal areas like Los Angeles County
SOURCE: Author calculations from the 2011-2014 California Poverty Measure.
NOTE: Poverty rates for young children age 0-5 for the local areas (PUMAs) in California are shown in quintiles. Black borders designate nine regions across the state. Local estimates that do not meet sample-size and/or margin-of-error criteria are not shown (see Technical Appendix A for details).
Children with Immigrant, Young, or Single Parents Are More Likely to Be Poor
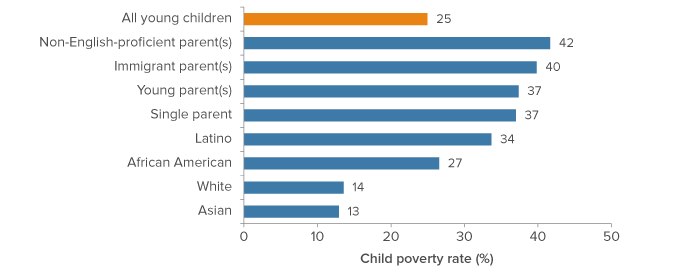
Among young children, those who are Latino and who have immigrant, non-English-proficient, young (under 25), or single parents are more likely to be poor. Poverty rates in these demographic groups are between 34 and 42 percent, about 9-17 points higher than the statewide rate of 25 percent (Figure 2). Many of these characteristics are highly correlated with each other.9 However, even when controlling for these characteristics, our analysis finds that each trait is independently associated with a 10-15 point higher likelihood that a young child is poor.10 Further, this finding is similar across regions. This overlap suggests that targeting one or more of these characteristics may hold promise for reaching high-poverty groups of young children across the state.11
Figure 2. Young children in some demographic groups are much more likely to be poor
SOURCE: Author calculations from the 2011-2014 California Poverty Measure.
NOTES: Statewide poverty rates for young children age 0-5 calculated within the given demographic subgroup.
Despite this clear statewide pattern, it is important to note that, in some local areas, race/ethnicity, immigration status, and family composition are not at all tied to poverty status. For example, in Piedmont and the eastern section of Oakland in the Bay Area, the poverty rates among young Latino children and children with immigrant parents are only 1 percent (see online interactive tool).
Poor Families Rely More on Earnings in Higher-Cost Regions
On average, 47 percent of resources for poor families with young children come from earnings (pre-tax income from wages and salaries). The remainder is made up of assistance from large-scale social safety net programs-including CalFresh, CalWORKs, and the federal EITC (see textbox above for full list)—and other, relatively small, sources of income.12
We find that poor families with young children in coastal California rely more on earnings than safety net benefits. In contrast, in inland and northern regions, earnings comprise a somewhat smaller share of family resources. These findings make sense, given that coastal regions of the state tend to have more job opportunities, and poor families living in these regions generally have higher earnings than those in inland regions (Bohn and Danielson 2014). Among poor families, higher earnings in higher-cost regions do not always offset the higher cost of living-urban coastal areas tend to have the highest poverty rates-but they do appear to affect families’ access to safety net programs, as we will see in later sections of this report.
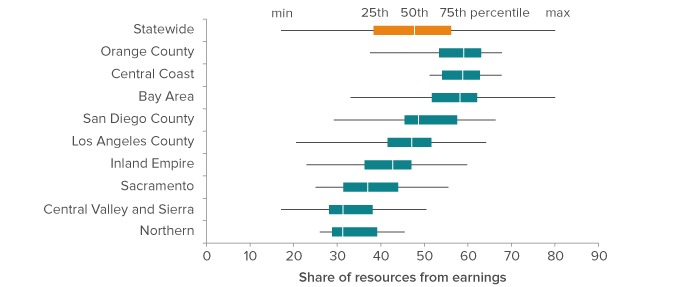
Figure 3 shows the regional and local variation in the share of family resources from earnings. Within each region, the boxes display the 25th to 75th percentile across local areas and the dividing line shows the median; the horizontal lines stretch to the minimum and maximum values. For example, across local areas in Orange County, between 38 and 68 percent of total resources among poor families with young children come from earnings; the middle 50 percent rely on earnings for 53-63 percent of their total resources. Orange County, the Central Coast, and the Bay Area stand out as regions where poor families with young children rely more on earnings-and less on the safety net-relative to the rest of the state.
Figure 3. Poor families with young children rely more on earnings in higher-cost regions
SOURCE: Author calculations from the 2011-2014 California Poverty Measure.
NOTE: Chart shows the variation among poor families with young children across local areas (PUMAs), suppressed if the sample size or margin of error do not meet our criteria. The boxes indicate the 25th, 50th, and 75th percentile of average share of resources from earnings across local areas. Lines stretch to the minimum and maximum values within the region. Families with zero earnings are included in the calculation but those with zero or negative total resources are omitted.
For the most part, local variation in the share of resources from earnings appears to track with regional variation (Figure 3). Locally, the share of poor families’ resources from earnings ranges widely-from 17 percent at the low end (in the Central Valley and Sierra) to 80 percent on the high end (in the Bay Area). Almost all local areas in the Central Coast and Orange County are above the statewide median; at the other extreme, almost all local areas in the Northern region, Central Valley and Sierra, and Sacramento area are below the statewide median. However, there are exceptions-for instance, we see local areas in the Inland Empire where about 60 percent of family resources come from earnings, though the median in this region is only 43 percent.
Factors Affecting Poverty
Young children in poverty can have markedly different family circumstances. As we will see below, the extent to which poor families rely on earnings or the safety net is closely related to parents’ education and employment, cost of living, and access to safety net programs-all of which interact with child poverty in distinct ways across regions.
Education and Employment Matter More in Some Regions
Parents’ educational attainment and employment status affect the well-being of their children, both in the short term and the long term. Previous PPIC research indicates that the economy in California generally requires education beyond the high school level, meaning that adults who lack college credentials often face limited earnings potential (Johnson, Mejia, and Bohn 2015). Additionally, a national retrospective study finds that children who experience poverty and whose parents lack a high school degree are at a higher risk of not completing high school themselves, which in turn affects employment opportunities (Ratcliffe 2015).
Overall, we find a strong correlation between parental education and employment and child poverty: young children in poverty are much more likely to have parents who are less educated and who have a more tenuous attachment to the workforce (working part-time or unemployed).13 Statewide, 37 percent of young children in poverty have parents who lack a high school degree, more than three times the rate of non-poor children. Similarly, 21 percent of young children in poverty have parents with only part-time work, two and half times the rate of young children who are not poor.14
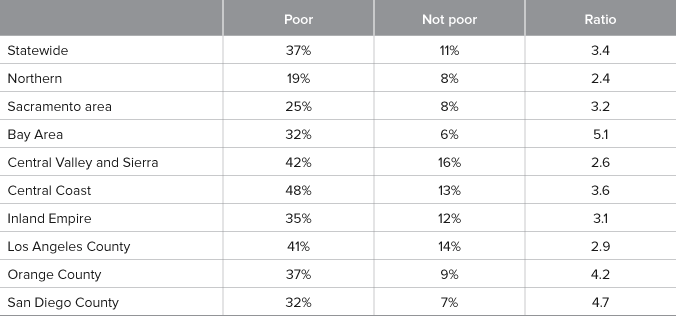
Yet education and employment matter more in certain regions. Table 1 shows the share of poor parents with young children who have no high school degree compared to their non-poor counterparts. In the Bay Area, we see that poor young children are five times as likely to have parents who did not complete high school, compared to non-poor children. We see similarly high disparity in San Diego County and Orange County, but lower ratios in the Northern region and the Central Valley and Sierra region. Our analysis of parents who are employed part-time or unemployed also indicates similar regional variation.15
Table 1. Poor young children are much more likely to have parents who lack a high school diploma
SOURCE: Author calculations from the 2011-2014 California Poverty Measure.
NOTES: Regions are listed north to south. Table shows the share of poor and non-poor young children whose parents do not have a high school diploma or GED. The last column calculates the ratio of the two shares as a measure of the disparity between the two groups.
Across the state, most poor families with young children have at least one working adult. Once again, we see regional differences: parents are much more likely to work full-time or part-time in regions of the state with the most robust economies. In the Bay Area, 81 percent of young children in poverty have at least one parent working full- or part-time (see Figure 4). Rates are similar in Orange County (79%) and the Central Coast (79%). In the Central Valley and Sierra, Sacramento area, and Inland Empire, between 60 and 66 percent of young children in poverty have at least one working parent. These trends are generally in line with regional variation in average educational levels and employment opportunities.
Figure 4. Most poor families with young children have at least one working adult
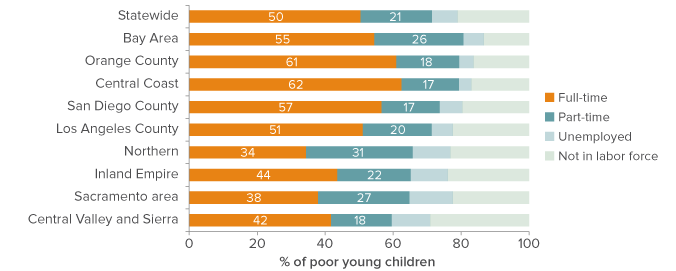
SOURCE: Author calculations from the 2011-2014 California Poverty Measure.
NOTES: Chart shows the share of poor young children whose parents or guardians have at most the given employment characteristic.
Housing Costs Are a Burden for Many
The ability to meet basic needs is a function of resources and costs. In California, we estimate that, to be out of poverty, a family of four needs about $31,000 per year on average. But this threshold varies substantially across the state, as we noted above.16 The cost of housing is a principal factor in family budgets and drives differences in the cost of living.
Statewide, a third of poor young children live in families that are housing burdened-that is, they spend more than half of their resources on rent or mortgage. Across regions, this rate ranges from 24-25 percent in the Northern region and Central Valley and Sierra region to around 38 percent in the Bay Area, Orange County, and San Diego County. Not surprisingly, housing burden is strongly associated with a family’s reported housing costs across the state (see Figure B1 in the technical appendices). Northern and inland regions of California have the lowest housing costs and, for the most part, the lowest local rates of housing burden. Coastal, urban regions typically have higher housing costs and higher rates of housing burden.
Despite these broader trends, local variation within regions is sometimes considerable. For example, though the Bay Area’s overall rate of housing burden is 37 percent, local areas in the region have rates as low as 13 percent in Bayview-Hunters Point and as high as 87 percent in Cupertino, Saratoga, and Los Gatos (Figure 5).
Figure 5. Rates of housing burden vary considerably across the state, even within regions
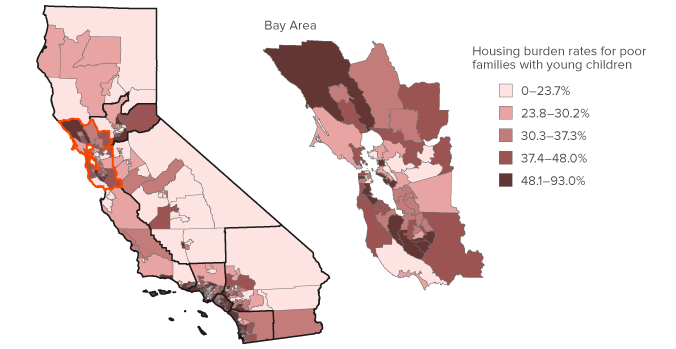
SOURCE: Author calculations from the 2011-2014 California Poverty Measure.
NOTE: The percentage of poor families with children age 0-5 who are housing burdened for each local area (PUMA) are shown in quintiles. Black borders designate nine regions across the state. Local areas are suppressed if they do not meet the sample-size and/or margin-of-error criteria (see Technical Appendix A). PPIC’s online interactive tool provides further detail on rates of housing burden across the state.
The resources poor families devote to housing are the result of many considerations, including location and quality. Statewide, 55 percent of poor young children live in overcrowded housing, nearly twice as many as non-poor children (see Table B5 in the technical appendices).17 The odds of living in overcrowded housing as a poor young child are slightly higher in the Bay Area, Orange County, and San Diego County. Los Angeles has a high share of poor young children in overcrowded housing (67%). However, non-poor children in the county are also more likely to be in overcrowded housing, so the difference is not as striking as in other parts of the state.
Because higher-cost regions of California tend to be larger, urban centers where the majority of jobs in the state are located, families with young children must balance housing choices with the ability to make ends meet. One way to cope with a high cost of living might be to move farther from job centers and/or to commute longer distances. Although we find that poor young children’s families are more likely to have moved in the past year (19%) than those not in poverty (15%), the difference is not large. We also examined how commute times vary across families and found even smaller differences; the commute times for working parents of poor young children are typically a bit shorter (median of 20 minutes) than among parents of non-poor children (25 minutes).18 At the same time, very long commutes of an hour or more are a fact of life for about 10 percent of both poor and non-poor working parents with young children. Extreme commutes are somewhat more common for poor parents of young children in Los Angeles County and the Inland Empire, as well as those in the Central Valley and Sierra region (see Table B5 in the technical appendices).
Poor families with young children in higher-cost regions of California are more likely to be working full-time or part-time and rely more on earnings than the safety net. However, those additional earnings do not fully compensate for the higher cost of living. Some families may cope by residing in smaller homes. As we will see below, less access to social safety net resources also hinders the ability of these families to meet basic needs.
The Impact of the Safety Net Varies
Safety net programs generally supplement earnings to help families avoid severe economic need. These programs-which include cash assistance, nutrition assistance, housing subsidies, and low-income tax credits-make up 44 percent of poor families’ resources statewide and substantially mitigate poverty. Previous PPIC research has found that, because of their scale and broad access, CalFresh and the Earned Income Tax Credit are key programs in lowering child poverty (Bohn and Danielson 2017). One way of measuring the safety net’s role in helping families meet basic needs is to hypothetically zero out existing programs. In this scenario, poverty among young children would jump 15 points, to 40 percent.19
The role that the safety net plays in alleviating economic need varies across the state, with higher-cost regions generally seeing a smaller reduction in poverty from these programs. This suggests that programs have a greater impact in inland and northern regions. If safety net resources are not counted in family budgets, child poverty rates would range from a low of 28 percent in the Bay Area to 48 percent in the Central Valley and Sierra’substantially higher than what we see now.
Figure 6 shows the estimated increase in child poverty in the absence of the safety net. We see the largest increases (18-24 percentage points) in inland and northern regions: the Central Valley and Sierra, Northern region, and Inland Empire. In the Bay Area, Orange County, Central Coast, and San Diego County, we see smaller increases (8-12 points). This is driven in part by higher earnings in the latter regions-due to higher wage levels and/or stronger attachment to work, as seen in the previous section. Having relatively higher earnings means that families in higher-cost regions are less likely to qualify for social safety net benefits, even if they are in poverty. It takes more to meet basic needs in higher-cost coastal California, but this is not taken into account when determining eligibility for most safety net programs.
Figure 6. Safety net resources have the greatest impact in inland and northern regions
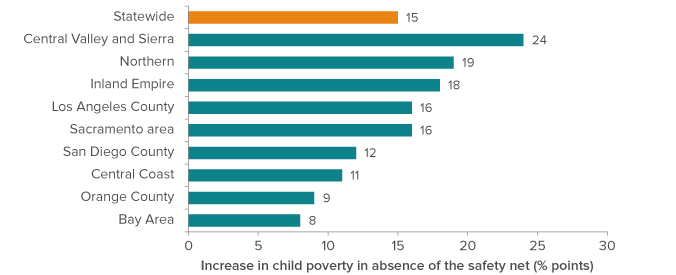
SOURCE: Author calculations from the 2011-2014 California Poverty Measure.
NOTES: Change in poverty rate for young children age 0-5, if family resources excluded CalFresh, CalWORKs, EITC, CTC, GA, SSI, school meals, WIC, and housing subsidies.
We also assess variation in whether families use specific programs, focusing on CalFresh, CalWORKs, and the federal EITC. Table 2 shows how the share of poor families with young children who participate in these three major safety net programs varies across the state. Generally, CalFresh is the program covering the largest share of poor families with young children. However, coverage varies from 55 percent in San Diego County to 85 percent in the Central Valley and Sierra. The share of poor families benefitting from CalWORKs is lower across the state. EITC coverage is generally in between. Because the EITC is contingent upon working (and filing taxes), receipt tends to be higher in regions with lower unemployment.20 There is substantial local variation in coverage across all three programs: 31-92 percent across local areas for CalFresh, 4-75 percent for CalWORKs, and 27-96 percent for EITC (see online interactive tool). However, the same pattern generally holds; most areas see somewhat higher CalFresh usage and lower CalWORKs usage, with EITC usage often falling in between.
Table 2. Poor young children’s access to safety net resources varies across California
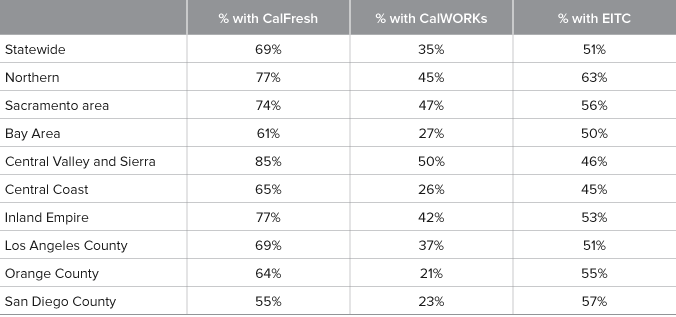
SOURCE: Author calculations from the 2011-2014 California Poverty Measure.
NOTES: Regions listed north to south. Table shows usage among poor families with young children age 0-5.
Eligibility for each of the programs shown in Table 2 varies according to program-specific rules regarding earnings, work status, family size, and citizenship status. Characteristics can also affect the likelihood that families participate, even if they are eligible: cultural norms may play a role, and eligible families earning relatively higher incomes may be less likely to participate in programs that ratchet benefits down as earnings rise (Stuber and Schlesinger 2006; Whelan 2010).
Regional differences in the impact of the safety net are partially attributable to systematic variation in factors that make families eligible or likely to participate-more or fewer earnings, demographic characteristics, and family composition. But when controlling for these characteristics, we still find important regional differences in the likelihood that a poor family with young children uses resources from safety net programs. We often see higher usage in inland and northern regions:21
- Use of CalFresh is systematically higher in the Northern region and in the Central Valley and Sierra. Poor families with young children who are otherwise similar but reside in coastal areas (the Bay Area, Los Angeles County, Orange County, and San Diego County) have lower usage.
- Use of CalWORKs is more disparate, with usage notably higher for poor families with young children in Los Angeles County, the Northern region, and inland regions of the state.
- Poor families with young children are less likely to use the EITC in the Bay Area and Central Coast compared to the rest of the state.
In sum, while eligibility and demographic factors may somewhat constrain the safety net’s ability to increase family resources, especially in higher-cost regions, our analysis suggests that in these regions there is still room to improve participation among eligible families. That is, there are opportunities to extend the reach of the social safety net, even with no changes to its current scope.
Conclusion
This report highlights the wide variability in child poverty across the state. Even though child poverty is thought to be much lower in some parts of the state, we find local areas in nearly every region of California with very high rates of poverty among young children. The geographic concentration of poverty suggests that taking into account local and regional factors may help interventions effectively reach more poor children.
We find that parents’ low educational level and tenuous labor market attachment are more closely associated with poverty in coastal, higher-cost regions of the state. Not surprisingly, housing burden also tends to be higher in this part of the state, with more poor families facing housing costs that exceed half their total resources. While families in these regions more often work full- or part-time, this stronger labor force attachment does not compensate for the higher cost of living. Eligibility requirements for the social safety net-which largely do not take into account variation in cost of living across the state-may eventually be a limiting factor, but there are still opportunities to increase access to these programs. Conversely, lower-cost parts of the state may see better access to the safety net, but economic success is tied to employment, so that these families likely struggle with upward mobility.
A better understanding of the characteristics of children in poverty can enable policymakers to think strategically about public investments. Our analysis suggests that varying approaches may be needed in different parts of the state. In certain areas, underenrollment in safety net programs is an important factor. In others, actions over the long term to increase job market skills are key. And for much of California, high housing costs loom large.
PPIC’s online interactive tool allows for deeper investigation into the local differences in the trade-offs poor families with young children make between housing, work, and safety net participation. Future PPIC research will examine the potential impact of specific policy actions centered on housing and employment in different parts of the state. Interventions that take into account such geographic differences could serve to improve the economic security and future well-being of California’s young children.
Topics
Health & Safety Net Population