

Summary
- Low college graduation rates come at a high cost-lower salaries, lower tax revenue, and fewer college graduates in the workforce. At California State University (CSU), the nation’s largest university system, graduation rates have an outsized financial and economic impact on students and the state.
- CSU has made strides in improving graduation rates, but there is more work to be done. The system continues to struggle with graduation gaps-underrepresented students are much less likely to complete their degree compared to their peers, and these gaps have not narrowed over time. Also, CSU’s on-time (four-year) graduation rates still lag behind those of similar universities nationwide.
- By 2025, CSU aims to further increase graduation rates while cutting graduation gaps in half. To assist campus planning for this goal, we identify several promising programs and policies. More broadly, the CSU Chancellor’s Office must work with campuses to evaluate and expand successful efforts, and the state must play a role in supporting new policies to move the needle on graduation gaps and on-time graduation.
Graduation Rates at CSU
California State University (CSU), the largest university system in the nation, serves more than 460,000 students annually. Compared to the University of California, CSU’s 23 campuses educate a more ethnically diverse population at a lower cost to students and the state. However, historically, CSU has struggled with low graduation rates. Until 2008, only about half of CSU freshmen graduated within six years, and students from historically underrepresented racial/ethnic groups-African American, Latino, and American Indian students-had even lower graduation rates.
Higher graduation rates benefit both the state and individual students. When more students graduate, California’s investment in higher education and financial aid sees a higher return. College graduates generate more tax revenue, rely less on state and federal assistance, and increase the supply of college-educated workers (Johnson, Cuellar Mejia, Ezekiel, and Zeiger 2013). Indeed, the state needs more college graduates to shrink a projected skills gap (Johnson, Cuellar Mejia, and Bohn 2015). Students who earn degrees also benefit more from their investment in higher education, as college graduates generally have higher salaries and better health outcomes compared to those who did not receive a four-year degree (Baum, Ma, and Payea, 2013; Johnson, Cuellar Mejia, Ezekiel, and Zeiger 2013).
Over the years, CSU has worked to increase its graduation rates through a combination of campus efforts and system-wide coordinated actions. Most recently, in 2009, the system launched an initiative as a part of the nationwide Access to Success project of the National Association of System Heads and the Education Trust. CSU aimed for six-year graduation rates at each campus to reach at least the top quartile among similar institutions nationwide by spring 2015.1 Additionally, CSU sought to cut the graduation gap between underrepresented minority students and their peers in half.
As the 2015 Graduation Initiative wrapped up, CSU announced the launch of a new initiative aimed at 2025 (CSU Office of the Chancellor n.d.b.). This effort expands upon the original initiative, bringing attention to transfer students, low-income students, and time to degree. To further the progress made during the first initiative, CSU seeks to increase its six-year graduation rate to 60 percent and reduce by half the graduation gap between underrepresented minority students and their peers by 2025. Additional goals include increasing on-time graduation rates for freshmen and transfer students-four years for freshmen, two years for transfers-and closing graduation gaps between low-income students and their peers.2 Altogether, the system hopes to produce 100,000 additional graduates by 2025 as a result of this initiative.
2015 Graduation Initiative Results
For the 2015 Graduation Initiative, CSU aimed to increase the overall six-year graduation rate to 54 percent and the six-year graduation rate of underrepresented minorities to 51 percent (CSU Office of the Chancellor n.d.a.). From 2009 to 2015, CSU raised its overall graduation rate from 51 percent to 57 percent, outpacing its initial goal. As Figure 1 shows, this recent growth is part of a larger trend of rising graduation rates at CSU that began more than a decade ago.
Notably, CSU experienced larger increases in graduation rates toward the end of the initiative, after the new policies and programs-many of which were aimed specifically at freshmen-had time to make an impact on students. Graduation rates grew more (5.2 percentage points) in the final two years of the initiative than at any other time since 2001. It is also worth noting that CSU is already close to its system-wide graduation goals for 2025. CSU is currently only 3 percentage points below its upcoming goal of 60 percent for the six-year graduation rate, and 5 points below its goal of 24 percent for the four-year graduation rate.
Figure 1. Even before the 2015 Graduation Initiative, CSU’s graduation rates were on the rise
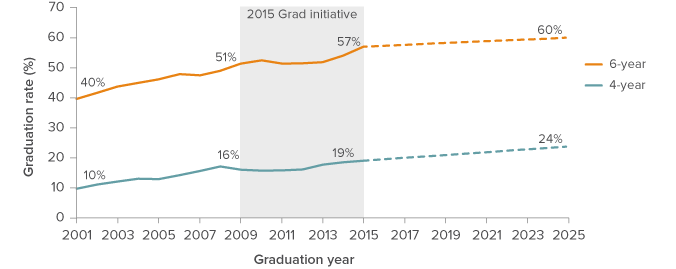
SOURCE: CSU Analytic Studies.
NOTE: Dotted lines represent a hypothetical, smooth increase from 2015 graduation rates to the 2025 goals. The 2025 goals may be subject to change.
The system’s success was driven by increases in graduation rates across nearly all campuses (Figure 2). In fact, most campuses-like the system as a whole’saw graduation rates reach all-time highs with their most recent cohort. Graduation rates also differ a great deal across CSU. In 2015, campus graduation rates ranged from 35 percent to 76 percent.3
Figure 2. Campuses had different starting points, but most increased graduation rates during the initiative
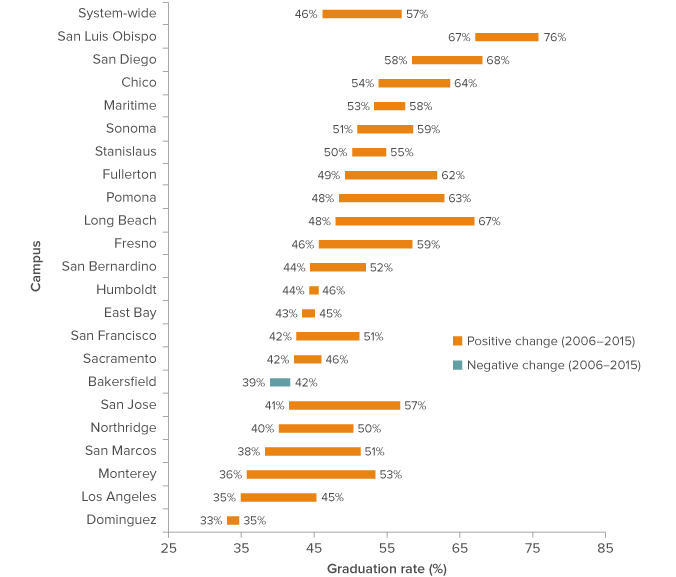
SOURCE: CSU Analytic Studies.
NOTE: Chart shows 2006 baseline graduation rates and 2015 actual graduation rates. Campuses sorted by 2006 baseline graduation rate.
The CSU Chancellor’s Office set a different goal for each campus based on the top quartile of graduation rates among similar universities across the nation. Accordingly, campuses with graduation rates farther from the top quartile in their peer group had bigger goals compared to campuses with graduation rates closer to this top quartile. Campuses already in the top quartile were given a generic goal of increasing their graduation rate by 6 percentage points.
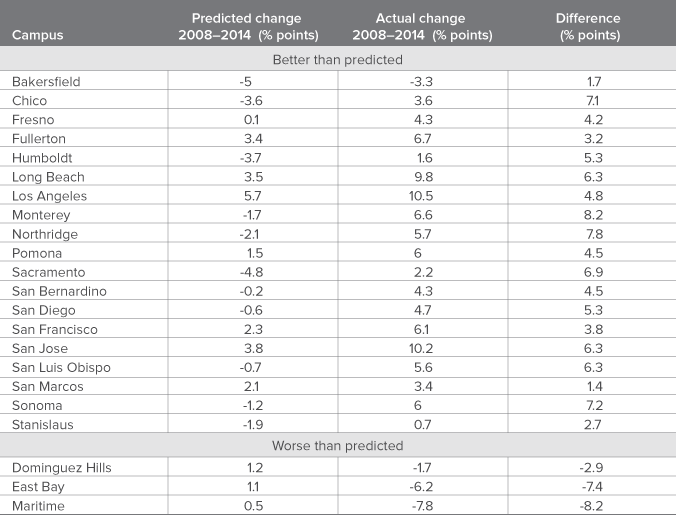
Thus, campus goals for graduation rate growth varied considerably, from 6 percentage points to 18 percentage points (Table 1). Fifteen of the campuses met or exceeded their graduation rate targets by 2015, while seven campuses failed to meet their targets. Long Beach, Monterey, San Jose, and Pomona saw the biggest changes in graduation rates, which increased by 15 to 19 percentage points at these campuses from 2006 to 2015.
Table 1. Most campuses saw graduation gains, but not all met their target
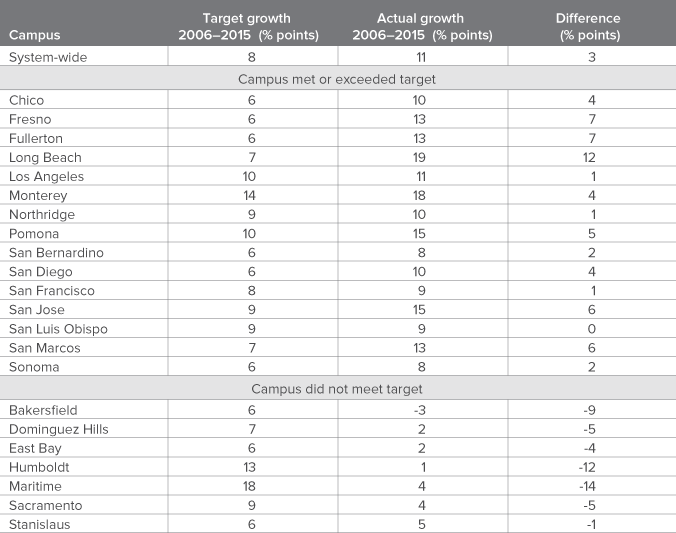
SOURCES: CSU Analytic Studies, CSU Graduation Initiative website.
NOTES: Channel Islands was a new campus as of fall 2003 and did not have a six-year graduation goal, but the campus is included in the system-wide calculations. East Bay, Maritime Academy, and Dominguez Hills had higher graduation rates before the end of the initiative, but none met its campus goal at any point during the initiative.
Despite raising the graduation rates of underrepresented minority students to 50 percent, CSU as a whole was not successful in closing the graduation gaps between racial/ethnic groups. Since 2000, the six-year graduation rate has steadily improved at about the same rate regardless of race or ethnicity, leaving graduation gaps in place (Figure 3). System-wide, the gap between African Americans, Latinos, and American Indians and their white and Asian peers, shrank slightly from 14 percentage points in 2008 to 13 percentage points in 2015. However, some campuses did see a significant narrowing of graduation gaps. Maritime Academy, Fresno, East Bay, San Bernardino, and Chico all reduced their gaps by 5 or more percentage points. Notably, San Bernardino’s graduation gap shrunk from 7 percentage points in 2008 to only 1.5 points by 2015. During the initiative, 14 campuses saw their graduation gaps shrink, while eight campuses saw their gaps grow.4
Figure 3. Graduation gaps remain in place as graduation rates rise for all racial groups
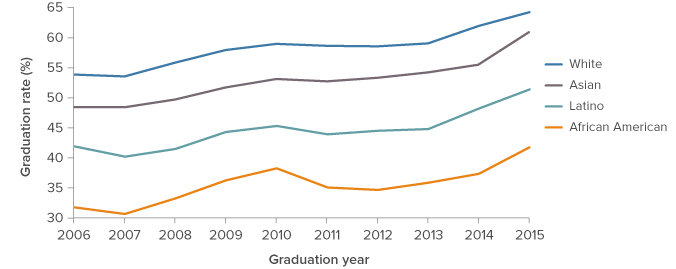
SOURCE: CSU Analytic Studies.
NOTE: System-wide six-year graduation rates. “Asian” includes Pacific Islanders.
Graduation Increases in Context
Compared to similar universities nationwide, most CSU campuses-including those that did not meet their 2015 Graduation Initiative goals-graduate their students at average or above-average rates. However, CSU lags behind similar institutions in four-year graduation rates and has larger graduation gaps between racial/ethnic groups.
Students’ academic preparation is a strong predictor of graduation rates in four-year public colleges and universities across the nation. Universities with students who score higher on the SAT generally have better graduation rates. Figure 4 illustrates this relationship using math SAT scores. In the first graph, which shows six-year graduation, the CSU campuses (orange dots) are mostly on or above the diagonal prediction line, suggesting that CSU campuses have higher six-year graduation rates compared to universities with similarly prepared students.
But on-time graduation rates tell a different story. The second graph in Figure 4, which depicts four-year graduation rates, shows that CSU campuses are mostly on or below the diagonal prediction line, suggesting that CSU campuses have lower four-year graduation rates compared to similar universities. On-time graduation is beneficial to students and the state, as students who move quickly through college pay less tuition, require less financial commitment from the state, and make room for more new students at a faster pace. Three cohorts have had the opportunity to graduate in four years under the programs and policies of the first initiative, but Figure 1 shows that four-year rates only improved 3 percentage points since 2008-compared to 6 percentage points for six-year graduation.
Figure 4. Compared to similar universities, CSU’s six-year graduation rates are generally higher, while four-year rates are lower
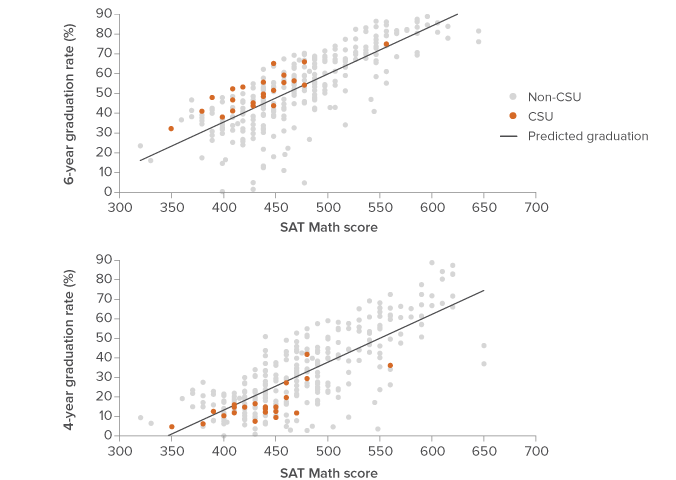
SOURCE: IPEDS.
NOTE: Orange dots represent CSU campuses and gray dots represent similar universities nationwide. Chart shows four- and six-year graduation rates for the fall 2008 entering cohort for all public universities reporting SAT math scores and graduation rates, where over half of students take the SAT. The SAT score represents the 25th percentile SAT score, but results are similar for the 75th percentile. Predicted graduation rate is the ordinary least squares regression line for the SAT score and graduation rate. More complex models that include other student characteristics yield similar results. See Technical Appendix A for more results.
Since student preparation plays a large role in graduation, increases in graduation rates could merely reflect more selective admissions practices or more prepared entering cohorts over time. However, our analysis suggests CSU’s graduation growth was due to additional factors beyond changes in the student body. In many cases, campuses improved graduation rates despite experiencing changes in student characteristics associated with lower graduation rates (Table 2). For example, given changes in its student body, we would expect Sacramento State to have a graduation rate about 5 percentage points lower in 2014 than in 2008. Instead, the campus saw a 2 percentage point increase during that time, beating expectations by about 7 percentage points. Therefore, in Sacramento and most other campuses, the gains in graduation rates were likely not solely a result of changes in student characteristics, suggesting that the policies and programs campuses put in place during the initiative played a role. (See Technical Appendix A for more details on our methods and calculations.)
Table 2. Most campuses increased their graduation rates more than changes in student characteristics predicted
SOURCE: Authors’ calculations from IPEDS.
NOTES: Reported changes in graduation rates are from 2008 to 2014. These differ from the baseline in Table 1, as CSU used 2006 graduation rates to plan the initiative. We use 2008 as it was just prior to the launch of the initiative, and 2014 as it is the most recent nationwide graduation data available. The models include SAT scores, the percentage of students taking the SAT, receiving Pell Grants, receiving any financial aid, who were female, and who were underrepresented minority students. These student characteristics explain up to 69 percent of the variation in graduation rate. See Technical Appendix A for more details on the models used and the results.
As noted above, even though CSU succeeded in increasing graduation rates, the system did not meet its goal of closing graduation gaps. These gaps have proven difficult to close on the national level as well, despite the focus on increasing graduation rates for diverse populations of students (Eberle-Sudre, Welch, and Nichols 2015). However, CSU’s gaps are notably higher than the median African American-white gap (22 percentage points at CSU compared to 12 percentage points nationally) and the median Latino-white gap (13 percentage points at CSU compared to 6 percentage points nationally) at similar universities, leaving room for improvement.5 In addition to improving educational attainment and career opportunities among underrepresented groups, reducing graduation gaps may play an important role in narrowing the state’s projected workforce skills gap.
Campus Strategies to Improve Graduation
While the CSU Chancellor’s Office set the goals of the 2015 Graduation Initiative, individual campuses were free to develop strategies that responded to their students’ specific needs. Students may not complete college for a wide variety of reasons, including inadequate academic preparation, financial issues, lack of engagement with the college, and poor academic performance (Adelman 1999; Adelman 2006; Jackson and Kurlaender 2014; Kuh, Cruce, Shoup, and Kinzie 2008; Scott-Clayton 2011; Tinto 1975). As part of the initiative, campuses generally rolled out numerous, simultaneous policies and programs for all students to address these common barriers to graduation, leaving an unclear picture of the exact causes for improved graduation rates. While some campuses reported evaluating programs, many programs went without a rigorous evaluation. To investigate improvement efforts at the campus level, we collected two sources of data: campus plans and interviews with campus leaders.6 These sources shed light on the objectives each campus hoped to achieve and provide insight into promising strategies for improving graduation rates and closing graduation gaps.
Common approaches: advising and support services
Most CSU campuses focused their efforts on enhancing student engagement and support programs, primarily through improved advising and student services. To this end, campuses developed a set of research-based, high-impact practices and implemented a variety of policies based on these practices.7
High-impact practices
The strategies employed by CSU campuses stem from a growing body of empirical research on the importance of student engagement, support, and inclusion in campus culture. The high-impact practices distilled from this research are widely believed to improve student outcomes, particularly among underrepresented minority and first-generation college students (McCormick, Kinzie, and Gonyea 2013). These practices ensure that the campus takes a proactive role in engaging students. Examples include:
- First-year student seminars and learning communities,
- Summer bridge programs,
- Undergraduate research,
- Internships,
- Peer mentoring, and
- An increased focus on student services like advising and counseling.
Many CSU campuses used these strategies to improve their graduation rates during the 2015 Graduation Initiative. Additionally, in the 2014-15 academic year, eight pilot campuses began efforts to scale up these practices while collecting electronic student records to track their effectiveness.
Campus efforts heavily emphasized advising, as improved communication among students, faculty, and advisors facilitates earlier identification of struggling students and enhances student engagement. Many campuses hired supplemental advisors to assist students in developing multi-year academic plans, allowing students to be more efficient and strategic in their course selection. Advisors also used “intrusive” or proactive advising practices, such as frequent check-ins and reminders of impending deadlines. Additionally, several campuses implemented “e-advising” software that allows students, faculty, and advisors to monitor students’ academic progress in real time and lets students view future course availability to plan ahead in their academic career. Campus leaders spoke highly of their advising strategies and suggested that these new strategies played a role in increasing graduation rates.
Campuses also consolidated student support services in an effort to reduce the administrative and logistical hurdles for students seeking assistance. Campus officials suggested that the establishment of “student success centers”
Underlying CSU’s success was the enhanced cooperation among on-campus groups. To develop, implement, and evaluate research-based practices during the 2015 Graduation Initiative, campuses often appointed an individual in charge of the initiative; created task forces of students, staff, faculty, and campus leadership; and built a system of goals, check-ins, and deadlines. In particular, the task forces regularly brought together key stakeholders from across the campus, improved organizational communication, and helped align overall campus goals with the goals of individual departments within the institution.
Strategies for common problems
While CSU campuses have diverse populations, many share common barriers to graduation. From our interviews, we highlight a selection of promising policy responses that may help overcome three of these barriers.
Student Preparation
Student preparation and the need for remedial education is a problem across CSU. Prior to the original initiative, almost 60 percent of entering CSU students required remediation before they could take college-level courses in English or math. This problem is especially acute at CSU San Bernardino (CSUSB), where more than 75 percent of students required remediation in 2008 (CSU Board of Trustees Survey 2013). Research on graduation rates among underrepresented minority students suggests that focusing on student needs in the first year (especially for those in remediation), closely monitoring students, and targeting aid can help these students graduate (Engle and Theokas 2010).
CSU established a system-wide Early Start program in 2011. This program required students who would need remediation to enroll in a summer course before their freshmen year to prepare for college-level work, in an effort to avoid remediation in the fall. CSUSB administrators created a more intensive program called Coyote First STEP (Student Transition Enhancement Program) that overlaps with Early Start. Students placed in the free Coyote First STEP program live on campus for three to four weeks over the summer, enroll in math and English coursework, receive peer tutoring, and participate in activities and workshops designed to enhance student engagement and social connection with the campus. CSUSB executive staff noted the preliminary results suggest that students who participate in this program often outperform similar students who did not require remediation in their first-year coursework. The program seems especially successful for CSUSB’s underrepresented minority student population, which may have contributed to the campus’s success in significantly shrinking its graduation gap to only 1.5 percentage points.
Bottleneck Courses
Bottleneck courses, required courses in high demand with limited supply, can be a barrier to graduation. A 2012-13 survey of CSU department chairs found that 1,294 courses across the system were determined to be bottleneck courses (CSU San Bernardino Office of Institutional Research 2015). Most commonly, these courses are required general education (GE), lab, or upper-level courses that must be completed in order to finish a specific major.
Long Beach State, a campus that has been especially successful, raising its graduation rate by 19 percentage points since 2006, found that reducing bottleneck courses required three main components: an institutional commitment to fully funding the course schedule, greater collaboration among the departments who make financial decisions and those that determine the course schedule, and an enrollment forecasting system that considers student demand. Long Beach State also eliminated one lab science GE requirement, reducing demand for lab space and giving students more time to take courses in their majors. Although completely eliminating bottleneck courses may prove difficult, Long Beach State officials noted that these changes have coincided with significant reductions in time to degree and student complaints regarding course availability.
Excess Units
Cal Poly San Luis Obispo (Cal Poly) has the highest six-year graduation rate in the system at 76 percent, and fewer than 10 percent of its students require remediation. However, students were accumulating more units than they needed in order to graduate, lengthening their time to degree. This is a common pattern across CSU. On average, students accumulate nearly seven courses more than the minimum number needed to graduate (Legislative Analysts’ Office 2014). At Cal Poly, officials determined this pattern was driven by students who changed majors and those in certain Science, Technology, Engineering, and Math (STEM) majors whose credit requirements exceeded the campus-wide graduation credit requirements.
To address this problem, Cal Poly began requiring that students who wish to switch majors receive approval from advisors in the current and new major, as well as create an academic plan for completing their new course requirements in a timely manner. Cal Poly also standardized lower-level requirements across majors and allowed some general education units to count toward major requirements, easing the burden for students who are in majors with extensive course requirements. Other campuses that have encountered similar problems reported reducing certain course requirements if majors demanded more than the standard number of units for graduation.
Looking Forward
As CSU moves forward with the 2025 Graduation Initiative, the CSU Chancellor’s Office should consider setting more ambitious goals. CSU’s most recent graduating cohort is only 3 percentage points away from the current 2025 goal of 60 percent for the six-year graduation rate. In recent years, it has also become increasingly difficult for the CSU system to accommodate the growing numbers of college-ready students in the state (Johnson 2014).8 Consequently, many CSU campuses are now more selective during admissions, turning away eligible, but less-qualified applicants, and creating cohorts of more prepared students, who will be more likely to graduate. More ambitious targets would take into account the recent successes of CSU campuses and their changing student composition.
The 2015 Graduation Initiative provides additional insights to help campuses shape the administration and evaluation of their efforts. With regard to evaluation, simultaneously implementing multiple policies can make it difficult to tell which programs had the most impact. At a time when the state and universities are looking for efficient and effective practices, universities need to be able to identify successful policies. Despite the CSU system’s improvements in graduation rates and the success many campuses saw in closing graduation gaps, new policies were generally not tested-or not able to be tested-in a rigorous way. Planning for evaluation before the implementation of a new policy is a crucial step in data-driven decision making.9 Piloting programs and randomizing participants are informative and cost-effective ways to determine program effectiveness. There is a trade-off, however, as it takes time to evaluate a program’s impact. The CSU Chancellor’s Office is well positioned to help coordinate piloted policies so that campuses do not duplicate efforts.
The CSU campuses will also have to adopt new strategies to address the persistent graduation gaps between underrepresented students and their peers. CSU San Bernardino succeeded in closing gaps, perhaps due to its focus on boosting students’ academic preparation and social engagement prior to and during their first year-a similar approach might hold promise for other campuses. Such efforts are expensive, however. The state could provide support by funding programs to improve graduation rates through increased subsidies to higher education, which are still well below pre-recession levels. Funds from the state’s Awards for Innovation in Higher Education helped some campuses continue or expand promising work, and the state could consider more such awards.
Finally, campuses will have to employ new strategies to move the needle for on-time graduation rates. On-time degree completion has wide-ranging benefits, but improved very little under the policies of the 2015 Graduation Initiative. Campuses can promote on-time graduation by encouraging students to enroll in a full load of 15 units per term or to take advantage of summer terms. The state can play a role here as well. California legislators may consider targeted grants or financial aid incentives to help motivate and enable students to enroll in a full load of courses or to take summer coursework.
California has a vested interest in ensuring that CSU continues to make progress improving graduation rates, including boosting on-time graduation and closing graduation gaps. By working with the CSU Chancellor’s Office to determine the best ways to fund and scale up successful graduation efforts, the state can help to improve the equity of our higher education system and bring about a much-needed increase in our supply of college-educated workers.
Topics
Completion Higher Education