

Summary
As California schools move into online testing and online learning, an adequate technology infrastructure is no longer an option, but a necessity. To fully benefit from digital learning, schools will require a comprehensive technology infrastructure that can support a range of administrative and instructional tools. An earlier PPIC report found that most schools need significant technology upgrades in order to accommodate online learning. What upgrades do schools need most, and how much will they cost? How can policymakers help ensure that all students have access to 21st-century learning tools?
This report describes findings based on new statewide data. First, schools need high-density wireless networks, increased bandwidth, and overall network infrastructure upgrades. The challenges are greater in large schools, mostly because of the high cost of wireless networks for large groups of users. Second, IT staffing continues to be an issue in most schools. Only a third of schools have staff onsite to support desktop and local network configuration.
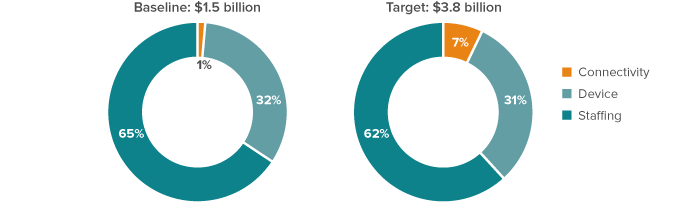
To estimate the costs of upgrading technology infrastructure, we created two scenarios. Our baseline scenario-which includes minimum bandwidth for digital learning, one device for every two middle- and high-school students, and one IT staffer for every 300 computing devices-would cost an additional $1.5 billion over the next three years. Our target scenario-which involves additional bandwidth and one device to every middle- and high-school student-would cost significantly more: $3.8 billion. In either scenario, staffing costs are more than 60 percent of the total.
As the state explores ways to address these ongoing technology needs, we offer several recommendations. First, continue and maintain sustained funding for technology investment, particularly for staffing. Second, provide targeted technical assistance to address severe staffing problems. Third, to ensure that all students have full access to digital learning, take advantage of federal funding and explore innovative partnerships with private sector to cover the cost of home broadband access for students from lower-income families.
Many California Schools Need Upgrades
Technology has become an invaluable tool in today’s schools. Teachers are increasingly using online learning resources, video lectures to deliver instruction and perform administrative tasks, and digital tools that facilitate blended learning (US Department of Education 2011; Horn and Staker 2011; Johnson, Becker, Estrada, and Freeman 2015; National Center for Education Statistics 2009).1 More students than ever are taking online courses (US Department of Education 2011; Watson et al. 2014). Schools have turned to web- and mobile-based services to communicate with staff, parents, and communities (Baldassare et al. 2009; Gilgore 2015). And, most recently, the state has replaced paper-and-pencil standardized tests with online assessments (California Department of Education 2013).
As technology continues to transform the way teachers teach and students learn, a large number of schools will need to upgrade-and in some cases, overhaul-their technology infrastructure. The federal government has an ambitious goal of connecting 99 percent of America’s students to high-speed broadband and wireless in their schools by 2018; at the state level, more than $2 billion has been allocated to support technology infrastructure improvement in schools (US Department of Education 2013; California Department of Education 2013, 2014, 2015).2 In spite of these investments, a large number of schools need significant infrastructure upgrades (Gao 2015). What kind of infrastructure challenges do schools face? Are these challenges shared equally? How much will it cost to bring all schools to a level that is adequate for digital learning? And what can policymakers do to make sure all students can benefit from 21st-century learning tools-both at school and at home?
In this report, we use the 2015 Statewide Connectivity Survey to tackle these important questions. The survey was administered by the California Department of Education (CDE) and K-12 High Speed Network (HSN) during the 2014-15 school year to assess the readiness of public schools to administer online tests. It included detailed questions on school technology infrastructure, from connectivity (current and planned), technology staffing, and computing devices to technology-related funding.3 The richness of this survey, coupled with school enrollment, demographic, and performance data, allows us to pinpoint problem areas. We begin by examining school technology needs and then estimate the cost of making upgrades; we conclude by offering policy recommendations to improve school technology infrastructure.
Key Technology Upgrades
Network Needs
The shift to online testing and learning is putting a lot of pressure on schools’ technology infrastructure. The State Educational Technology Directors Association (SETDA) has recommended a minimum connection speed of 100 kbps per student. It has proposed a target speed of 1,000 kbps per student. The White House has a similar goal in its ConnectED initiative (ConnectEd 2013; SETDA 2012).
More than 90 percent of schools report that they need to make significant technological upgrades in the next three years; only 10 percent of schools do not expect to face any challenges at all (Figure 1).4 Statewide, 27 percent of schools cited a high-density wireless network-which can connect a large concentration of students and classrooms wirelessly-as the most challenging upgrade. Twent-six percent of schools expressed concerns about bandwidth-both wired and wireless connectivity (e.g., Ethernet, wireless network). Another 18 percent face significant upgrades to their overall network infrastructure-from hardware (including routers, switchers, cables) to software (including firewall and network security). About 14 percent of schools reported a need for devices, perhaps due to the efforts to achieve a 1:1 student to device ratio (Figure 1). The standard student-device ratio has been less clear than the standard for bandwidth, but more and more schools have begun providing every student within some grade span (usually middle and high school) with a computing device for classwork and homework. A 1:1 student-to-device ratio requires a lot more than just adding devices. It also requires appropriate additional maintenance and monitoring, which creates added demand for IT staffing. In short, the effort to move schools toward a digital learning environment presents a wide range of challenges.
Figure 1. Key challenges in upgrading network infrastructure
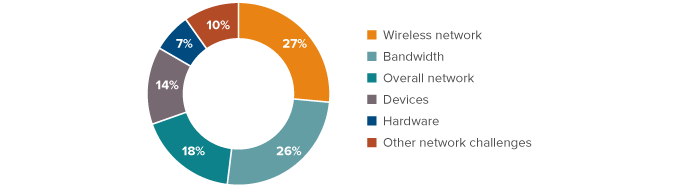
SOURCE: Statewide connectivity survey, California Department of Education/K-12 High Speed Network, 2015.
NOTES: Other network challenges include software (e.g., firewall, security), facility, and challenges that are unique to rural schools (e.g., remote location, no commercial service, power outrages). Results are based on 350 valid responses to the open-ended question “Over the next three years, what will be the biggest challenge to network connectivity at this school site?”
Network Needs Vary across Schools
Factors such as school size, student demographics, and educational needs (e.g., those of English Learners) contribute to variations in network challenges (Table 1). For instance, 33 percent of large schools (with student populations above the statewide average of 627) face significant high-density wireless network challenges, compared to 27 percent of all schools. High-poverty and high-minority schools do not seem to face greater challenges than other kinds of schools. The concerns of rural schools and their urban counterparts are similar, even though more rural schools lack sufficient bandwidth for digital learning (Gao 2015). While there is not much difference in network needs across types of schools, students attending high-minority, high-poverty, and rural schools often lack home Internet connections (Horrigan 2015).
Table 1. Large schools are especially concerned about wireless networks and devices
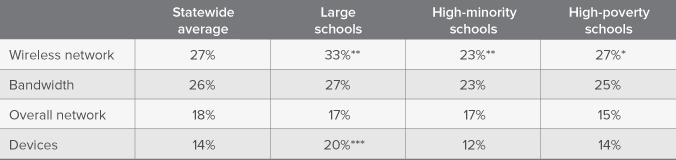
SOURCES: Network challenge: Statewide connectivity survey, California Department of Education/K-12 HSN, 2014-15; School enrollment, demographics, and FRPM: California Department of Education, 2013-14.
NOTES: About 42 percent of schools statewide have student populations above the state average (627) and so are defined as large. We apply the National Center for Education Statistics (NCES) definition of high-minority schools as those with student populations that are more than 75 percent African American or Hispanic; similarly, in high-poverty schools, more than 75 percent of students are eligible for free or reduced-price lunch. Statewide, 48 percent of schools are high minority and 46 percent are high poverty. Not surprisingly, 80 percent of high-poverty schools are also high-minority schools and the pairwise correlation is 0.6. There is no significant variation in network challenges across school locations (e.g., urban vs. rural). These results hold when we look at this in a regression framework (see Technical Appendix B).
*** p-0.01, ** p-0.05, * p-0.1
Staffing
An earlier PPIC report found that most schools experienced staffing difficulties during the 2014 Smarter Balanced Field Test, which was administered to help schools transition to the new online assessment system (Gao 2015). As schools prepare for digital learning, these challenges are growing.
The optimal number of devices (or end users) per technician depends on factors such as the complexity of the computing environment (e.g., the configuration of operating systems; types of computing devices; bring-your-own-device policy; and number of remote users), staff expertise, and the type of work performed. There have been a few attempts to estimate the optimal ratio. One of the more widely cited investigations recommends a range of 1 full-time IT technician for each 80-110 devices, which, after consultation with schools and districts, were deemed too high for most educational settings given schools’ computing needs. Our report uses 1:300 as our baseline target, which is below the optimal ratio in most industries (1:200) (Robert Half Technology 2008). This is a baseline ratio that does not factor into the proliferation of mobile devices and wireless networks or the adoption of BYOD policies in recent years.5
The median number of IT technicians per school is 0.4 (FTE) for 228 devices (such as desktops, laptops, netbooks, iPads, and Chromebooks), and statewide six in ten schools statewide are well below 1:300. Eight in ten schools (82%) rely on district technicians for issues related to devices-this may not be surprising, given that districts often provide devices and connectivity; only one in three schools has onsite staff to support local network configuration, which is especially problematic given that 27 percent of schools will need significant high-density wireless network upgrades in the next three years (Figure 2). As more schools adopt 1:1 computing and bring-your-own-device policies to facilitate digital learning, staffing needs will increase.6
Figure 2. IT staffing continues to be a big challenge in most schools
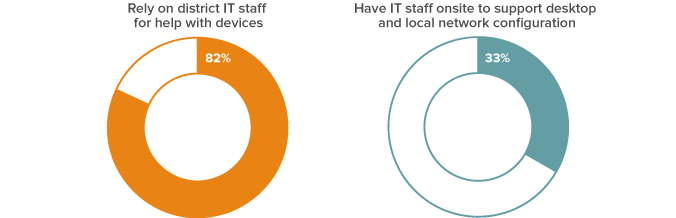
SOURCE: Statewide connectivity survey, California Department of Education/K-12 HSN, 2014-15.
NOTE: No significant difference by school types (e.g., high minority or high poverty) and the same conclusion holds in a regression framework.
The Cost of Upgrades
The significant need for network infrastructure and IT staffing upgrades raises a big question: How much will it cost to meet these needs? In this section, we estimate the additional costs (relative to what districts currently spend) associated with upgrading technology infrastructure for different scenarios. To estimate these costs, we developed a baseline and a target scenario. The baseline scenario is designed to reflect minimum expectations for bringing digital learning into classrooms. The target scenario aims for a level of functionality deemed necessary for tools such as digital textbook, video conferencing, and virtual field trips.
Since schools face a variety of challenges (e.g., some need to upgrade network connectivity but have manageable student/computing device ratios), we break down the costs for network connectivity, computing devices, and IT staffing (Figure 3, Table 2). Staff training, which includes professional development for teachers and IT staff, can also be a significant cost driver, especially as demand increases.7 Unfortunately, it is difficult to determine where California schools stand on investment in training.8 It is even more difficult to identify a training standard that can be quantified and priced. As a consequence, we could not incorporate training costs into our scenarios, and in excluding these costs we are almost certainly underestimating the additional investment needed.9
How much IT infrastructure is enough?
To estimate the costs associated with upgrading connectivity, computing devices, and IT support for devices, we developed two scenarios: a baseline scenario, which aligns with minimum expectations for bringing digital learning into classrooms; and a target scenario, which involves a level of functionality necessary for tools such as digital textbooks, video conferencing, and virtual field trips.
Connectivity
Computing devices
IT staffing (for devices only-connectivity may also require additional staff)
Our baseline scenario involves the cost of upgrades that would bring all schools up to minimum recommended standards-bandwidth at the minimum recommended speed, one device to every two middle- and high-school students, and IT staffing at 1:300. For our target scenario, we estimate the cost of upgrading infrastructure to include additional bandwidth and one device for each middle- and high-school student at the same level of IT support (i.e., 1:300).10 Because these scenarios include estimates for upgrading to and maintaining a technological level, there is some year-to-year variation in estimated costs. For this reason, we break down the costs by year.
Federal and State Programs Reduce Connectivity Costs
As a share of the total, upgrading connectivity is the least costly, after taking into account the discounts provided by federal programs such as the Universal Service Program for Schools and Libraries, commonly known as the E-Rate program (Figure 3, Table 2). E-Rate provides discounts of up to 90 percent to schools and libraries for Internet and telecommunication services.11 Our baseline scenario involves bringing all schools up to a bandwidth of 100 kbps per student; the target scenario bandwidth is 1,000 kbps per student. To date, 1,884 schools (18%) are below the baseline standard and 6,227 (60%) are below the 1,000 kbps per student standard. On average, it costs nearly $20 per student to upgrade these schools; most of the spending is for one-time set-up costs in the first year. The net cost increases more than tenfold if the goal is to connect all schools at 1,000 kbps per student.
Table 2. Three-year estimates show that connectivity costs are greatest in the first year, and staffing is the biggest expense
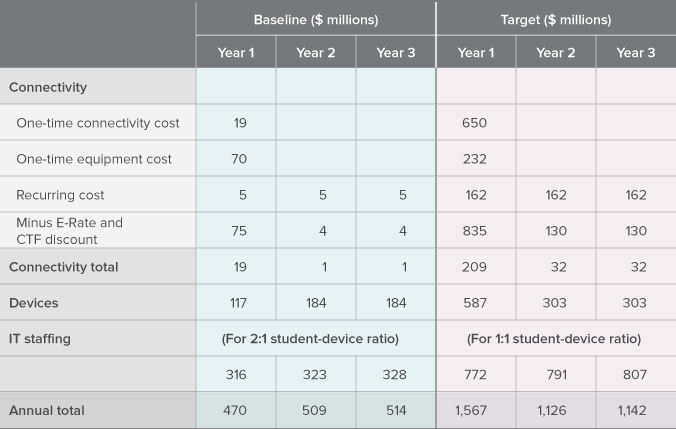
NOTES: 100 kbps per student is the minimum requirement set by the ConnectED initiative and the State Educational Technology Directors Association (SETDA), and 1,000 kbps is the target. Connectivity costs include one-time costs plus annual recurring costs (e.g., maintenance), taken from the K-12 HSN’s broadband cost estimator. The federal E-Rate discount is based on eligibility for school lunch programs and rural/urban location; the average discount is 80 percent. The connectivity cost in our baseline scenario is for bringing 1,884 (out of 10,393) schools up to 100 kbps per student. The connectivity cost in our target scenario is for bringing about 60 percent of schools up to 1,000 kbps per student. We assume a four-year cycle for devices, which is the industry standard. In Year 1, we assume that schools above 2:1 computing ratio purchase new devices to meet the 2:1 ratio and starting in Year 2, about a quarter of devices are being replaced each year. For simplicity we do not replace existing devices in year 1, which may drive the cost up. According to CDE/K-12 HSN connectivity survey, median student-device ratio is 2:1 for middle and high schools and 3:1 for elementary schools. Unit cost per device varies depending on the types of purchase and the number displayed is a weighted average. According to CDE/SBAC’s Technology Readiness Survey Tool, the device breakdown is 54% desktop ($400 or above), 15% laptops ($300 or above), 5% notebooks ($200 or above), 3% tablets ($259 or above for iPads, $339 on average for Chromebook). The shares do not add up to 100 due to missing responses. Districts on average dedicate 0.4 FTE technician per each school site, serving 228 computing devices. Student enrollment is projected by the Department of Finance. Average salary for IT support technician is based on the median 2014 salary for computer support specialists in California (from the Bureau of Labor Statistics). Staffing costs do not include training for IT staff or professional training for teachers. All costs are 2015 dollars.
Devices Are a Significant Cost Driver
We estimate the cost of a 2:1 ratio of students to devices in our baseline scenario and a 1:1 ratio in our target scenario. Both scenarios are focused on middle- and high-school students, and both assume a four-year cycle for computing devices, per the industry standard. Statewide, only 45 percent of middle and high schools meet the 2:1 student device ratio. Bringing all schools to a ratio of one device for every two students would cost an additional $485 million over three years.
Ensuring that every middle- and high-school student has a device-an important step toward giving students whose families may not be able to afford devices and/or Internet service full access to digital learning-would require a three-year investment totaling more than $1.2 billion. The cost is higher in the first year because additional new devices are purchased to bring all middle and high schools to the 1:1 threshold. In both scenarios, we assume that one-quarter of the devices will be replaced in each subsequent year, a significant recurring cost.
Staffing Is the Costliest Upgrade
Providing and maintaining an adequate level of IT support is the major recurring technological cost (Figure 3). In our baseline scenario, the IT staff-device ratio increases by roughly half (1:300), which is still below the industry median (1:200). We use the same IT staff-device ratio (1:300) in our target scenario, but that scenario’s 1:1 student-device ratio requires additional IT staffing.12
Adequate staffing for a 2:1 student-device ratio would require $316 million in additional funds each year ($51 per pupil served). IT support for a 1:1 student-device ratio at all middle and high schools would cost about $772 million per year in addition to what is currently spent on IT support ($125 per pupil served). Additional staffing represents 65 percent of the upgrade costs in the baseline scenario and 62 percent of the total additional costs in the target scenario. Covering these additional costs, which clearly go beyond the reach of current spending on education technology, will require continuous, long-term funding.
Figure 3. Staffing is the costliest IT upgrade
SOURCE: Author’s calculations.
NOTE: Three-year totals. Please refer to Table 2 for a by-year breakdown.
Policy Implications
The vision of digital learning cannot be achieved without an adequate technology infrastructure, both in schools and at home. In the next three years, 90 percent of California schools expect significant challenges in their network upgrades. In addition, the state needs to ensure that students attending high-minority or high-poverty schools do not get left behind. As state and local policymakers consider ways to address these challenges, we offer the following recommendations.
First, California should continue and sustain the Broadband Infrastructure Improvement Grant (BIIG) to upgrade network capacities in schools, particularly in large and rural schools. Our analysis has shown a significant gap between what has been spent and what is still needed. Making sure that all schools have the minimum technology infrastructure will require an additional $1.5 billion over the next three years. In addition, these challenges are not evenly distributed: large schools are more likely to face significant network challenges and rural schools are behind, mostly due to aging or lack of infrastructures (K-12 HSN 2015). Upgrading these schools for digital learning will require a long-term commitment from the state. Fortunately, state investments could bring in additional funds from the federal government: starting in 2016, the FCC will match up to 10 percent of the funds supplied by the state for connectivity costs.
Second, the state and district need to recognize that upgrading tech infrastructure is not just a “year one” cost. One-time money is helpful for procurement, but districts will need funding-and flexibility-to cover annual expenditures for more IT support. Districts will also need to replace most devices every four years (or less)—new hardware quickly becomes obsolete or inoperable.
Third, the state should provide targeted technical assistance and professional training to school technicians. The state, and to a lesser degree, county offices of education, can play a role in providing training and information to the IT professionals assigned to schools.
Fourth, new programs will be needed to bridge the gaps in technology access at home, particularly in high-minority and high-poverty schools. More than a third of students in these schools lack Internet access or devices at home, making digital learning impossible outside the classroom. The state could leverage its purchasing power to explore innovative public-private partnership programs that bring devices and connectivity to these places. One option is to take advantage of the public library network to provide free devices and Internet access to students attending disadvantaged schools. This is an economical approach, because public libraries are eligible for the federal E-rate program. Another option is to leverage the state’s purchasing power and partner with Internet service providers and wireless carriers to provide low-cost data plans to low-income families. For example, two California cities-Fresno and Los Angeles-were selected to participate in a recently launched federal program called ConnectHome, which works with service providers to bring broadband access to 275,000 low-income households across the country. It will be important to track state and local progress in this area.
Realizing the potential of digital learning will require ongoing investments in infrastructure, hardware, and staffing. Funding and resources must be thoughtfully and equitably distributed so that all of California’s students-and the state as a whole-can benefit.
Topics
K–12 Education