- Latinos, Asian Americans, and African Americans are less likely to vote than whites.
Our surveys over the past year indicate that, among adult citizens, 47% of Latinos, 54% of Asian Americans, and 54% of African Americans are likely to vote, compared to 65% of non-Hispanic whites. The state’s likely voters are disproportionately white: according to US Census estimates, whites make up 41% of the state’s adult population, but our surveys find that they comprise 55% of the state’s likely voters. Latinos—California’s largest racial/ethnic group—represent 35% of the adult population, but they account for only 21% of those most likely to vote. Asian Americans comprise 15% of the adult population and 14% of likely voters. The share of African American likely voters matches their representation in the adult population (6%). - Most African American, Latino, and Asian American likely voters are Democrats.
An overwhelming majority of African American likely voters (73%) and a majority of Latino (58%) and Asian American (54%) likely voters are registered as Democrats; far fewer are registered as Republicans (5% African Americans, 16% Latinos, 19% Asian Americans). Party registration among white likely voters is more evenly divided, with 40% registered as Democrats, 34% as Republicans, and 21% as independents (previously called “decline to state” and now called “no party preference” voters). - Latino and white likely voters are more ideologically divided.
Thirty-seven percent of Latino likely voters identify themselves as politically liberal, while 32% identify as middle-of-the-road and 31% identify as conservative. White likely voters are as likely to identify as liberal (37%) as they are to identify as conservative (37%); 26% call themselves middle-of-the-road. African American and Asian American likely voters are much more likely to be ideologically liberal (38% and 43%, respectively) than conservative (22% and 24%). - Latino and Asian American likely voters tend to be young; income and education levels vary.
Latino (72%) and Asian American (71%) likely voters are more likely than African American (47%) and white (43%) likely voters to be younger than 55. Indeed, about four in ten Asian American (36%) and Latino (38%) likely voters are younger than 35, compared to only 11% of African Americans and 14% of whites. One in four Latino likely voters (25%) and about one in three African American likely voters (35%) are college graduates, compared to 44% of white and 64% of Asian American likely voters. Pluralities of Latino and African American likely voters (38% and 37%) have household incomes of less than $40,000, while about one in three earn $80,000 or more (32% Latinos, 34% African Americans). In contrast, about half or more of Asian American and white likely voters (60% and 50%) earn $80,000 or more. - Most likely voters are US born, but half of Asian American likely voters are immigrants.
Nearly all African American (96%) and white (94%) likely voters are native-born US citizens, compared to 70% of Latino likely voters; Asian American likely voters are equally as likely to be naturalized as native-born citizens (50% to 50%). In 2020 surveys, strong majorities of African American (91%), Asian American (75%), and Latino (72%) likely voters have disapproved of the way President Trump is handling his job, as have majorities of white likely voters (56%). Overwhelming majorities of African American (87%), white (84%), Asian American (75%), and Latino (72%) likely voters think they can trust the federal government in Washington to do what is right only some of the time or none of the time.
Race and voting in California
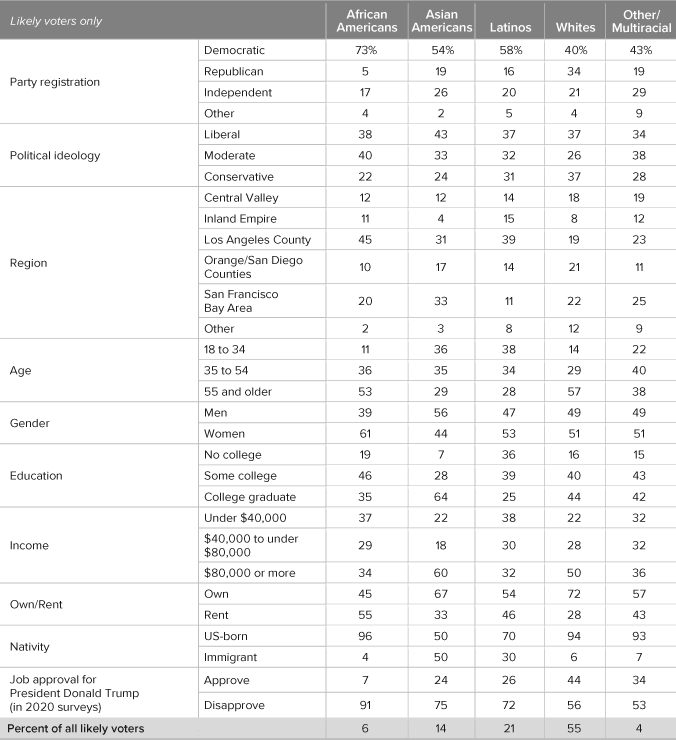
NOTES: “Likely voters” are registered voters meeting criteria on interest in politics, attention to issues, voting behavior, and intention to vote. For a full description of these criteria and regional definitions, visit www.ppic.org/wp-content/uploads/SurveyMethodology.pdf. For race and ethnicity, results are presented for Latinos, non-Hispanic whites, non-Hispanic Asian Americans, non-Hispanic African Americans, and non-Hispanic “other race” and multiracial adults.
Sources: Seven PPIC Statewide Surveys from September 2019 to July 2020, including 7,243 likely voters. 2014–2018 American Community Survey 5-year estimates, US Census Bureau.
Topics
Political Landscape Population Statewide Survey