

- Independent voters are now the second-largest voting bloc in California.
As of the June 2018 primary, the share of California voters registered as independents, also known as “decline to state” or “no party preference” voters, was 25.5%—surpassing the number of registered Republicans in the state for the first time. The share of registered independents has increased more than twofold since the November 1994 gubernatorial election (10.3%). Over the same period, the percentage of voters affiliated with each major party has fallen: Republicans from 37.2% to 25.1%, and Democrats from 49% to 44.4%. Since May 2014, the share of independents has increased by 4 points (from 21.2% to 25.5%). The share of Democrats has also risen (43.4% to 44.4%), while the share of Republicans has fallen 3 points (28.4% to 25.1%). The total number of registered voters has increased, from 17.72 million in May 2014 to 19.02 million in May 2018, and so has the number of independents (from 3.75 million to 4.85 million).
Party registration in gubernatorial election years
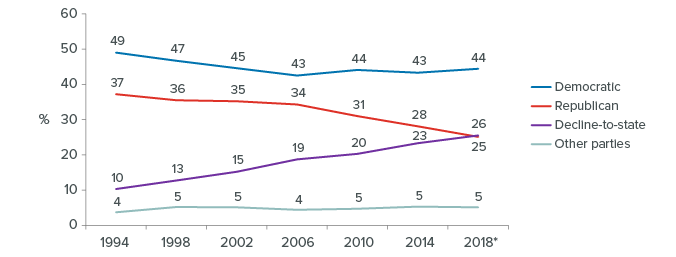
SOURCE: California Secretary of State, Report of Registration, October 2010, October 2014, and May 2018.
NOTE: Numbers may not add to 100% due to rounding. *Prior to June primary. For all other years, numbers are prior to November general election.
- A plurality of independents lean toward the Democratic Party.
Our surveys over the past year indicate that more independents who are likely to vote lean toward the Democratic than toward the Republican Party (43% to 29%), while 28% lean toward neither party. In 2010 and 2014, similar shares of independents leaned Democratic (38% in 2010, 42% in 2014), Republican (30% in 2010, 30% in 2014), and toward neither major party (32% in 2010, 28% in 2014). Four in ten independent likely voters view themselves as ideologically middle-of-the-road (40%), while three in ten self-identify as either liberal (32%) or conservative (29%).
Leanings toward major parties
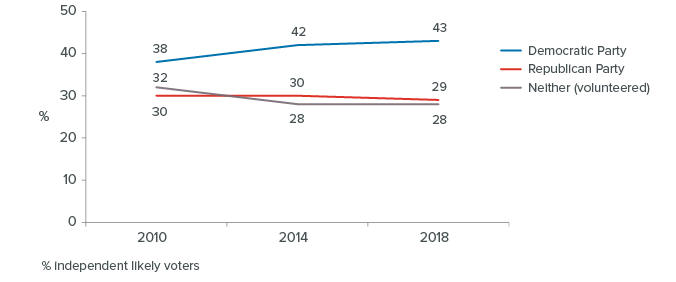
SOURCES: Eight PPIC Statewide Surveys from September 2017 to July 2018, 3,088 independents, of whom 1,988 are likely voters.
Political ideology
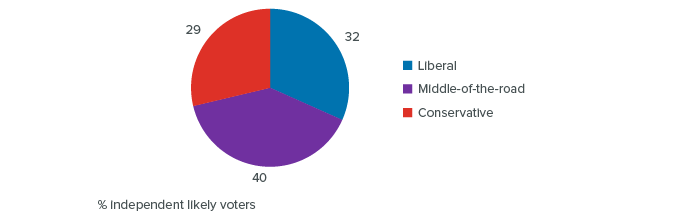
SOURCES: Eight PPIC Statewide Surveys from September 2017 to July 2018, 3,088 independents, of whom 1,988 are likely voters.
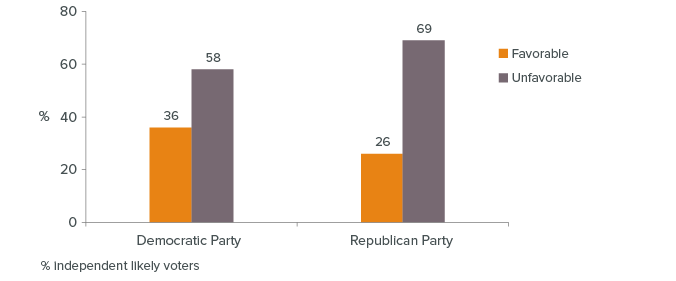
- Most independents say neither party does an adequate job.
Most independent likely voters have unfavorable views of both the Democratic Party (58%) and the Republican Party (69%). When asked if the major parties do an adequate job representing the American people, or if they do such a poor job that a third major party is needed, independent likely voters (71%) are more likely than partisans (64% Republicans, 59% Democrats) to say a third party is needed.
- Independents are an ideologically diverse group …
The views of independent voters who lean toward one of the major parties are often similar to that party’s positions. But on many issues that divide partisans, independents as a group are divided. For example, while partisans have mirror-opposite views on the 2010 health reform law (Democrats 74% favorable, Republicans 73% unfavorable), independent likely voters are closely divided (53% favorable, 41% unfavorable). A similar pattern holds regarding willingness to pay more for electricity if it were generated by renewable sources in order to help reduce global warming: 67% of Democrats say they are willing, while 78% of Republicans say they are not willing; among independents, 49% say they are willing and 48% say they are not willing. - … but on some issues, strong majorities align with Democrats.
On many issues that divide voters along party lines, independent likely voters agree with Democrats. For example, 88% of Democrats and 71% of independents say immigrants are a benefit to California, while a majority of Republicans (55%) say immigrants are a burden. On the issue of global warming, 83% of Democrats and 67% of independents are in favor of the state law that requires California to reduce its greenhouse gas emissions to 1990 levels by 2030, while 61% of Republicans are opposed. - Independents tend to support Democratic gubernatorial candidates.
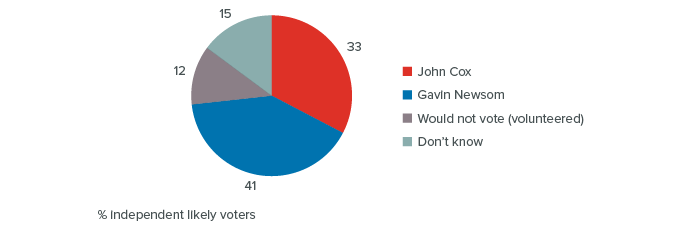
Leading up to the 2018 election, a majority of independents were satisfied with their choices of gubernatorial candidates (May 2018: 55% satisfied, 36% not satisfied). In our July survey, independents prefer Gavin Newsom, the Democrat, to John Cox, the Republican (41% to 33%).
Sources: California Secretary of State, Report of Registration, October 2010, October 2014, and May 2018. Eight PPIC Statewide Surveys from September 2017 to July 2018, 3,088 independents, of whom 1,998 are likely voters. For more information on the demographic differences between independents and other voters, see “California Voter and Party Profiles.”
Topics
Political Landscape Statewide SurveyLearn More
Discontent with Major Political Parties Continues to Simmer
California Voter and Party Profiles
California’s Likely Voters
Has California’s Independent Registration Boom Ended?
Race and Voting in California

California’s Political Geography 2020

Millennial Voters and California Politics
