
This post is excerpted from my opening remarks at PPIC’s annual Sutton Family Speaker Series event, “2020 Election Preview“ earlier today, in Sacramento.
All eyes will be on California when voters make their choices in the upcoming presidential primary on March 3. Last year, California experienced a surge in voter registration and voting. On the heels of record low turnout in 2014, the 2018 election had the highest turnout for a midterm in California since 1982. Still, PPIC colleagues report that turnout is low compared to other states.
To help make sense of the state’s voting patterns, PPIC has just released a new report titled California’s Exclusive Electorate: A New Look at Who Votes and Why It Matters, which analyzes data from the last nine waves of PPIC Statewide Surveys and includes responses from nearly 15,200 California adults. These latest findings, built on a PPIC study that was first published in 2006 and then updated in 2016, help us to set the context for this 2020 election preview event. While much is changing in the electorate, many patterns stubbornly persist.
Growth in political participation has been strong in the wake of significant changes in our state’s election laws and because we live in such interesting times for national politics. However, it is noteworthy that about 5 million California adults are not eligible to vote, while about 5 million eligible adults are not registered and about 7 million registered voters did not cast a ballot in November 2018. If past trends are any indication, only about half of California’s approximately 31 million adults will vote in the November 2020 general election, and far fewer will cast ballots in the March 2020 primary.
Importantly, the demographic makeup of the electorate is not representative of the people of California. Voters in California tend to be white, affluent, college educated, and homeowners. Nonvoters are more likely to be younger, Latino, renters, lower income, less educated, and to self-identify as the “have nots” in society. While some gaps have narrowed, a wide gulf remains between voters and nonvoters.
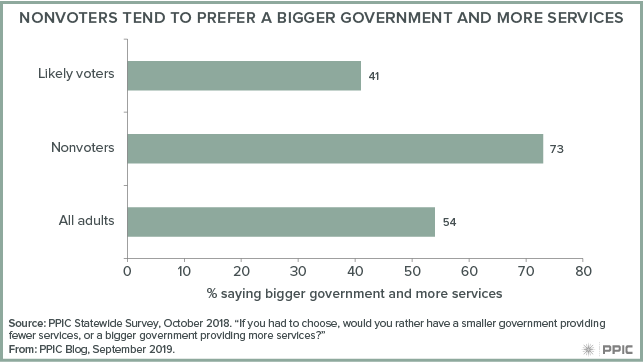
Because of their stark differences, voters and nonvoters are not aligned in their views of the role of government. For instance, only 41 percent of likely voters prefer a bigger government that provides more services, while 73 percent of nonvoters and 54 percent of all adults do so. Preferences vary in similar ways when asked if the government should be doing more to reduce the gap between the rich and the poor, or if the government should do more to make sure that all people have an equal opportunity to get ahead.
What would change if more nonvoters turn out for the March primary and November election? Presidential candidates who favor a more expansive government role would get a boost, and so would proponents of state bond measures and citizens’ initiatives to raise taxes on the wealthy. President Trump’s approval rating here is much lower among nonvoters than likely voters (24% to 38%) and, thus, a higher turnout would also help the Democratic candidates in competitive US House races—as it did in 2018.
Expanding the electorate might also inject some idealism into the cynicism and divisiveness of politics today. Nonvoters are more optimistic about the prospect that Americans of different political views can still come together and work out their differences. California still has a long way to go, but the movement toward a more representative electorate that we are starting to see is a step in the right direction for a state that calls on voters to make decisions that impact all of its residents.
In the meantime, PPIC Statewide Surveys will continue to poll all adults so that elected officials can take into account the needs and wants of all of the people they were elected to represent, and not only the likely voters, in a consequential 2020 election year.