
With the release of California’s official Statement of the Vote, the state’s final tally is in for the November 2018 election. This midterm election will mostly be remembered for California’s role in changing party control of Congress. But several other statewide results also stand out:
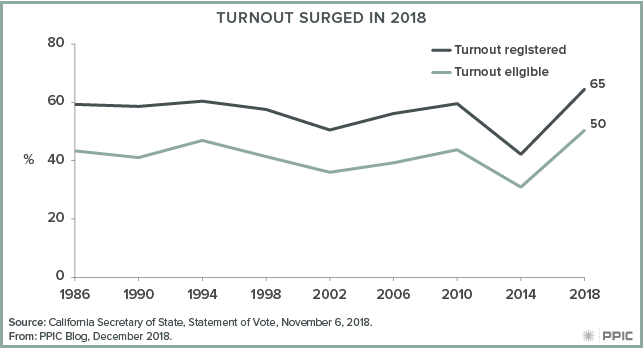
- High turnout. A record-setting 19,696,371 Californians—78% of eligible adults—were registered to vote by the deadline for the general election. An increase of 1,892,548 registered voters since the 2014 general election represents the biggest surge in voter registration between midterm elections in the past 20 years, according to California’s Secretary of State. The 12,712,542 voters who cast ballots is an all-time high for a midterm and, at 65% of registered voters and 50% of eligible adults, this is the highest midterm turnout in the past 30 years. These increases follow record low turnout in 2014. Many factors were at work in heightening political engagement this fall, including intense media interest in California congressional races that carried over from the June primary; voter participation that was stoked by disapproval of President Trump and dislike of his immigration, environment, and tax policies; and new state laws that are being implemented to make it easier for Californians to register to vote and cast ballots.
- Blue wave. Democratic candidates won every statewide race and gained enough state legislative seats to have well over a two-thirds majority in the state assembly (60 Democrats, 20 Republicans) and state senate (29 Democrats, 11 Republicans). Democrats also increased their grip on the California congressional delegation (46 Democrats, 7 Republicans). What accounts for this one-party dominance? Midterm elections are often described as a referendum on the president, and President Trump’s approval rating was at 39 percent in the October PPIC survey. PPIC surveys also found an “enthusiasm gap” in voting for congressional candidates, which further skewed the partisan turnout in favor of Democrats. But the difficulties facing Republican candidates go beyond this fall’s political headwinds. The November ballot did not even include Republican candidates for US senator, lieutenant governor, or insurance commissioner—no Republicans made it past the top-two June primary for these offices. The Republicans have not won a statewide race since 2006 and, in this time, their share of the electorate has declined by 10 points (34% to 24%) while their ranks have also diminished (5.4 million to 4.7 million), according to the Secretary of State.
- Diverse officeholders. Gavin Newsom was elected governor in the only statewide race featuring two white men. California’s other statewide winners were four women, three Latinos, two Asian Americans, one African American, and one openly gay man. Notably, women candidates won all their races while all those who lost—five Republican candidates, the sole No Party Preference candidate, and a nonpartisan candidate—were white men. However, regional diversity was missing, with six successful candidates from the San Francisco Bay Area and three from the Los Angeles region. There were none representing the populous regions of the Central Valley, the Inland Empire, and the South Coast (Orange/San Diego)—or the more sparsely settled central coast and far north.
- Words matter. Propositions 1 and 2, placed on the November ballot by the legislature, passed—consistent with the historically high pass rate for legislative ballot measures. However, just three of the eight citizens’ initiatives passed, consistent with the historically low pass rate for these types of initiatives. Among the most notable failures were the Proposition 6 gas tax repeal and the Proposition 10 rent control measure. The September PPIC Survey found that about half of likely voters favored the general idea of both the gas tax repeal (50%) and rent control (52%), but only four in ten said they would vote yes when they were read the ballot titles and labels. The defeat of Proposition 6 (56.8% no) and Proposition 10 (59.4% no) once again demonstrates that the devil is in the details when it comes to voter support for citizens’ initiatives on the ballot.
It’s no coincidence—given what PPIC studies say about the profiles of likely voters and nonvoters—that rising political participation in California means that the Democratic Party is becoming more dominant and that statewide officeholders are more likely to reflect the state’s diversity. And it is important to note that Californians continue to be highly selective about making public policy at the ballot box as more and more voters engage with the citizens’ initiative process. Still, millions of Californians are not registered to vote and don’t cast ballots. These residents tend to identify as “have nots” and are often most in need of government services. For this reason, the PPIC Statewide Survey will continue to provide a voice—for all adults in addition to likely voters—on state and national issues. Tracking policy preferences across the broadest swath of Californians is especially critical today, as newly elected state officeholders and state and federal legislators switch from campaign mode to policymaking.