

California adopted the Common Core State Standards (CCSS) in math and English in 2010. CCSS describes what students should know in math and English by the end of each grade. These standards also prepare students to be ready for college and beyond. Nearly nine years after its adoption, awareness of and support for CCSS remain strong among Californians. What do we know so far about the reach and effectiveness of this change, particularly in math?
One of the paradigm shifts introduced by CCSS is how math is organized and taught in high schools. CCSS standards are organized into two pathways:
- Traditional, which follows the standard sequence and includes Algebra I, Geometry, and Algebra II.
- Integrated, which consists of Mathematics I, II, and III, with each course containing standards from all conceptual categories. For instance, Mathematics I covers topics in numbers, algebra, geometry, and statistics.
Acceleration, which gives students the opportunity to reach higher-level math such as calculus earlier, is possible in both pathways. For instance, a 9th grade student may complete 9th grade math (Algebra I or Mathematics I) and 10th grade math (Geometry or Mathematics II) concurrently. Districts can decide when and how students may accelerate.
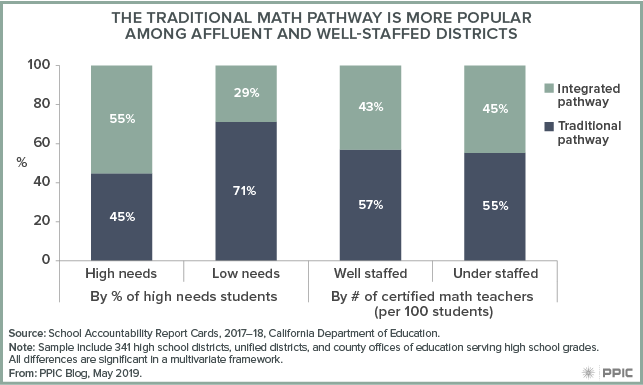
During the 2017–18 school year, 54% of districts followed the traditional pathway while 46% percent chose the integrated pathway. Significant and important differences in these choices exist across districts. Districts with more high-need students—low-income students, English learners and/or foster youth—were more likely to adopt an integrated model; districts with more certified math teachers, who are authorized to teach both pathways, were slightly more likely to choose the traditional pathway.
Does the difference suggest that students in high-need districts may be left behind? Not necessarily. There was no significant variation based on student performance, such as the a-g completion rate. In addition, staffing, which tends to be worse in high-need districts, did not drive most of the differences in those decisions. Other factors, such as district capacity, pedagogical approach, and teaching philosophy may also be at play.
State assessment data does not seem to show any significant difference in student performance based on pathways; however, more formal evaluation is needed. So far, there have been no large scale studies that compare the effectiveness of these approaches. Doing so will require more and better data on a district’s chosen pathway (e.g., the first time these pathways were available) and student outcomes (e.g., postsecondary outcomes)—which the state currently does not collect. The governor’s proposal to create a statewide longitudinal database is a good first step toward building the capacity to evaluate one of California’s signature educational reforms.