

Summary
California has recently increased its investment in higher education after many years of reducing state support. At the same time, the state’s four-year public systems, the University of California (UC) and California State University (CSU), are currently poised to raise tuition for the first time in several years. If the past is any indication, intense discussions lie ahead about the need for additional higher education resources.
We offer a constructive starting point for those discussions by introducing a straightforward and objective assessment of institutional costs. We rely on a measure that connects institutional costs to the number of degrees UC and CSU produce. This measure provides a clear understanding of trends in California’s institutional costs and allows comparisons with colleges and universities in other states. It also offers higher education institutions the opportunity to demonstrate progress toward their goals in an accessible, transparent way.
Applying this measure to California’s public four-year institutions, we find that:
- Institutional costs per degree across UC and CSU fell significantly-17 percent-from 1987 to 2013. This is an important savings in a state that will need to amp up its number of college graduates to meet future economic demand.
- At UC, the cost per degree fell 6 percent over the period-from $116,000 to $109,000. UC’s institutional costs in 2013 were lower than a comparison group that included both public and private institutions across the nation. But UC’s costs were higher than a national comparison group of public schools only.
- At CSU, the cost fell 33 percent-from $67,000 to $45,000. CSU’s 2013 costs were lower than both types of comparison groups-one that included public schools only and one that included both public and private institutions.
We recommend that policymakers and higher education leaders use the cost per degree measure as a way to frame higher education finance discussions. It provides a consistent, reliable, and objective measure of institutional costs and performance. For the measure to be most effective, accurate data reporting will be essential. We also recommend the reintroduction of a state-level higher education authority to add validity to the process of gauging institutional performance. Using the measure within a larger framework of agreed-upon goals would go a long way toward improving higher education finance policy in California.
Introduction
PPIC research has found that if current trends persist, California will fall 1.1 million college graduates short of meeting economic demand by 2030. To close this gap, we expect that both the state and its students will be asked to contribute more to higher education in coming years. How far will additional institutional resources go toward this effort will be determined by how much it costs to produce a degree.
However, recent discussions about higher education costs have featured policymakers and higher education administrators engaged in a debate that appears to leave all parties dissatisfied. As has been noted by the College Futures Foundation, the elements of this frustration are multifaceted and have been building over several decades; to address this problem, their report recommends the development of a common group of measures to assess past performance as well as to guide future finance decisions (College Futures Foundation 2017; Wellman 2016).
Our project takes a first step in that direction. We propose a measure-institutional costs per degree-that connects resources to outcomes in a way that is consistent, comparable, and broadly accessible. To be sure, higher education is and will remain a complex, expensive endeavor-and resources are likely to remain scarce. But, by establishing a common measure of costs, we aim to provide policymakers and the public with an improved, intuitive sense of what their investment in higher education produces, based on accepted numbers. Higher education systems can, in turn, demonstrate whether or not they are making progress toward their goals in a cost-effective manner.
Tracking the Cost of Higher Education
The debate surrounding higher education finance is often obscured by the pervasive view that college costs are out of control.1 This view typically stems from concerns about tuition increases, and, indeed, tuition today is triple what it was twenty years ago at UC and double at CSU. But this perception is also related to a widespread belief that administrative costs, faculty salaries, executive compensation, and facilities and maintenance expenses are too high-as well as to a general sense of growing inefficiency in the higher education business model. This notion is not new and it stems from the complex, opaque nature of higher education finance (Johnson et al. 2014).
Tracking dollars as they flow through higher education systems is inherently challenging. Public universities typically have multiple funding sources and they pursue several missions and activities-all of which combine to create an intricate web of cross subsidization, with revenues associated with some activities being used to offset higher cost activities. Consequently, assigning costs to specific outcomes is difficult. Tracking a single dollar from source to expenditure is even harder. For example, it may cost a university more to produce a chemistry major than a sociology major because of the need for expensive laboratories and equipment as part of a chemistry major’s instruction. Similarly, smaller classes cost more than larger ones; as a result, graduate courses cost more to provide than undergraduate courses, and upper division undergraduate courses generally cost more than lower division undergraduate courses. But universities do not account for spending by major or course level, let alone by individual students. Instead, they track the dollars they spend on faculty salaries, student services, maintenance, and other broad-based categories.
Complicating the picture is the fact that higher education is supported by multiple revenue sources, and those funds are not allocated in the same manner for each student. For example, resources from the state’s General Fund are used to support most students, but universities do not charge all students the same amount of tuition. It is very possible that different streams of revenue support two students in the same program, with one student paying full tuition while the other is attending with the support of CalGrants and institutional aid.2
This web of cross subsidization is necessary to achieve the multiple missions of a higher education institution.3 However, it makes it very difficult to connect an institution’s production costs with its tuition price and with the state’s contributions. It is hardly surprising, then, that the debate surrounding higher education costs struggles to find common ground.
The Cost per Degree Measure
To better understand college costs it is helpful to separate the “cost sharing” aspect of higher education-in which the student, institution, and government bear different portions of the cost of higher education-and the “production cost” of higher education, which is the actual cost to the institutions themselves. It is clear that the cost of higher education has increased for students, in the form of higher tuition and living expenses, while the cost to the state has decreased, given the reduced share of General Fund spending on higher education.
What is less clear is whether the institutional costs of conducting higher education have increased over time (Johnson et al. 2014). Policymakers and the public alike often assume that the trend in these costs follows a steady upward curve. But our investigation into the available data shows a much more complex picture, as the cost per degree measure will show. We believe that this measure, from a state policy perspective, best connects funding with increased degree production.4
The cost per degree measure is based on established scholarship and allows institutional costs to be measured and evaluated across institutions, states, and time using current publicly available data.5 This measure provides additional clarity to those seeking to better understand trends in institutional costs and evaluate these trends relative to the number of degrees these institutions produce. Though no single measure can adequately capture the productivity or efficiency of a complex system like a university, the cost per degree measure offers a reliable, consistent, and objective way to understand a critical aspect of higher education finance.
This report begins by examining costs per degree across both of California’s four-year higher education systems and comparing those costs to similar public institutions nationwide. We then look at the UC and CSU systems separately, tracking their costs per degree and comparing them to similar institutions over time. Next, we take a close look at the key elements that can affect an institution’s cost per degree and consider how those elements work together to influence costs. Finally, we make the case for increasing the profile of the cost per degree measure and offer recommendations to help policymakers and higher education leaders better understand the connection between dollars invested and outcomes realized in California’s higher education systems.
Data and Methods
Throughout this report, we use data from the Delta Cost Project, created by the American Institutes for Research. Their data comes from the US Department of Education’s Integrated Postsecondary Education Data System (IPEDS) but makes some adjustments to facilitate analysis.
The cost per degree measure itself (sometimes known as “education and related cost per degree”) is designed to capture costs directly associated with instruction as well as the indirect expenditures associated with moving a student toward completion-including administration, advising and tutoring, and operations and maintenance.
Despite the many types of costs included in the measure, its actual calculation is quite straightforward. It estimates the aggregate cost of producing a degree by dividing the total cost of education by the total number of degrees produced-including bachelor’s, master’s, professional, and PhD.
For more details, please see the technical appendix.
Costs per Degree at UC and CSU
Contrary to popular belief, institutional costs per degree at California’s public universities (UC and CSU combined) have declined substantially over time.6 From 1987 until 2013-the year of the most recent data-institutional costs per degree fell from $85,000 to $71,000, a decline of 17 percent.
Relative to other states, however, California’s story becomes more complicated (Figure 1). From 1987 to 2003, institutional costs in California were significantly higher than those at comparable public universities’schools of similar size and mission-in the rest of the country. At the same time, California’s costs fell steadily in this period while institutional costs at comparable schools rose slightly. From 2004 to 2011, California’s cost per degree hovered within 4 percent of comparable schools in the rest of the country. More recently, in 2012 and 2013, costs in California have risen somewhat while those in other states fell slightly, creating an 11 percent gap.
Figure 1. California’s cost per degree has fallen over time
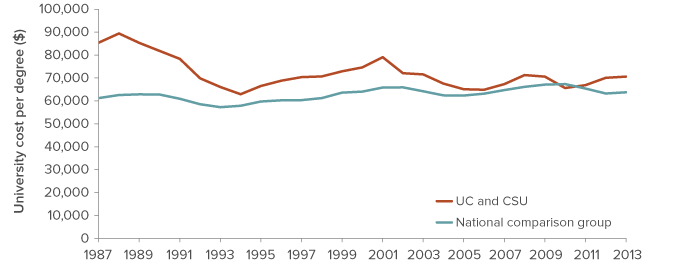
SOURCE: Delta Cost Project.
NOTE: For a description of schools included in the analysis as well as the composition of the national comparison groups, please see the technical appendix. Costs adjusted for inflation.
How do we select comparison schools? Rather than create our own categories, we rely on established groupings.7 In the example above, we rely on the Carnegie Higher Education Classification and include public doctoral-granting institutions as well as medium and large universities that grant master’s degrees.8 While Figure 1 looks at California’s public four-year institutions as a whole, in the discussion below we examine UC and CSU separately, dividing their comparison groups accordingly. For instance, all the schools in the UC comparison group have a very high level of research activity and grant PhD degrees-the University of Michigan, University of Virginia, and University of Texas at Austin are part of this group. For the CSU comparison group, most schools have a mid-level range of research activity, grant master’s and professional degrees, and may confer a small number of doctorates. Below, we call these groupings the “national comparison group.”
In the following sections, we also introduce a second set of comparison groups for UC and CSU. These groups were initially created by California PostSecondary Education Commission (in consultation with the state legislature and the systems themselves) for the purpose of making salary comparisons.9 To some degree, they may be considered “aspirational” comparison schools, with faculty salaries being viewed as a proxy for the quality of the institution. As such, these comparison groups include a mix of public and private institutions from around the country. We call these groupings the “commission comparison group.” (See the technical appendix for full lists of these schools and more detail about our methods.)
Cost per Degree at UC
Since 1987, the cost of producing a degree at the University of California has fallen by 6 percent-that’s $7,000 in constant dollars over the period-from more than $116,000 to $109,000 (Figure 2). Costs among the national comparison group rose more than 6 percent, or about $4,000. For the commission comparison schools-including Stanford and Yale-costs rose more than 69 percent, or nearly $69,000.10 In the most recent years for which data are available, UC’s cost per degree has increased slightly (5 percent).
Figure 2. UC’s cost per degree has fallen over time
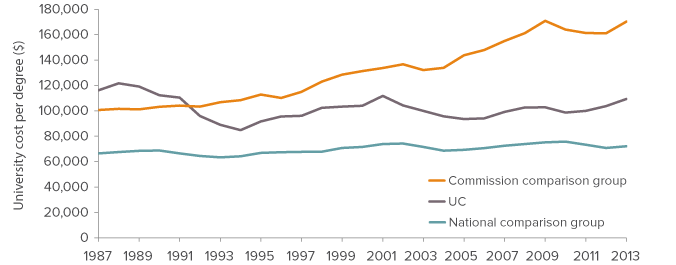
SOURCE: Delta Cost Project.
NOTE: For the list of schools included in the national and commission comparison groups, please see the technical appendix. Costs adjusted for inflation.
UC’s cost per degree trajectory falls squarely between the two comparison groups. In fact, since the early 2000s costs at the comparison group have increased markedly-by 2013, the cost per degree in this group was 60 percent higher than at UC. This large, sustained increase is driven primarily by rising costs among the four private universities in the group (Harvard, Yale, MIT, and Stanford).
The cost per degree for the national comparison group has also increased over the past 20 years, though slowly-and it remains below the UC system. The fact that UC’s average cost per degree has been consistently above that of similar institutions nationally reflects, in part, public salaries that try to keep pace with higher cost of living in an expensive state (Gordon et al. 2007).
Cost per degree at CSU
The downward trend in institutional costs is even more dramatic at CSU. In a span of 25 years, CSU lowered their cost per degree by more than 33 percent-from $67,000 to $45,000 (Figure 3). By comparison, costs for the national comparison group remained relatively constant over the period. And costs for the commission comparison group costs rose significantly-by more than 13 percent, or $9,000.
Figure 3. CSU’s cost per degree is now lower than many similar schools
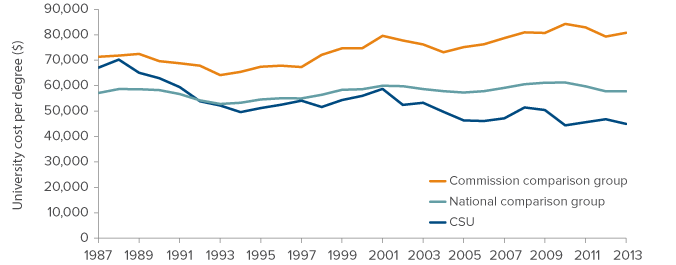
SOURCE: Delta Cost Project.
NOTE: For the list of schools included in the national and commission comparison groups, please see the technical appendix. Costs adjusted for inflation.
CSU’s impressive reduction in institutional costs is most likely related to improvements in graduation rates. Since 2000, CSU has doubled its four-year graduation rate and improved its six-year graduation rate by almost 20 percentage points (Jackson and Cook 2016). Furthermore, these improvements occurred during a period of significant funding cuts. In 2000, CSU received nearly $9,400 per full-time student-by 2013, this amount had dropped to about $6,500, although CSU made up some of this revenue loss with tuition increases. The cost per degree measure, which reveals this sustained downward trend, demonstrates the significant gains made in graduating more students.11
As we-ve seen, the trends in cost per degree at both UC and CSU challenge the commonly held belief that the institutional cost of providing higher education is rising rapidly among public universities in California. In fact, according to our measure, the cost of producing a degree at these systems has decreased over time. Nevertheless, despite this downward trend, institutional costs at UC relative to some other institutions appear to be higher. However, as we discuss in the next section, many factors affect costs per degree. It is important to use this measure as an indicator of the impact of higher education investments rather than as an all-encompassing proxy for evaluating institutional efficiency and productivity.
Costs per Degree in Perspective
The simplicity of the cost per degree measure is part of its appeal. But understanding the impact of the underlying cost drivers is not so straightforward. Several independent factors can affect cost per degree calculations (Table 1).
Table 1. Costs per degree can be affected by many elements
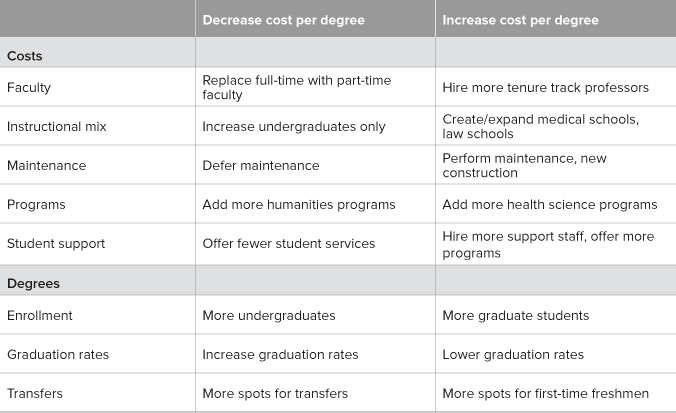
NOTE: The projected impact on the cost per degree measure assumes all other factors are held constant.
Of course, the trade-offs shown in Table 1 are based on the assumption that all other parts of the system remain unchanged. This is a useful assumption in the abstract, but one that is unlikely to hold in practice. For example, investing more resources in student services and advising will cost more money, and all other things being equal, this will increase the cost per degree. But it is also quite possible that this investment would improve the chance that more students graduate in a timely manner-increasing graduation rates and decreasing the cost per degree. In other words, because the measure distills several interrelated policy choices into a single number, it is important to be careful not to oversimply costs.
Interpreting changes in costs per degree, particularly on a year-to-year basis, is especially challenging. For example, a school could choose to put off maintenance and ignore repairs to its physical plant to save money-reducing its cost per degree in a particular year, but leading to greater costs down the road. Or a school may decide to expand its health sciences and engineering programs in response to an increase in demand for STEM graduates. These programs typically cost more on a per student basis because of expensive instructional equipment and higher faculty salaries. This school could be making an important contribution to the state’s workforce needs, but it is likely to incur a higher cost per degree in both the short and long terms. The fact that in this case the cost per degree goes up does not suggest that the school has somehow become less efficient. It is simply a reflection of the realities of investing in programs with higher cost structures.
Other elements also have a defining impact on an institution’s cost per degree-from its mix of students to its overall mission. A school that has a greater share of community college transfer students is likely to have a lower cost per degree, since those students will be able to complete their program quicker. Similarly, a school within the CSU system, with its focus on undergraduate instruction, will have a fundamentally different cost per degree than one in the UC system, which has a stronger emphasis on graduate and professional instruction, as well as research. In fact, the cost per degree nationwide at schools with very high research activity averages 20 percent higher than at schools with a less intense focus on research. (For more details on these factors and others, see the technical appendix.)
Finally, the one critical factor not captured by the cost per degree metric is educational quality (National Research Council 2012). Articulating a single definition of what constitutes a quality education is elusive, and national rankings of higher education institutions are both celebrated and criticized. Nevertheless, California’s higher education system is held in high regard, and a myopic focus on a single performance metric could potentially threaten that quality. For example, an institution could decrease its cost per degree by taking steps that harm the quality of education that it provides-increasing class sizes, decreasing contact hours with students, and lowering graduation requirements. However, there are a number of checks that would make such a wholesale diminishment unlikely. First, internally, the fiercest protectors of the integrity of educational offerings are an institution’s faculty and staff. Second, externally, all of the UCs and CSUs are subject to regional accreditation bodies, whose job it is to ensure that institutions meet specified standards. And finally, market forces would discourage schools from lowering the quality of instruction. If the public perceives an institution’s quality to have declined, fewer students will seek admission and fewer employers will look to hire its graduates.
Looking Ahead
Clearly, many factors affect an institution’s cost per degree. Nevertheless, applying the cost per degree measure at a state or system level provides policymakers and others with a consistent, reliable, and objective method for examining higher education resources and determining whether they are producing the desired effects. If applied carefully, the measure can inform and improve policymakers’ understanding of the broad collection of institutions that make up California’s public system of higher education.
The central aim of this report is to encourage California’s policymakers and its higher education systems to use the cost per degree measure to help frame higher education finance discussions. For these discussions to be most effective, the roles and goals associated with providing higher education need to be better defined. State elected officials are best positioned to focus on identifying overall goals for the systems, embracing a relatively small set of metrics to hold them accountable. System offices could then translate those goals into actions, defining objectives and reporting progress toward goals. Individual institutions could, in turn, focus their data and accounting systems to better understand resource tradeoffs in pursuit system objectives. With this structure in mind, we offer three recommendations to ensure that the cost per degree measure becomes an accepted and reliable metric.
First, it is important that the systems ensure consistent reporting. The Delta Cost Project’s ability to produce consistent, comparable data made our analysis possible. Raising the profile of the cost per degree measure would make data collection more important than ever. Currently, both the UC and CSU systems take steps to ensure that their responses to federal finance surveys provide an accurate reflection of activity on their campuses, and these efforts should be supported. At a minimum, system oversight of data collection should continue, to ensure the integrity of the cost per degree measure as the basis for discussing finance decisions.
Second, for even greater quality assurance we recommend the resurrection of a central statewide higher education authority. The structural argument for a central authority can be traced to California’s Master Plan for Higher Education, which still defines much of the higher education universe in California. From a practical standpoint, establishing a central authority to track progress toward higher education goals would provide a greater degree of transparency, consistency, and impartiality around measuring the performance of the state’s higher education system.
Third, while system-wide reporting is useful, it would also be valuable to break out campus-level costs. Doing so would reveal some of the differences in the missions pursued by individual schools and contribute to a more nuanced understanding of the relationship between resources and outcomes. It would also enable system administrators to engage with campus leaders in discussions regarding the potential for additional resources to produce more graduates.
The idea of using the cost per degree measure as the starting point for institutional cost analyses is more than an academic talking point. In fact, the University of California, Riverside, has applied a similar method to great effect with its activity based costing (ABC) accounting tool (Anguiano et al 2017). Our measure aggregates cost and degree data from broad categories. UCR’s tool captures much more detailed cost data using a campus-wide integrated data system and sophisticated analytical software. By merging information on students, human resources, facilities, faculty workload, and financial data systems, the ABC tool allows for very specific discussions regarding resource allocation. Furthermore, the college now has the ability to quantify the level of cross-subsidization that takes place throughout the campus and can identify the optimal mix for achieving the highest level of student success given institutional priorities and a constrained budget. We would encourage the expansion of such efforts to other willing institutions.
Finally, we propose this measure as a starting point. It is agnostic about key parts of higher education finance discussions-particularly policy goals and the mix of revenue sources. For the measure to be most effective, policymakers and leaders in the state’s higher education systems would need first to identify their policy goals and then discuss how the successful pursuit of those goals could affect costs per degree. The cost per degree measure would then provide a consistent, reliable, and objective way to track progress and assess cost effectiveness across an array of options and strategies.
Topics
Finance Higher Education