
California’s violent crime rate increased in 2022.
- California’s violent crime rate increased by 5.7%, from 468 crimes per 100,000 residents in 2021 to 495 in 2022. While the rates for robbery (theft with force) and aggravated assault increased by 9.9% and 5.2%, respectively, homicides reversed a two-year upward trend, dropping by 6.1%, and rapes remained essentially the same (0.1% decrease).
- In 2022, aggravated assaults were 67% of reported violent crimes; 25% of violent crimes were robberies, 7% were rapes, and 1% were homicides.
Violent crime has increased in recent years.
- Like the nation, California has seen increases in violent crime in the years since the pandemic hit. The state’s violent crime rate is up by 13.5% compared to the pre-COVID rate of 2019 of 436 violent crimes per 100,000 residents.
- The state’s violent crime rate has fluctuated over the decades. Between 1960 and 1980, rates spiked from 236 to 888 violent crimes per 100,000 residents; rates dipped in the early 1980s but climbed again into the early 1990s. After reaching a 1992 peak of 1,115 per 100,000 residents, California’s violent crime rate steadily fell, reaching a 50-year low of 391 in 2014. Since then, the violent crime rate has been trending up, increasing in six out of the past eight years; it is now 26.4% higher than in 2014.
Property crime and violent crime appear to be trending up in 2022 but rates remain relatively low
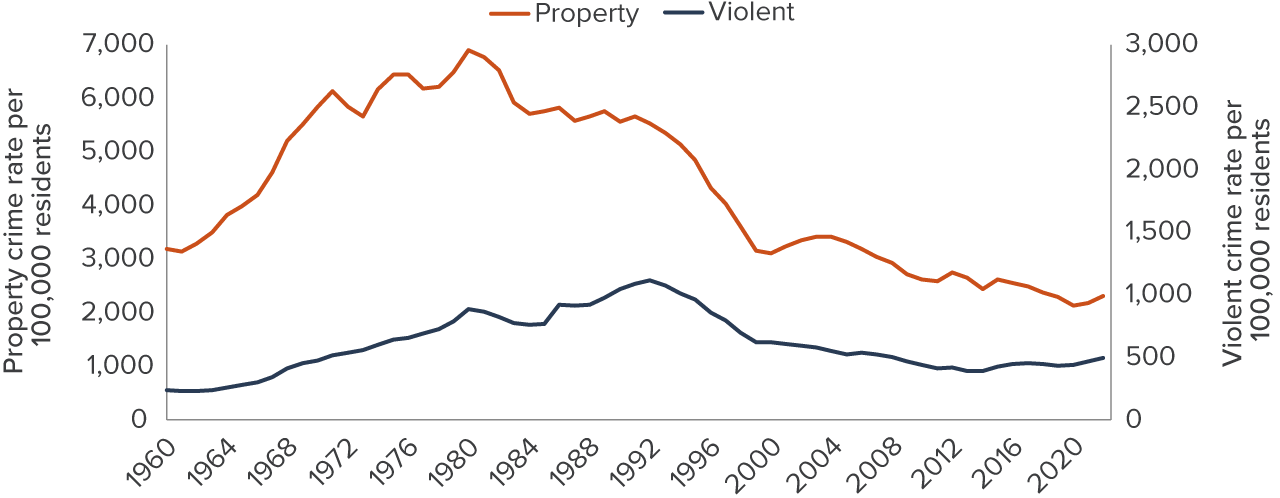
SOURCES: Authors’ calculation based on Federal Bureau of Investigation’s Uniform Crime Report 1960–2002 and the California Department of Justice’s Criminal Justice Statistics Center, California Crimes and Clearances Files, 2003–2022.
NOTE: Property crime includes burglary, motor vehicle theft, and larceny theft (including non-felonious larceny theft); violent crime includes homicide, rape, robbery, and aggravated assault.
The state has seen pronounced increases in gun-related violent crime.
- Compared to 2019 pre-pandemic levels, homicides jumped by 33.9% and aggravated assaults by 25.3% in 2022, with gun-related homicides and aggravated assaults surging by 37.7% and 61.1%.
- Although robberies fell by 6.7% and rapes were down by 0.7% in 2022 compared to pre-pandemic levels, robberies involving a firearm rose by 12.5% in 2022 compared to 2019.
Property crime across California also inched up in 2022.
- The 2022 property crime rate of 2,314 per 100,000 residents was up 5.9% from 2021, and up by 8.7% from 2020, when it had reached the lowest level observed since 1960. Property crime is now slightly above the pre-pandemic 2019 level of 2,302.
- Auto theft continued its increase since 2020, up by 1.6% in 2022, now 31.6% higher than 2019. Larceny (theft without force) also increased in 2022, by 7.3%. While this is the second year in a row with an increase, larceny is still 5.5% below the 2019 pre-pandemic level. For the first time since 2012, burglary (entering a structure to commit a crime) increased in 2022, by 5.8%, but it is still 3.6% below what it was in 2019.
- Of all reported property crimes in California in 2022, 64% were larceny thefts, 16% were burglaries, and 20% were auto thefts.
Crime rates vary dramatically by region and category.
- The lowest violent crime rate—at 318 per 100,000 residents in 2022—was on the southern coast and border (Imperial, Orange, San Diego, and Ventura Counties). The lowest property crime rate was the Sierra region—at 1,405 per 100,000.
- The state’s highest rate of violent crime was in the San Joaquin Valley, which had 641 violent incidents per 100,000 residents. The highest rate of property crime was in the San Francisco Bay Area, at 3,036 per 100,000 residents.
Violent crime increased in most counties…
- Of the state’s 58 counties, 36 saw violent crime rise in 2022, with rates in 13 counties increasing by 20% or more. However, 7 of these 13 counties are smaller counties, which are especially susceptible to wide swings in crime rates due to small populations and rare instances of violent crime.
- Violent crime rose in 10 of the state’s 15 largest counties, and 7 saw increases of at least 10%. San Mateo faced the biggest jump, by 37.5%, but remains one of the 15 largest counties with the lowest violent crime rate (only Orange and Ventura Counties had lower rates in 2022).
…and property crime increased in most counties as well
- Property crime rose in 32 counties in 2022—including 12 of the 15 largest. The property crime rate jumped by at least 10% in 15 counties—including 5 of the 15 largest. Santa Clara saw the largest increase among the largest counties, by 15.1%.
- Property crime fell in only 3 of the 15 largest counties (San Diego, Ventura and San Joaquin), with the biggest drop in San Joaquin County, by 11.8%.
Crime rates increased in most of the state’s 15 largest counties in 2022
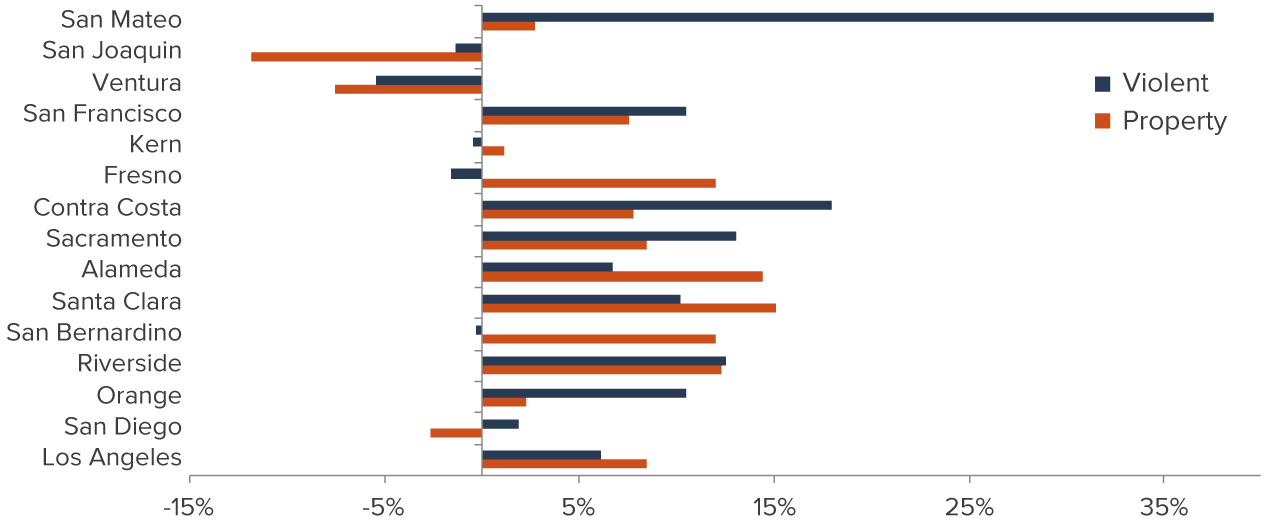
SOURCE: Authors’ calculation based on the California Department of Justice’s Criminal Justice Statistics Center, California Crimes and Clearances Files, 2021–2022.
NOTES: Chart shows the change in crime rates from 2021 to 2022 in California’s 15 largest counties, sorted by population size. Property crime includes burglary, motor vehicle theft, and larceny theft (including non-felonious larceny theft); violent crime includes homicide, rape, robbery, and aggravated assault.
Topics
COVID-19 Criminal JusticeLearn More

California’s Violent Crime Rate Is Diverging from the National Trend

Are Younger Generations Committing Less Crime?

Gun Incidents Drive a Climb in Violent Crime Rates

Retail Theft and Robbery Rates Have Risen across California

Mass Shootings Rise in California amid National Surge

A Large Proportion of Crime Goes Unsolved in California

Commentary: What Do We Need to Learn about Preventing Mass Shootings?

Mass Shootings in California
