


Table of Contents
- Key Takeaways
- Introduction
- Triangulating Data Sources on Homelessness
- Emergency Department Screening for Homelessness
- Differences across Regions and Hospitals
- Using Discharge Data to Inform Policy on Homelessness
- Conclusion and Recommendations
- Notes and References
- Authors and Acknowledgments
- PPIC Board of Directors
- Copyright
Key Takeaways
As California’s homeless population has increased in recent years, the state has taken a more active role in addressing homelessness. State investments totaling over $7 billion support programs for people at risk of or experiencing homelessness (LAO 2022) and major reforms to Medi-Cal include measures intended as targeted supports for Californians experiencing homelessness.
With this increased focus and funding, policymakers need more reliable sources of information on the state’s homeless population to help guide decision-making and public investments. Hospital emergency departments (ED) are on the frontlines of serving people experiencing homelessness, and in this report we investigate what ED data can tell us about homelessness in California.
- In 2019, about 143,000 ED patients were identified as homeless, accounting for just over 4 percent of ED visits by adults 18 to 64 in California. Almost half of patients experiencing homelessness visited the emergency department four or more times during the year, and were more likely than other low-income adults to be admitted to the hospital. →
- The Bay Area and Los Angeles regions saw an outsize share of ED visits by patients recorded as homeless, relative to their share of statewide ED visits. Hospitals operated by counties and the University of California (UC) reported higher shares of ED visits by people experiencing homelessness. In some hospitals, patients experiencing homelessness accounted for nearly 30 percent of ED visits among adults under 65. →
- Screening ED patients for homelessness is not a simple check box question for registration staff; it also presents challenges for nursing and social work staff when hospital and community resources are not available to help their patients who are experiencing homelessness. →
- Behavioral health conditions, including schizophrenia and alcohol use disorders, were among the most common primary diagnoses for ED visits by patients experiencing homelessness. The high prevalence of these diagnoses is related—at least in part—to who is most likely to be identified as homeless in the ED. →
- At least 70 percent of ED visits by homeless adults were covered by Medi-Cal. This underscores the importance of CalAIM, which provides additional benefits through the Medi-Cal program, including housing supports and intensive case management. →
- Linking discharge data with homeless services programs can offer insights into how people engage with programs and help provide better resources to evaluate the programs and investments aimed at improving the lives of Californians experiencing homelessness. →
Introduction
On any given night in California, more than 160,000 individuals experience homelessness, according to the most current statewide counts, which pre-date the COVID pandemic. About 70 percent are unsheltered—meaning they sleep outdoors or in a place not meant for human habitation—a sharp contrast to other states like New York, where most people experiencing homelessness reside in shelters. Despite being the most oft-used metrics to document homelessness, annual point-in-time (PIT) counts are widely considered underestimates of the homeless population (GAO 2020; GAO 2021).
Few other sources of information are available that document the size and needs of the homeless population. Recently, California has started assembling information from local homeless assistance agencies, providing a new resource for statewide information. Collecting more data routinely, statewide, and throughout the year would offer policymakers greater understanding of the distribution and needs of California’s homeless population. Creating linkages across administrative data sources—homeless assistance programs, hospitals, Medi-Cal, and social services—could improve the state’s homeless response by triangulating all available information.
Hospitals, in particular emergency departments (ED), are at the frontlines of serving Californians experiencing homelessness. In recognition of this role, a recent state law (SB 1152) requires hospital EDs to provide food, clothing, and appropriate referrals among other services during the discharge process when they identify patients experiencing homelessness. Separately, hospital discharge data collected by the California Department of Health Care Access and Information (HCAI) includes detailed information on every ED visit at licensed hospitals in the state, and could augment available information on homelessness: in recent years these data include an indicator for patients identified as homeless.
In this report, we sought to assess whether hospital discharge data—in particular new indicators in HCAI discharge data for identifying ED patients who are homeless—can contribute to our understanding of the size, distribution, and needs of California’s homeless population. We examined ED use across hospitals and regions and analyzed the available demographic and clinical information for homeless patients. We also conducted interviews with health care staff working in hospitals across the state to learn more about how they collect information on housing and homelessness from ED patients.
Addressing California’s homelessness crisis is a top priority for state and local governments as the number of people experiencing homelessness has grown in recent years. At the state level, the governor recently signed an executive order to target resources and develop accountability measures aimed at reducing homelessness and connecting people to health care, social services, and housing. Medi-Cal, by far the state’s largest safety net program, has begun implementation of the California Advancing and Innovating Medi-Cal (CalAIM) initiative, which provides funding for new services including housing resources and intensive case management. Additionally, local governments have passed funding measures (e.g., Measure 1A in Alameda County and Measure H in Los Angeles County) and created major initiatives to address the rise in homelessness in communities across California.
The state has made historic investments to support programs for people at risk of, or currently experiencing, homelessness (LAO 2022). Federal resources during the pandemic have also injected more funding into homeless assistance with programs like Project Roomkey, offering new models for providing people with shelter. Because the state has expanded its role in addressing homelessness—through more funding, major reforms in the Medi-Cal program, and greater policy focus—policymakers need reliable sources of information, available statewide, that can help guide decision-making and public investments.
Triangulating Data Sources on Homelessness
We know little about the large and growing number of Californians experiencing homelessness, in part, because there are limited data sources to document the size and needs of this population. By comparing available data from local homeless assistance agencies—annual counts and details on clients and services—to ED discharge data, we can gain some additional insights into the size and characteristics of California’s homeless population and their interaction with hospital EDs.
Homeless Assistance Programs Are the Main Source of Data
The primary source of information on California’s homeless population comes from local agencies—called Continuums of Care (CoC)—that coordinate local, state, and federal homeless assistance resources in communities. Each year these local entities coordinate an annual ‘point-in-time’ (PIT) count, where they attempt to count all people experiencing homelessness in their community. Typically, the PIT count is conducted on specific day(s) in January/February.
Since 2016, the total number of people who are homeless on any given night has grown by about 35 percent—from 118,000 to about 161,000 in the 2020 count, which was conducted in January before the pandemic took hold (Figure 1). Similar increases were documented for the unsheltered homeless population and those considered chronically homeless. (See text box below for definitions of homelessness.)
Annual PIT counts were put on hold in 2021 due to the pandemic, but were completed in 2022. While several agencies have released their 2022 counts, Los Angeles County has not—making it difficult to assess statewide trends since nearly 40 percent of the state’s homeless population resides in LA. The available data suggests California’s homeless population increased about 8 percent between 2020 and 2022. Some counties saw a much larger increase, like Sacramento County (68%), while other counties reported a slight decline, such as San Francisco (-5%). (See Technical Appendix A for more information on the 2022 point-in-time counts.)
California's homeless population has increased in recent years
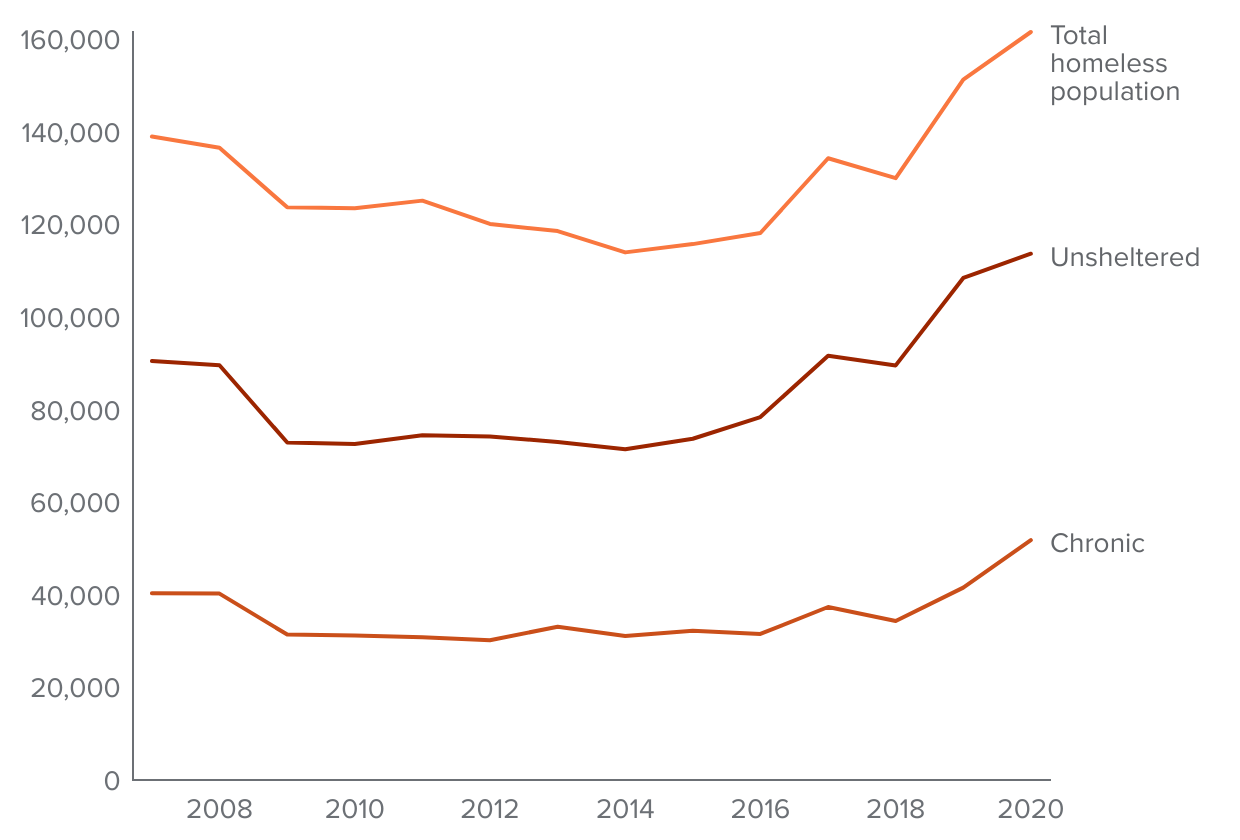
SOURCES: U.S. HUD Continuum of Care Population and Sub-population Reports.
NOTES: Numbers are from point-in-time (PIT) annual counts. Chronically homeless refers to people who have been homeless for one or more years, or on four or more occasions in prior three years that together are over one year, and have certain disabling conditions.
Annual counts have limited use for informing policy
Despite being the most-often used statistics on homelessness, annual counts have well-documented limitations, including varying methods of data collection, reliance on volunteers, and only offering a “snapshot” of state and local homeless populations at a given moment (GAO 2021; California Interagency Council on Homelessness, 2020). Researchers and government agencies agree that annual PIT counts underestimate the size of the homeless population (GAO 2020; LAO 2022)—most experts estimate the true size is two to three times larger.
Another drawback of these annual counts is that they provide no information on the flow of people moving into and out of homelessness in any given year. They also provide little information about how long people have been homeless, and do not collect data about connections with health or housing services. As a result, the PIT data are ill-suited to assess how policy changes or increased funding resources are helping people to exit homelessness and stay connected to stable housing, or how many people may become, or be at risk of becoming, homeless.
Data from homeless assistance programs can offer deeper insights
Beyond conducting the annual PIT counts, local homeless assistance agencies offer a range of services from emergency shelters to street outreach. These agencies operate the Coordinated Entry System that prioritizes and connects individuals to available housing in the community; they also coordinated Project Roomkey, a major expansion in non-group housing availability (primarily in hotels/motels) for people experiencing homelessness during the pandemic.
When local programs provide homelessness services to people, they collect information into local databases called Homeless Management Information Systems (HMIS), a condition of receiving federal HUD funding for homeless services. Recently, the California Interagency Council on Homelessness, which coordinates the state’s homeless response and funding streams, created a new statewide data warehouse—the Homeless Data Integration System (HDIS)—that aggregates data from the 44 local HMIS databases.
The HMIS includes demographic data on clients, along with limited information on self-reported health status and behavioral health conditions. The HMIS data also includes information on the length of time clients have been experiencing homelessness, the types of services they receive and most importantly, information on outcomes, including whether people get connected to housing, and if so, whether they fall back into homelessness.
Data from Emergency Departments Can Offer Additional Information
Discharge data reported by hospital emergency departments can allow timely analysis of trends across the state for hospitalizations and ED visits by people experiencing homelessness. The ED discharge data collected annually by HCAI now include specific zip codes that indicate whether a patient was identified as homeless during an ED visit.
As the only guaranteed source of health care open 24 hours a day/365 days a year, EDs are frontline providers to people experiencing homelessness (Kanzaria 2020). ED use is high among the homeless population, and EDs often represent the only contact for health services, especially among the chronically homeless (Kushel et al. 2002; Morris & Gordan 2006; Rountree et al. 2019). Federal law requires EDs to provide a medical screening and stabilizing treatment to all patients who seek care, regardless of their financial or other circumstances. Federal law also requires hospitals to have policies and procedures for patients likely to suffer adverse health consequences without adequate discharge planning.
A recent state law (SB 1152) expanded and standardized discharge planning and reporting requirements for hospital patients identified as homeless. Starting in July 2019, hospitals must screen patients for homelessness and keep a written record of discharge planning that includes the types of supports that were offered to homeless patients. Hospital staff must offer medication, food, clothing, transportation, and service referrals including efforts to connect patients to local homeless assistance programs and outpatient medical and behavioral health providers.
This detailed information is not included in the HCAI discharge data, but these new requirements heightened focus on how hospitals document treatment for patients who are homeless. Hospitals were incentivized, though not provided with any additional funding, and given guidance to incorporate screening and reporting processes for the care provided to homeless patients (California Hospital Association 2019). At the same time, HCAI has been working with hospitals and providing technical assistance to improve reporting of people experiencing homelessness in the discharge data (HCAI 2021).
Discharge data can also offer an important complement and/or “check” on other limited data sources to document and monitor homelessness across the state. For example, a recent study using hospital discharge data from Illinois found that the PIT counts indicated a 24 percent decline in homelessness between 2011 and 2018. But during that time, estimates more than doubled of individuals who visited a hospital and were identified as homeless (Madigan et al. 2020).
Comparing ED Discharge Data to Local Homeless Program Data
To assess hospital ED data as a resource to identify homeless Californians, we compared it against data from local homeless assistance programs (HMIS/HDIS). Both sources include people who accessed services at any point during the year, thus offering a more comprehensive view of homelessness compared to point-in-time counts. While the ability to identify individuals throughout the year can bolster our understanding of the scope of homelessness in California, it is important to note that discharge data and HMIS/HDIS data capture only people who receive services.
Statewide, nearly 130,000 unique ED patients were recorded as homeless during at least one visit in 2019. We estimate the total number of homeless ED patients to be closer to 143,000 after accounting for visits that were missing a patient identifier. To ground these estimates of ED patients identified as homeless, we situate them alongside annual PIT counts of about 151,300 in 2019 and 161,500 in 2020 and local homeless assistance programs that reported serving over 240,000 unique individuals at some point during 2019. Most experts agree that none of these data sources fully capture all people who meet the federal definition of homelessness, as Figure 2 illustrates. For more details on data sources that provide homeless counts, refer to Technical Appendix A.
Currently available data sources capture overlapping slices of the population of Californians experiencing homelessness
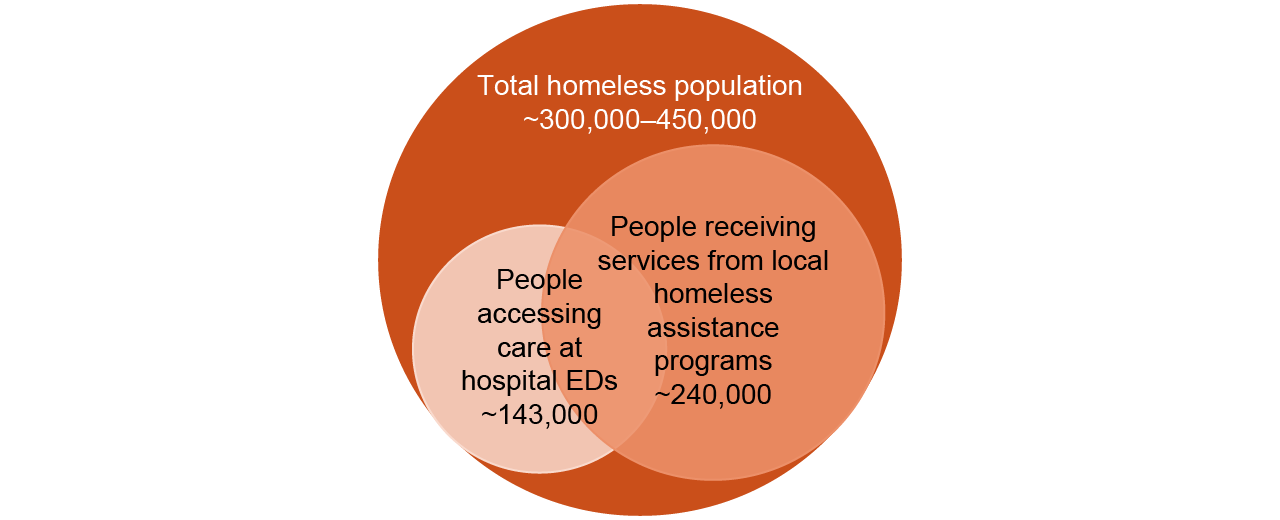
SOURCES: Authors’ analysis of HCAI hospital discharge data, 2019; US HUD Point-in-Time annual counts; California Homeless Data Integration System (HDIS).
NOTE: The total homeless population estimate uses the 2019 annual PIT count (151,000) and simply multiples it by a factor of 2 for the lower-bound estimate and 3 for the upper bound, as this is the consensus estimate from housing and policy researchers.
There are, of course, Californians experiencing homelessness who do not access ED care during the year. Given what we know about the high disease profile and medical vulnerability of people experiencing homelessness, we would expect some overlap between those accessing care at hospital EDs and people receiving services from homeless assistance programs, but without connecting these data we do not know what that crossover might be. Available studies suggest a range between 30 percent and 60 percent of people who are homeless access care at EDs, with higher rates among the chronically homeless (Kushel et al. 2002; Morris & Gordan 2006; Rountree et al. 2019; Raven et al. 2020).
In a recent study based on national data, about 70 percent of people seeking services through homeless assistance programs visited an ED in the past year, with even higher shares among the unsheltered (Rountree et al. 2021). Linking these data at the individual level would provide more information on who is served by both EDs and homeless assistance programs and how this might vary across regions of the state. Hospital ED data can also provide insight into the health needs of people receiving homelessness services through local programs, given they contain information on individuals’ medical and behavioral health diagnoses.
We also examined available demographic information—including age, sex, and race—across discharge data and homeless assistance program data (Figure 3 and Figure 4). The ED data includes much higher shares of men and middle-aged adults (ages 35–64) compared to clients of local homeless assistance programs. Also of note, the discharge data shows almost no children under 18 identified as homeless during an ED visit, which contrasts with about 25 percent of clients of homeless assistance programs. We also see differences by race/ethnicity; compared to the homelessness services data, lower shares of Latino and Black ED patients are identified as homeless.
Homeless assistance programs serve higher shares of homeless women and children compared to emergency departments
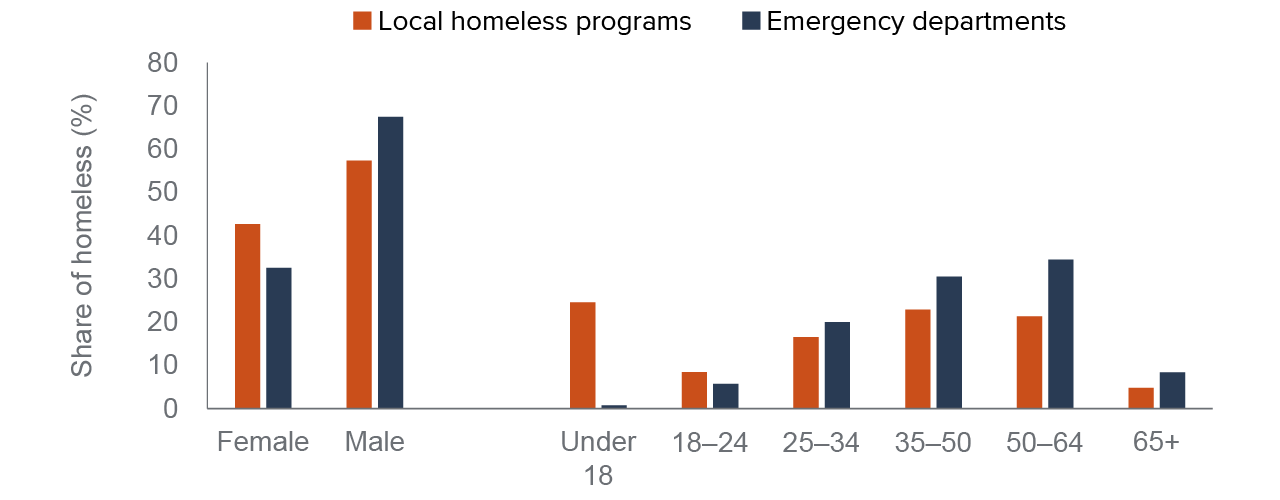
SOURCES: Authors’ analysis of HCAI hospital discharge data, 2019; California Homeless Data Integration System (HDIS), 2019.
NOTE: Emergency department age categories are based on visit-level information because higher shares of children are missing patient identifiers. Refer to Technical Appendix B for more information.
Fewer Latino and Black ED patients are identified as homeless
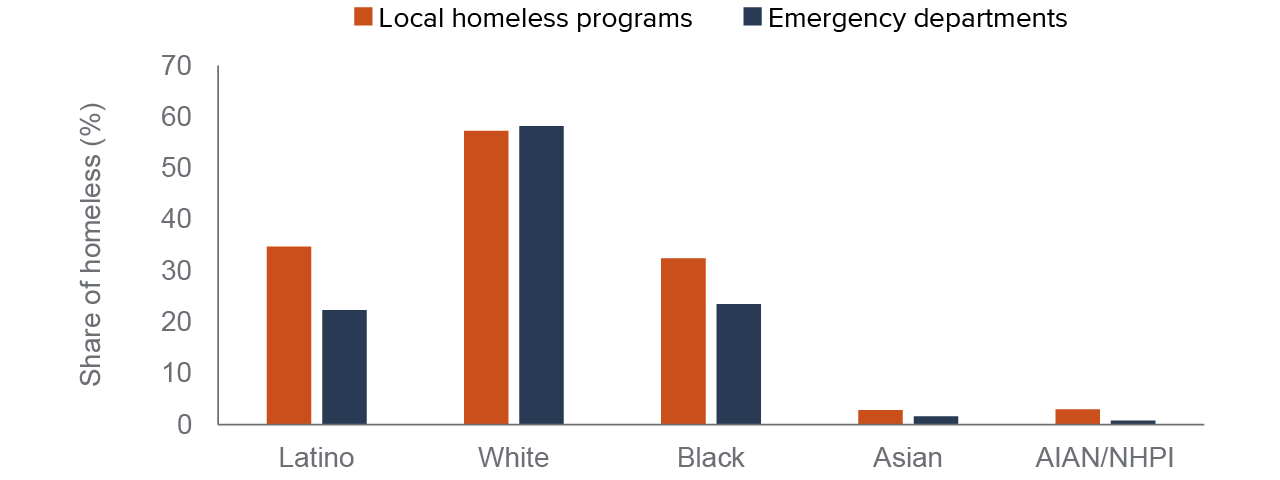
SOURCES: Authors’ analysis of HCAI hospital discharge data, 2019; California Homeless Data Integration System (HDIS), 2019.
NOTES: Racial/ethnic groups in the HDIS data are not mutually exclusive and there is no way to combine ethnicity (Latino/non-Latino) with race categories. We aligned the ED discharge data racial/ethnic categories in a similar way for comparison.
Because these estimates of homelessness rely on decentralized, local stakeholders to collect information—that is, hospitals and homeless assistance agencies—it is important to examine differences across California’s regions. In most regions, the homeless assistance data contains more individuals than people identified as homeless in the hospital discharge data, though this is not universally true. For example, in Alameda and San Francisco Counties the homeless counts from the two sources are nearly identical. In Fresno and Madera Counties, the ED data identifies about 50 percent more people experiencing homelessness compared to homeless assistance data (see Technical Appendix B for more details).
Some of the demographic differences we see between individuals captured in homeless assistance data and those present in ED discharge data may be due to programmatic reasons. For example, many families and children are connected and prioritized for homeless assistance through safety net programs like CalWORKs. Differences may also be related to who among the homeless population accesses health care in the ED, and who is identified as homeless by hospital staff, which we discuss in more detail in the following section.
Emergency Department Screening for Homelessness
Despite growing interest in screening for social needs among patients—including housing and homelessness—no uniform method exists for collecting this information. Multiple screening tools are available that ask about homelessness, housing stability, and other social needs (Gottlieb et al. 2016; Cantor & Thorpe 2018).
The passage of SB 1152 has placed greater attention on screening patients for homelessness in the ED; all of the hospital staff we interviewed were aware of the law and described updates to their patient registration and discharge processes—and how updates had been incorporated into their EHR data systems. At the same time, hospitals must determine how best to collect this information while providing care and managing limited resources (Taira et al. 2022; Franco et al. 2021)
Hospitals are well-versed in creating protocols and procedures that address statutory reporting requirements, and everyone we spoke with indicated their hospital had created a working group and/or designated a point person to address the requirements of SB 1152. At the same time, we also heard that learning whether a patient is experiencing homeless is not a simple check box question; accurately identifying someone who is homeless or at risk of imminent homelessness is a difficult task that requires time and often developing a relationship with a patient.
Patient Registration Staff Typically Conduct Initial Homelessness Screening
From our interviews, we learned that most hospital EDs initially gather information on a person’s housing status during the patient registration process. Specifically, staff who register ED patients collect basic information that includes questions about a person’s address and living situation, including whether that person may be experiencing homelessness.
In our interviews with patient registration staff, we heard that privacy and dignity concerns made screening patients for homelessness a challenge. Perhaps not surprisingly, staff reported that asking people about their housing—and homelessness in particular—was a very sensitive issue.
“The biggest challenge is asking the question on whether they’re homeless or concerned about losing their housing… [Patients] look at registration differently than they look at a clinician—they don’t understand why we need to ask about that.”
“Some patients give you an address, but they’re really staying at an unstable place…. For the patients that are disclosing that they’re at a shelter or they’re carrying a lot of bags, it’s almost a little easier to identify that they’re homeless. It’s really the ones that, like I said, are a little bit more stable. They might even be staying in an RV and maybe still working, and really trying to capture it is hard because homelessness is really broad when you really look at the actual definition of it.”
At two hospitals we interviewed, staff indicated their patient data entry system provided an alert if the patient’s home address was an emergency shelter or other location likely signaled a person is experiencing homelessness. All registration staff indicated that patients who said they were living in their car or at a shelter were recorded as homeless.
At another hospital, registration staff had recently started asking ED patients about the stability of their housing situation—for example, if the patient was concerned about not having a place to live in the next few weeks or months—though these questions triggered even more concern from some patients as to why they were being asked.
Hospital EDs Do Not Have Adequate Resources to Assist Homeless Patients
At the hospitals we interviewed, the clinical staff—including ED nurses and social workers—relied primarily on information collected during the registration process, which created a “flag” in their EHR data system indicating the patient was homeless. ED nurses and physicians initially assessed patients for their immediate medical needs. Then, depending on the diagnosis and treatment, nurses and physicians reviewed registration information, which could trigger a consult to social work staff along with further follow-up with the ED clinicians for discharge planning, including decisions around hospital admission and follow-up care.
ED social workers at a few hospitals said they were engaged only for consults when there was violence or trauma, not simply because someone had been identified as homeless. Mostly this issue was the result of too much demand for social work and case management services with too few resources available. Social work staff also noted that many homeless patients access the ED at night or on weekends when social work support is less available at hospitals.
“We have folks who show up because they’re cold and hungry—we’re often the one safe place that they know they can go to 24 hours a day. But in terms of being able to help those folks, especially in the middle of the night or on weekends, we’re even more limited than we are Monday through Friday… it puts a tremendous strain on [staff]. And for the social work team, in particular, to have to just turn people out onto the street.”
ED nursing staff also shared sentiments about the difficulty with screening and identifying patients as homeless when it feels like resources are not available to help them.
“Do you force [nursing staff] to ask the question [on housing stability and homelessness] if there’s no solution? Are we just asking the question that we have no resources to do anything about? That becomes a huge issue for our staff.”
Some social workers we interviewed expressed uncertainty over whether registration staff had been able to complete screening for all patients. This became a larger issue during COVID as registration procedures changed in order to protect staff. In addition, when COVID hit, many hospitals were still developing routines for processes put in place to respond to SB 1152 requirements. Those requirements were waived during the pandemic to support the surging demand for hospital care.
Beyond the challenges brought on by the pandemic, concerns also arose around how well patients are screened if they arrive at the ED in crisis and are not able to complete the registration process. In these cases, the patient must be registered at a later time, which can create a lapse in screening and recording of a patient’s housing status. At one hospital, ED nursing staff indicated that their EHR data system had a way to determine whether a patient had been screened for homelessness or whether that information still needed to be collected.
Despite some limitations associated with the screening processes that staff discussed above, the ED discharge data can offer new insights on how the homelessness crisis impacts hospitals across the state—and also offer additional information on the health needs of California’s homeless population.
Differences across Regions and Hospitals
To determine how hospitals and regions across the state vary in reporting visits by homeless patients, we analyze discharge data from ED visits by adults ages 18 to 64—including visits that resulted in hospital admission and those where the patient was treated and released the same day, or outpatient ED visits.
Statewide, about 370,000 ED visits—or about 4 percent of the nearly 9 million ED visits by adults 18 to 64 in 2019—were by patients recorded as homeless (Figure 5). For ED visits that led to a hospital admission, a higher share (8%) were by homeless patients.
About 4% of ED visits are by patients identified as homeless
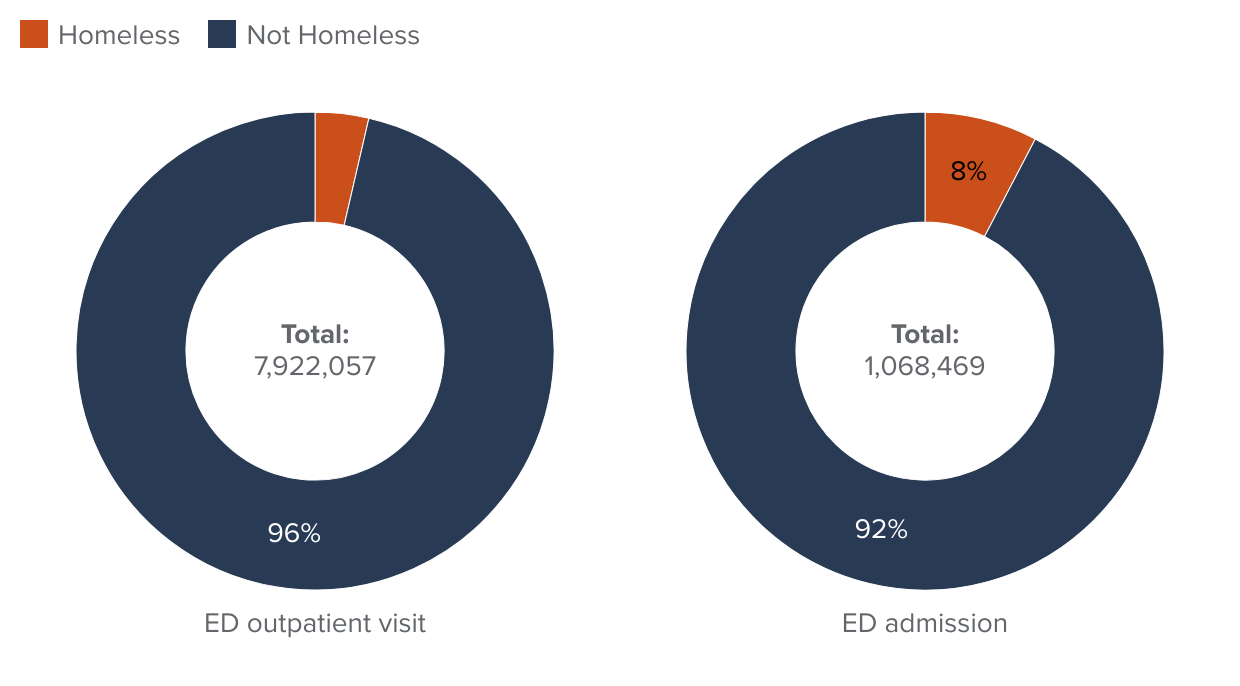
NOTE: Includes ED visits made by patients aged 18 to 64.
Looking statewide at ED visits by adults under 65 across types of hospital ownership (Figure 6), county-operated hospitals reported higher shares of visits by homeless patients (17%, green bar) relative to total ED visits (10%, orange bar). This difference reflects the primary role of public hospital systems as health care safety net providers as well as the fact that county hospitals tend to be in larger, urban counties (though there are exceptions). County hospitals may also report higher shares of homeless patients because the county also operates other agencies that often interact with homeless populations in local communities—including homeless assistance programs, jails, and public mental health services.
County hospitals serve a disproportionately higher share of homeless patients relative to the share of total ED visits
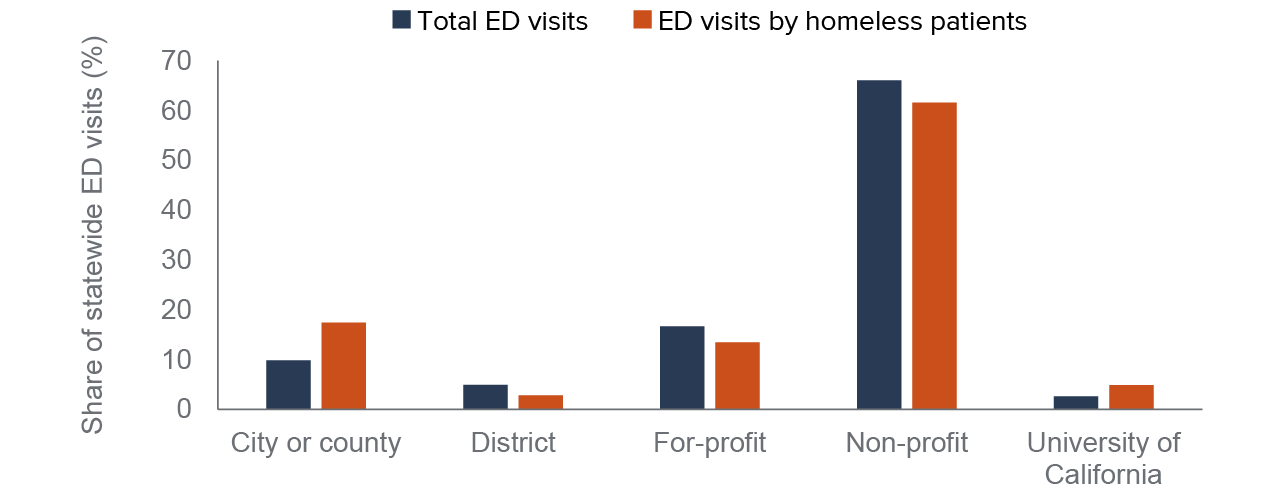
SOURCE: Authors’ analysis of HCAI hospital discharge data and annual hospital financial reports, 2019.
NOTE: Includes ED visits made by patients aged 18 to 64 at hospitals that operated an ED throughout 2019.
Hospitals operated by the University of California (UC) reported higher shares of ED visits by people experiencing homelessness (5%) relative to their share of statewide ED visits (3%). A few larger, urban counties—including Sacramento, Orange, and San Diego—do not operate county hospital systems, and UC hospitals operate as primary safety net hospitals for those regions. Other types of hospitals, including nonprofits, for-profits, and district hospitals, recorded slightly smaller shares of ED visits by homeless patients relative to their share of all ED visits—though statewide nonprofit hospitals provided over 60 percent statewide of all ED visits by patients identified as homeless. In counties that do not operate public hospital systems, nonprofit and for-profit hospitals have proportionately higher shares of ED visits among people experiencing homelessness that align more closely with overall ED visits (see Technical Appendix B for more details).
Across the state, the Bay Area, Los Angeles, and other Southern California regions stand out as places with more ED visits by people who are homeless (Figure 7, green bars) relative to the region’s total ED visits (orange bars). Again, this finding likely reflects that California’s homeless population is more concentrated in urban areas of the state. However, it could also be related to how well individual hospitals across regions document and record homelessness amongst their patients, which we explore below.
Bay Area and Los Angeles report relatively higher shares of ED visits by homeless patients compared to all ED visits
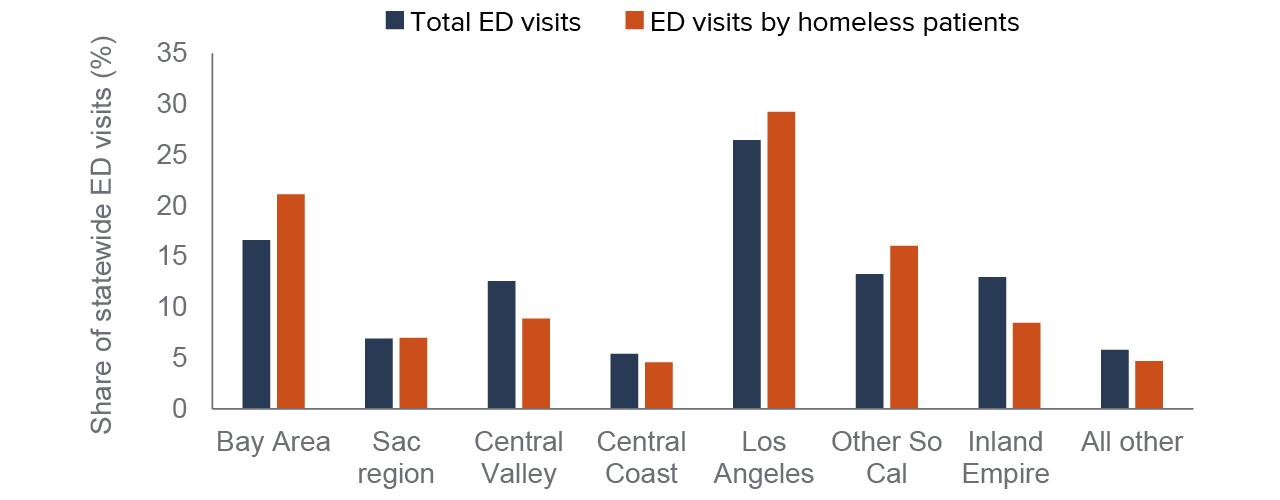
SOURCE: Authors’ analysis of HCAI hospital discharge data, 2019.
NOTES: Includes ED visits made by patients aged 18 to 64 at hospitals that operated an ED throughout 2019. Regional definitions are provided in Technical Appendix B, Table B2.
To drill down into differences across individual hospitals, we calculated the shares of ED visits by homeless adults for each hospital that operated an ED throughout 2019. Figure 8 illustrates the variance in visits broken down by hospital ownership type and size. We did not separate county, UC, or district hospitals by size as the former are mostly large hospitals with over 200 beds; district hospitals are mostly smaller hospitals with fewer licensed beds.
Virtually every hospital in the state reported at least one ED visit where the patient was identified as homeless, with a wide range across ownership type. Consistent with earlier figures, most county and UC hospitals reported higher shares of ED visits by homeless patients, on average, though that is not universally true. For example, county-operated hospitals in the San Jose region reported much lower shares of ED visits by homeless adults compared to other county hospitals. Likewise, there are nonprofit and for-profit hospitals that report relatively high shares of ED visits by homeless patients.
Select hospitals report upwards of 25% of ED visits are by patients experiencing homelessness
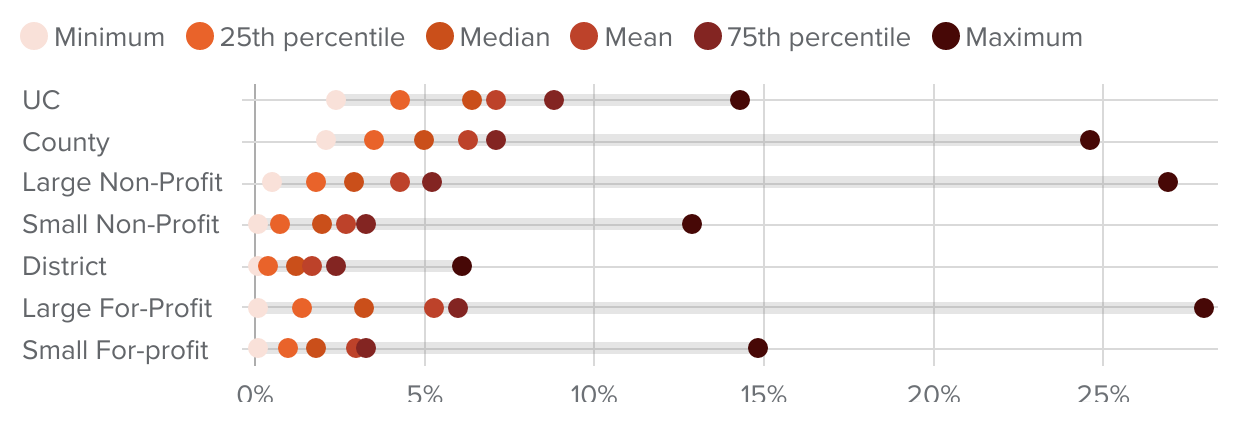
SOURCE: Authors’ analysis of HCAI hospital discharge data and facility-level annual financial reports, 2019.
NOTES: Includes ED visits made by patients aged 18 to 64 at hospitals that operated an ED throughout 2019. The dots indicate the range in values for individual hospitals of the share of ED visits by patients identified as homeless.
In some county-operated hospitals, as well as large nonprofit and for-profit hospitals, discharge data indicates upwards of 25 percent of all ED visits by adults under 65 are by homeless adults. At Chan Zuckerberg San Francisco General (ZSFG) hospital, the discharge data indicates one quarter of all ED visits were by homeless patients. Though this may seem quite high, the share reported in the ED discharge data actually may be somewhat low compared to a recent analysis of local administrative data, which found about one-third of ED patients at ZSFG were homeless (Fuchs et al. 2021).
In our interviews with hospital staff, we heard similar assessments. Specifically, we asked ED nursing and patient registration staff how well they thought their hospital discharge data corresponded to what they would expect based on their experience. Most indicated the recorded data seemed somewhat low but not that far off. The one exception was at California Hospital Medical Center–Los Angeles, located in the heart of downtown and near skid row. Though the discharge data indicates about 12 percent of ED visits were by people experiencing homelessness, the care coordinator we spoke with suggested the vast majority of patients they served were experiencing homelessness.
Using Discharge Data to Inform Policy on Homelessness
To assess the extent to which discharge data could provide additional insights to help plan for and evaluate policy interventions, we examined other information available in the data, including diagnoses, frequency of ED use, and where patients are discharged. Other studies have found that ED use and hospitalizations peak just before episodes of homelessness, suggesting the ED could serve as an intervention point to prevent someone from becoming homeless (Treglia et al. 2019; von Wachter et al. 2019; Doran et al. 2020). This type of information can also help inform plans and monitor progress in the implementation of new benefits available through CalAIM (see text box).
Most Homeless ED Patients Are Middle-Aged Men Covered by Medi-Cal
As discussed above, about 70 percent of homeless ED patients are men and about two-thirds are between the ages of 35 and 64. While these shares align broadly with characteristics of people experiencing homelessness, they are quite different from all ED patients not identified as homeless—where young children and seniors over 65 comprise a disproportionate share of ED use. For this reason, we focus our comparisons on ED visits by adults age 18 to 64. When we examine things like diagnoses and frequency of ED use, we further limit our comparison group to adults covered by Medi-Cal or who are uninsured to better narrow in on a low-income group of patients.
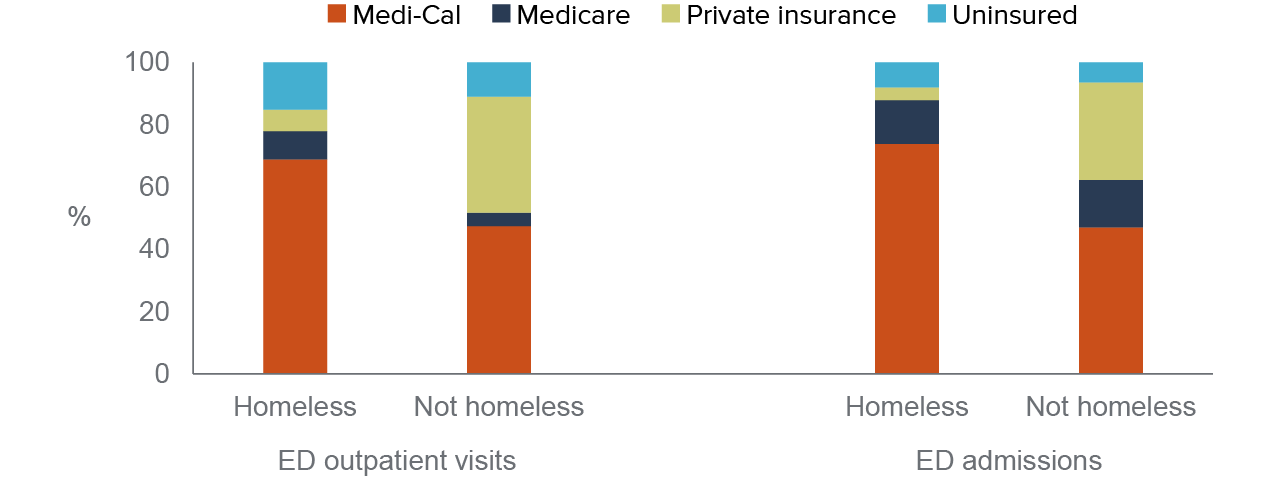
Medi-Cal was the reported coverage source for the vast majority of outpatient ED visits by patients identified as homeless: seven in ten of these visits were covered by Medi-Cal (Figure 9). Medicare covered another 9 percent—patients who most likely had coverage due to a disability since we do not include patients age 65 and older. Many homeless patients may be “dually eligible” for both Medicare and Medi-Cal, although Medicare should be the primary payer for both ED outpatient and hospital admissions. Very small shares have private insurance (6%) and a surprisingly high share (15%) were reported as uninsured (either self-pay or county indigent programs).
Few ED visits by homeless patients are covered by private insurance; most are covered by Medi-Cal
SOURCE: Authors’ analysis of HCAI hospital discharge data, 2019.
NOTES: Includes all ED visits made by patients aged 18 to 64. Insurance coverage is based on the expected source of payment for the hospital encounter.
When we turn to patients admitted to the hospital from the ED, the share of homeless patients with either Medi-Cal or Medicare jumps to about 90 percent. Only 4 percent have private insurance and about 8 percent are uninsured. The share of ED admissions paid for by public insurance sources, including Medi-Cal and Medicare is also higher for patients not recorded as homeless, although over 30 percent of non-homeless patients who are hospitalized have private insurance.
Chronic Conditions Were More Often Diagnosed in Homeless ED Patients
We analyzed the primary diagnosis and up to 24 additional diagnoses for patients visiting the ED, to compare diagnostic information from visits by homeless patients against visits where the patient was not recorded as homeless. We limit our analysis to ED visits covered by Medi-Cal or reported as uninsured to focus our comparison group on low-income ED patients.
Looking at primary diagnoses, the top reasons for ED visits made by patients identified as homeless were for behavioral health conditions. Schizophrenia (8%) and alcohol-related disorders (7%) were the most common followed by substance-related disorders (5%), mood disorders (4%), and suicide and self-inflicted injury (3%). Other top diagnoses included skin infections (5%), superficial injuries (3%), chest pain (3%), and abdominal pain (2%).
In contrast, there are no behavioral health conditions among the top ten primary diagnoses when we examine ED visits by other low-income adults not identified as homeless. The top five diagnoses for this group included abdominal pain (5%), chest pain (4%), sprains and strains (3%), back problems (3%), and upper respiratory infections (3%). Alcohol-related disorders, at 2 percent, was the 13th most common diagnosis for the non-homeless, low-income adult group. Refer to Technical Appendix Table B3 for more details on primary diagnoses.
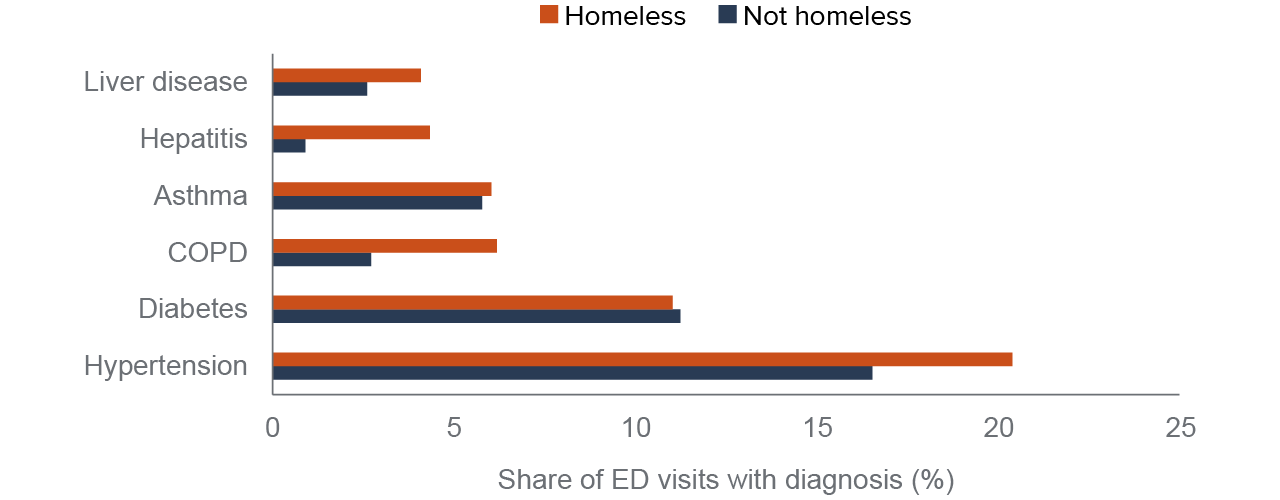
In visits by homeless patients, ED physicians diagnosed higher shares of chronic conditions like hypertension and COPD compared to ED visits by other low-income adults (Figure 10). Diagnoses of asthma or diabetes were similar in the share of visits by patients identified as homeless to those who were not.
Diagnoses of liver disease, hepatitis, COPD, and hypertension were higher in ED visits by homeless patients
SOURCE: Authors’ analysis of HCAI hospital discharge data, 2019.
NOTES: Includes ED visits made by patients age 18 to 64 that were expected to be paid for by Medi-Cal or the patient was recorded as uninsured and examines primary diagnosis and up to 24 additional diagnostic codes. Detailed ICD-10 diagnostic codes are categorized using AHRQ Clinical Classification Software (CCS) into more meaningful categories. See Technical Appendix B for additional information.
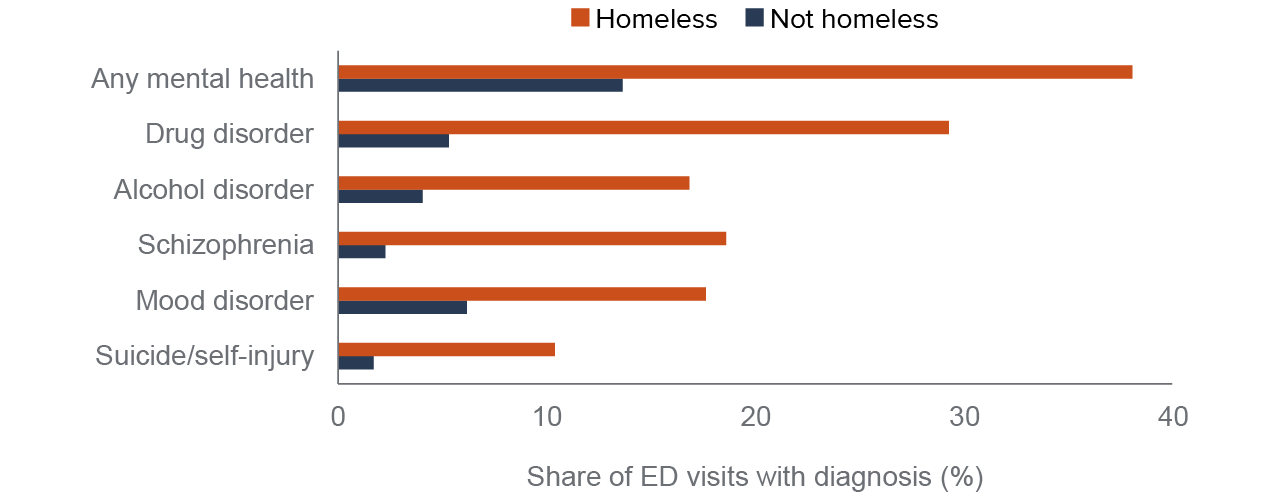
When we focus on any behavioral health conditions, during about 38 percent of ED visits homeless patients received a mental health diagnosis—most often schizophrenia (19%) or a mood disorder (18%). About 30 percent had a drug-related diagnosis, and 17 percent an alcohol-related disorder (Figure 11). This compares to about 14 percent of ED visits with any mental health diagnosis and about 5 percent with drug or alcohol-related disorders among other low-income ED patients.
A mental health condition was diagnosed in nearly 40 percent of ED visits by homeless patients; about 30 percent had a drug-related disorder
SOURCE: Authors’ analysis of HCAI hospital discharge data, 2019.
NOTES: Includes ED visits made by patients aged 18 to 64 that were expected to be paid for by Medi-Cal or the patient was recorded as uninsured and examines primary diagnosis and up to 24 additional diagnostic codes. More detailed ICD-10 diagnostic codes are categorized using AHRQ Clinical Classification Software (CCS) into more-meaningful categories. Drug disorder does not include tobacco use. Mental health condition includes mood disorders, schizophrenia, suicide and intentional self-inflicted injuries, which we show as separate categories, along with personality disorders, adjustment disorders, anxiety disorders, attention-deficit and disruptive behavior disorders, and impulse control disorders.
The significantly higher shares of behavioral health diagnoses are in line with other studies of health care use among homeless populations (Kushel et al. 2002; Morris & Gordan 2006; Rountree et al. 2019). The prevalence of behavioral health conditions among homeless patients who seek care at EDs should not be interpreted as evidence that such disorders are a cause of homelessness: most experts agree that homelessness is caused primarily by a lack of affordable housing; there is also evidence that structural racism contributes to high levels of homelessness among Black Californians (Colburn & Aldern 2022; Milburn et al. 2021; Olivet et al. 2021).
The high level of behavioral health diagnoses may signal the difficulty of obtaining stabilizing treatment for severe mental illness and substance use disorders for people experiencing homelessness. It may also be a reflection of the challenges associated with identifying people experiencing homelessness in a hospital ED setting. Other studies have elevated the difficulties clinicians face assessing a patient’s housing status and that identification of someone as homeless can be biased, based on heuristic approaches, including visual cues (e.g., bags of belongings or inappropriate clothing) or stereotypes of homeless ED patients (e.g., intoxicated)—especially for clinicians working in busy EDs (Doran et al. 2013; Tario et al. 2022). Our interviews with ED hospital staff also suggest that people who present at EDs with clear behavioral health issues or may have visible signs of being homeless are more apt to be screened and recorded as homeless relative to other ED patients.
This perception also bears out in quantitative analysis when we connect ED visits across patients. Using this information, we ran statistical models predicting whether an individual patient who visited the ED four or more times within a year was identified as homeless during a particular ED visit during the year. A patient diagnosed with a behavioral health condition during an ED visit had a significantly higher probability of being identified as homeless during that visit than during visits where they were diagnosed with more common conditions such as abdominal pain, chest pain, back problems, or sprains and strains. Refer to Technical Appendix B for more details.
About One in Ten Homeless Patients Are Discharged to Other Facilities
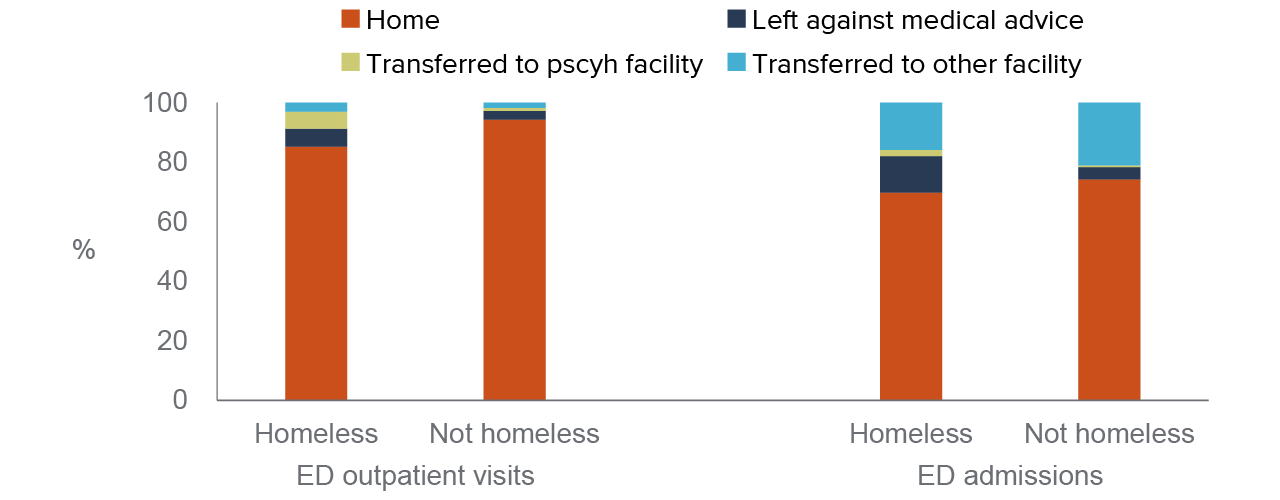
When people experiencing homelessness visit the ED, considerably more of these visits result in a transfer to psychiatric facilities (5% vs. 1%) and other health facilities (6% vs. 4%) compared to ED visits by other low-income patients. However, the discharge data indicate most homeless patients are discharged to home or self-care (Figure 12); this could mean they went to a hotel/motel, shelter, transitional housing—or back to the streets. The data does not provide any insights on this category.
Most ED visits by homeless patients are routine discharges to “home” or self-care
SOURCE: Authors’ analysis of HCAI hospital discharge data, 2019.
NOTE: Includes ED visits made by patients aged 18 to 64 that were expected to be paid for by Medi-Cal or the patient was recorded as uninsured.
In the hospital discharge data, the disposition information indicates where a person is being discharged after their ED visit or admission. This information does not capture other discharge planning services that staff—predominantly ED nursing staff—perform as the result of SB 1152. It also does not indicate whether staff may have connected a homeless patient to the Coordinated Entry System (CES) for their area in order to access local housing assistance.
Social workers we interviewed shared different experiences interacting with local homeless assistance agencies and their Coordinated Entry System. At one hospital, staff reported they were able interface with the local CES and enter homeless patients if they were not already in the system. This was a distinct contrast to a hospital in a different region, where social workers indicated they could not directly connect someone to local homeless assistance programs to “get on the waiting list” for available housing.
Analyzing hospital-level data collected to meet the requirements of SB 1152 could provide additional insights into these issues (Taira et al. 2022). Again, linking discharge data to administrative data sources like HMIS/HDIS data or Medi-Cal data could also provide a strategy to assess how often ED visits connect people to housing assistance, county mental health services—and in the future, the new benefits offered through CalAIM. Research studies focused on LA County suggest these types of individual-level data linkages are feasible. In addition, there is guidance available on how to facilitate cross-sector data sharing across health and social service agencies. This type of linked data could also support better research into SB 1152 and whether it is achieving its intent to better connect people experiencing homelessness to services.
About Half of Homeless Patients Visited the ED Often
By connecting visits over time to the same patient, we can look more closely at patterns and frequency of ED use at the patient level. Consistent with past research, ED patients ever identified as homeless often visit the ED multiple times over the course of a year. Nearly half of patients identified as homeless made four or more visits, while fewer than 10 percent of patients who were never recorded as homeless visited the ED frequently (Figure 13).
Nearly half of ED patients identified as homeless had four or more ED visits
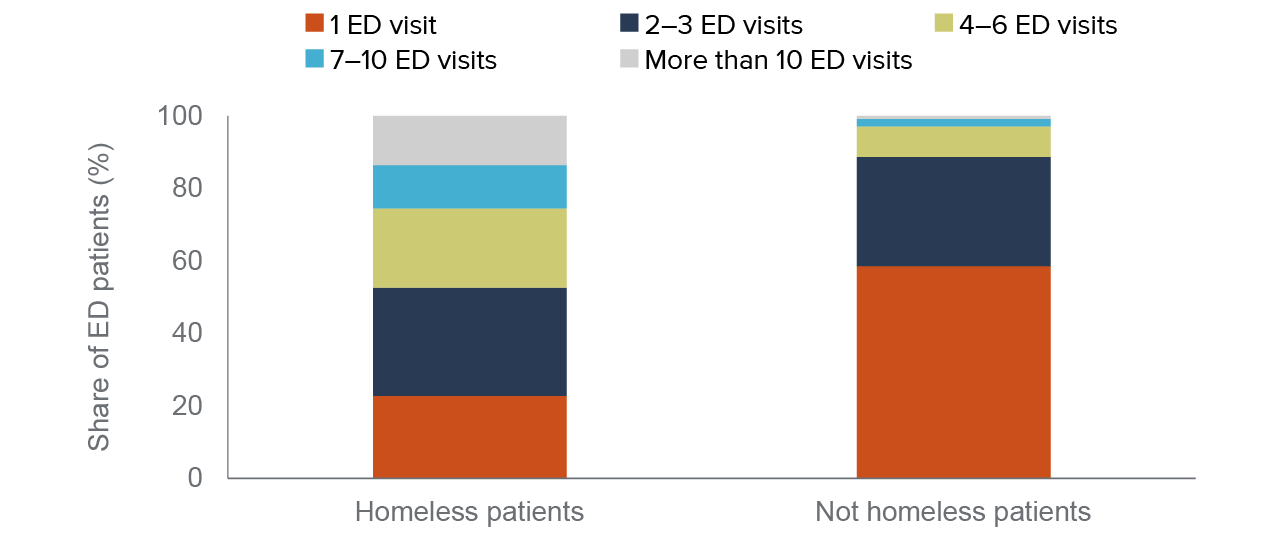
SOURCE: Authors’ analysis of HCAI hospital discharge data, 2019.
NOTES: Includes patients aged 18 to 64 who made at least one ED visit during calendar year 2019 and whose modal source of insurance coverage was either Medi-Cal or uninsured. About 115,000 patients who were identified as homeless during at least one visit are included. Visits with missing patient identifiers are not included (~10% of ED visits); patients identified as homeless have fewer visits with missing patient identifiers compared to non-homeless. See Technical Appendix B for additional information.
ED patients identified as homeless also have higher shares of hospital admission across the continuum of ED use. When we look at ED visits that result in an admission to the hospital overnight, we see that homeless patients have much higher shares even at relatively low levels of ED use. Nearly 25 percent of homeless patients who only have one ED visit in the year were admitted to the hospital compared to fewer than 10 percent among other low-income ED patients (Figure 14).
Higher rates of ED admissions likely reflect the greater morbidity and mortality among people experiencing homelessness, especially at younger ages, compared to people who are housed (Baggett et al. 2013; Montgomery et al. 2016; Roncarati et al. 2018; Brown et al. 2022). The higher share of admissions among homeless patients is in line with qualitative studies of hospital clinicians who indicated they were more prone to admit homeless patients (Doran et al. 2013). It is also consistent with information captured through our interviews, along with some of our own experiences as ED physicians at a large county hospital. A patient’s housing status can affect clinical decisions, including admission; but clinicians also consider a host of factors including patient needs, availability of and ease of access to outpatient services, clinician preference and risk tolerance, and hospital capacity.
ED patients identified as homeless have much higher shares of hospital admissions
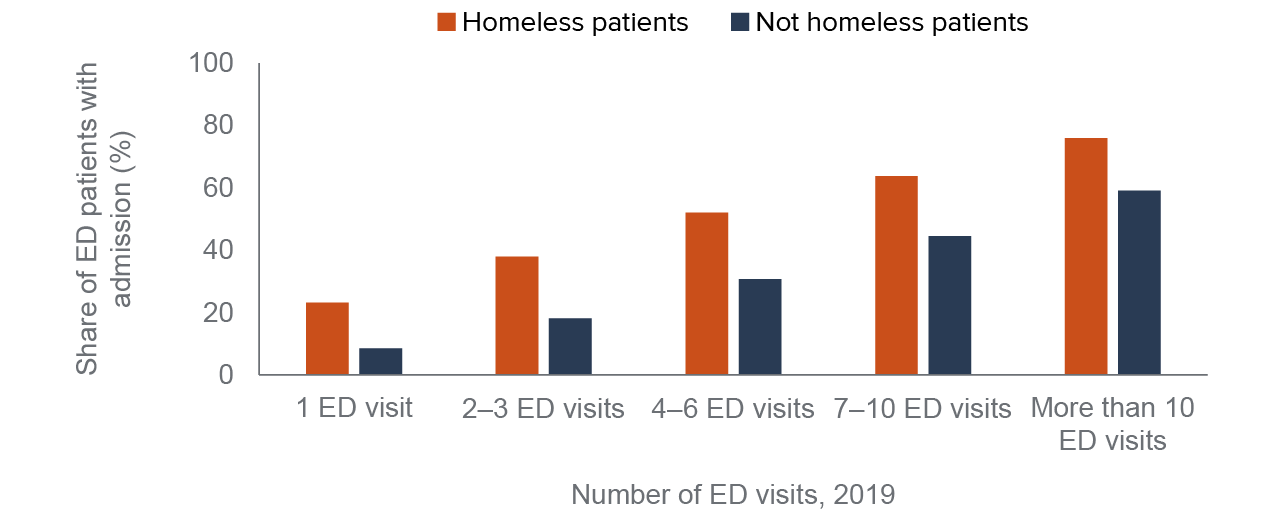
SOURCE: Authors’ analysis of HCAI hospital discharge data, 2019.
NOTES: Includes patients aged 18 to 64 who made at least one ED visits during calendar year 2019 and whose modal source of insurance coverage was either Medi-Cal or uninsured. Visits with missing patient identifiers are not included (~10% of ED visits); patients identified as homeless have fewer visits with missing patient identifiers compared to non-homeless. See Technical Appendix B for additional information.
These high ED admission rates underlie the impetus of investments in CalAIM and by health care systems to increase capacity in settings like respite care or sobering centers. As more of these lower-cost alternatives become available and/or more widely used, researchers can use the discharge data to examine how these programs may impact the number of homeless ED patients admitted to the hospital.
Conclusion and Recommendations
Hospital discharge data could provide timely statewide information on people experiencing homelessness who access care at emergency departments. This type of data is collected routinely, and it is well maintained and well documented, making it a widely used resource for researchers studying a wide range of health policy issues (Andrews 2015). Our examination of the HCAI discharge data suggests it captures a substantial number of California’s homeless population, making it a valuable resource—especially in combination with other data—for filling in informational gaps on the diverse needs of homeless Californians.
We estimate about 143,000 Californians who visited a hospital emergency department in 2019 were identified as homeless. Based on our interviews with staff, these are likely undercounts due to the challenges of screening people for homelessness in the ED, and should be viewed as lower-bound estimates of homeless patients served in California hospitals. While it is unlikely that patients are incorrectly reported as homeless (false positives), undoubtedly some patients—especially those who may be at imminent risk of homelessness or are newly homeless—are not identified and reported as such during their ED visit.
Even still, the discharge data show that hospital EDs provide a considerable amount of care for homeless Californians. In 2019, more than 400,000 ED visits were by patients identified as homeless. SB 1152 has brought more focus to documenting homeless patients in hospital EDs, but did not bring any additional resources or funding to hospitals. As more investments and policy attention focus on addressing the homelessness crisis, finding ways to support hospitals—and importantly, ED nursing and social work staff—to connect homeless patients with housing, case management, and behavioral health services should be a priority.
Patients recorded as homeless had higher medical and behavioral health needs, higher rates of inpatient hospitalizations, and more frequent ED use compared to other low-income adults who accessed ED care in 2019. These findings are related to who in the ED setting is likely to be identified as homeless, but are also consistent with other research showing people experiencing homelessness have high morbidity. Medi-Cal covered most of these patients, which underscores the importance of the new CalAIM initiative—a program that funds housing-related services, in-depth case management, and includes a targeted program for people experiencing homelessness.
Ultimately, we need better integration of social safety net and health system data to guide policy decisions targeting homelessness. While heavy investments from state funds and federal COVID relief aid have injected more money to address homelessness, we still know little about how effective these funding infusions were at reducing or preventing homelessness. A few recent studies have found positive effects of the Project Roomkey program for lowering ED use and other acute health care services by people experiencing homelessness, though these focus on a few select communities (Fleming et al. 2022).
Some counties have merged data from local housing assistance agencies with information from county agencies like specialty mental health services, county-operated hospital EDs, and local jails. Researchers at the California Policy Lab have analyzed these types of integrated data for Los Angeles County to develop predictive models aimed at preventing homelessness, examine racial disparities in outcomes like connections to permanent supporting housing, and evaluate local funding initiatives (von Wachter et al. 2019; von Wachter et al. 2020a, Milburn et al 2021.) Developing similar resources allowing for these types of analyses statewide and across different regions could assist state and local policymakers to develop more evidence-based policies and assess progress towards reducing homelessness.
Linking the newly available HDIS data with hospital discharge data could fill an important gap in our understanding of the people who connect with local homeless assistance programs and those who do not. Further links to other state administrative data—including Medi-Cal claims data, specialty mental health services, social services data like CalFresh or Supplemental Security Income (SSI)—would go a long way toward supporting research into interventions and funding for homelessness services. An evaluation planned for the Project Roomkey program could provide insights into how integrated state data can inform policy efforts.
Beyond administrative data, we need more input from people with lived experience of homelessness to learn more about their needs and how policies and programs can more effectively serve them. For example, a recent RAND study that surveyed people experiencing homelessness in three communities in Los Angeles offered crucial perspectives on why certain strategies may be more effective than others (Ward et al. 2022). More importantly, the California Statewide Survey of Homelessness, slated for completion at the end of this year, will offer the first representative sample of people experiencing homelessness in California and provide additional insights on effective policies.
As California steps up its funding and commitment to addressing homelessness and works to implement major policy changes, like the California Advancing and Innovating Medi-Cal (CalAIM) initiative, reliable statewide data will be critical for monitoring progress and measuring outcomes.
Topics
Health & Safety Net Housing Population Poverty & InequalityLearn More
A Snapshot of Homeless Californians in Shelters
Californians See a Rise in Homelessness in Their Communities

Homeless Populations Are Rising around California
Mounting Concerns about Safety Net Hospital Closures

Video: How Hospital Discharge Data Can Inform State Homelessness Policy

What Lessons Can Be Learned from Project Roomkey?
