

Summary
Food and nutrition assistance programs help children gain access to adequate amounts of nutritious food-reducing child hunger and food insecurity as well as promoting healthy development. Yet in California, enrollment varies widely across counties and across the main nutrition programs that serve children: CalFresh, popularly known as food stamps; the WIC program, which serves infants and preschool-age children; and school meals, which include lunch and often other meals. Increasing children’s enrollment in CalFresh and achieving healthier outcomes for Californians are priorities for the state. The governor’s January 2016 budget set a goal of enrolling 400,000 more eligible children in CalFresh over two years.
This report assesses children’s eligibility for CalFresh and eligible children’s participation in the three main nutrition programs to explore opportunities for improving enrollment and the benefits of higher enrollment. Key findings include:
- CalFresh has lower enrollment than free school meals and WIC. In 2015, 24 percent of all California children participated in CalFresh, while more than twice as many age-eligible children (51%) were enrolled in free school meals; 44 percent of infants and 34 percent of young children were enrolled in WIC.
- There is substantial potential to expand the impact of nutrition programs. We estimate that if all CalFresh-eligible children were fully enrolled in both CalFresh and either free school meals or WIC, these programs would reach 1.6 million more children.
- Infants and young children are better connected to nutrition programs. Among CalFresh-eligible children, we find that 12 percent of public school students participate in neither CalFresh nor free school meals-more than a quarter million school children (331,000). In contrast, only 4 percent of infants (21,000) and 9 percent of young children (87,000) are disconnected from both CalFresh and WIC.
- Higher participation in nutrition programs would lower child poverty. Among public school students living in poverty, we project that full participation in nutrition programs would increase family resources by 15 percent. Among infants and young children living in poverty, we project that family resources would increase by 9 percent following full participation in nutrition programs.
To some extent, lower CalFresh enrollment reflects more restrictive eligibility requirements. However, there is good reason to believe that more children participating in free school meals and WIC could be connected to CalFresh. Currently, most policies designed to integrate nutrition programs run from CalFresh to school meals. Building robust, two-way connections could help counties and the state better achieve the goals of these programs so more children have access to adequate, nutritious food.
Introduction
Ensuring children have consistent access to adequate, nutritious food is a prominent and longstanding goal of social safety net policy. In California and nationally, the largest food and nutrition assistance programs are CalFresh (known federally as the Supplemental Nutrition Assistance Program, or SNAP, and popularly known as food stamps); the Special Supplemental Nutrition Program for Women, Infants, and Children (WIC); and the National School Lunch Program (NSLP). Together, these three programs make up the vast majority of public spending on food assistance-adding $9.7 billion to Californians’ family resources in 2015.1
These nutrition programs aim to mitigate the adverse consequences of food insecurity and outright hunger among children.2 In 2014, an estimated 20.9 percent of children nationally lived in households that experienced food insecurity over the course of the year (Coleman-Jensen et al. 2015). Inadequate nutrition is far more common than outright hunger. In a recent national study, school-aged children scored only 58 out of 100 in meeting recommended dietary guidelines, and younger children scored 63 out of 100 (Condon et al. 2015a, 2015b, 2015c). Poor nutrition contributes to chronic disease later in life (Dietz et al. 2016).
Because nutrition programs provide benefits-in the form of debit cards, vouchers, or meals-to help families meet their basic needs, they also have the potential to reduce poverty. Currently, the statewide child poverty rate would be 4.5 points higher if not for CalFresh, 1.3 points higher if not for school meals, and 0.6 points higher if not for WIC (Bohn, Danielson, and Bandy 2015).3 These programs also make up a sizeable share of family budgets.4 They provide on average 20 percent of all resources among children whose families live in poverty and 37 percent of resources for children living in deep poverty.5
If more children in California participated in the nutrition programs for which they are eligible, family resources would grow even more. Improving children’s enrollment in CalFresh is a priority for the state. The governor’s January 2016 budget seeks to increase the state’s CalFresh participation rate-among the lowest in the nation-and to achieve healthier outcomes for Californians by setting a two-year target of enrolling an additional 400,000 eligible children in the program.6
State and local efforts to coordinate enrollment across nutrition programs are ongoing, but there are challenges. The programs are overseen by different state departments and administered by different local entities that do not typically share personnel or data systems. Coordinating information is not straightforward. Previous PPIC reports have examined systematic variation across school districts in free and reduced-price meal participation and factors that may drive county differences in children’s enrollment in CalFresh and Medi-Cal (Beck, Danielson, and McConville 2015; Danielson 2015). This report builds on previous research through a more detailed assessment of the extent to which CalFresh-eligible children are connected to WIC and free school meals.7
In the remainder of this report, we assess the extent to which children who are eligible for CalFresh are enrolled in any nutrition program and the extent to which they are fully enrolled in all nutrition programs for which they are eligible. To do this, we rely on comprehensive estimates of safety net program participation and overlap embedded in the California Poverty Measure research, a joint effort between PPIC and the Stanford Center on Poverty and Inequality. This research uses self-reported income and program participation information in major US Census Bureau population surveys, in tandem with administrative records on caseloads and budgets for major safety net programs in California, to better understand the economic well-being of Californians. To date, these data have been used to refine estimates of poverty and income inequality (Bohn et al. 2013, Bohn and Danielson 2016). We now turn to a more explicit evaluation of program overlap. These estimates shed light on the possibility of increasing participation by improving the integration of nutrition programs that serve children. We also estimate how much family resources would increase-and poverty levels decrease-if children were fully enrolled.
Program Background and Integration
While the three main nutrition programs share broad goals, have common funding sources, and impose-broadly speaking’similar income eligibility rules, they differ substantially in points of entry and delivery of benefits (Table 1).8 This variation can create challenges for program integration and full participation.
All programs are overseen by the federal Food and Nutrition Services (FNS) of the US Department of Agriculture, but state oversight is split across three agencies: the California Department of Social Services (CDSS), the California Department of Education (CDE), and the California Department of Public Health (CDPH). Families access the programs through county welfare offices, schools, and local WIC offices (often housed in public health agencies). Benefits also come in many forms: ATM-like Electronic Benefit Transfer (EBT) cards for CalFresh, meals for school nutrition programs, and physical vouchers that can be redeemed at participating grocery stores for WIC.9
Table 1. Nutrition programs share key goals and funding sources, but vary in oversight and implementation
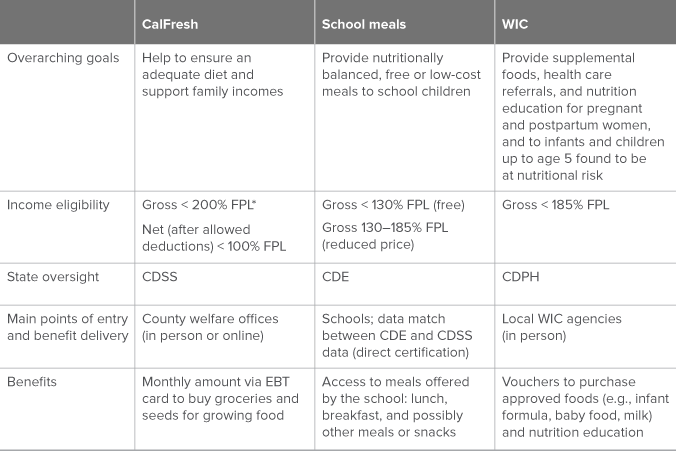
SOURCES: Food and Nutrition Service, US Department of Agriculture. *As of July 2016.
NOTES: All students in participating schools are eligible for school meals. In fact, California law requires all public schools to offer at least one nutritionally adequate meal to students during each school day. For students with family incomes at or above 185 percent of the federal poverty level (FPL), meals are available at “full price” (which includes a small federal subsidy).
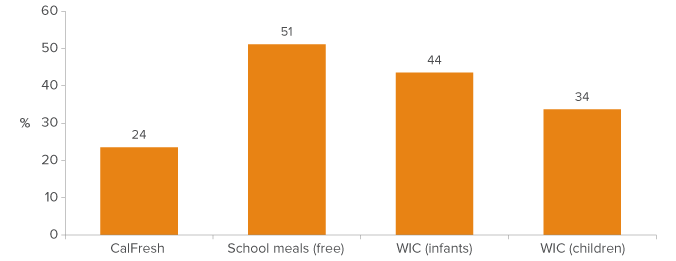
The differences in structure and implementation suggest that even though the programs have roughly similar populations of eligible children, they may in practice reach considerably different subsets of children and families. Indeed, more children participate in free school meals and WIC than CalFresh. In 2015, 24 percent of California children age 0-17 participated in CalFresh. In contrast, more than twice as many school-aged children (51%) were enrolled in free school meals, and 44 percent of infants and 34 percent of young children were enrolled in WIC (Figure 1).10
Of course, eligibility differs across the three programs, and requirements are more complex-and potentially more restrictive-for CalFresh than for the other two programs. For example, CalFresh requires that applicants meet both a gross income test (200% of federal poverty level, or FPL) and a net income test (100% FPL). Additionally, at this point in time, CalFresh participation makes a child fully eligible for free school meals, but the reverse is not the case.11 CalFresh participation also serves as proof of income eligibility for those applying for WIC (but again, the reverse is not true). Still, given the sharply lower enrollment in CalFresh compared with the other two programs, there is reason to think that substantial numbers of children who participate in WIC and free school meals, but not CalFresh, are in fact eligible for CalFresh.
Figure 1. Higher shares of California children participate in WIC and free school meals compared to CalFresh
SOURCE: California Department of Social Services; California Department of Education; California Department of Public Health; California Department of Finance.
NOTE: Estimates refer to 2015. Numerators are average monthly caseloads in the case of CalFresh and WIC and free meal eligible children determined in October 2015. Denominators are children 0-17 in the case of CalFresh; children age 5-17 in the case of school meals; children under age 1 in the case of WIC (infants); and children age 1-4 in the case of WIC (children). Children determined eligible for free school meals include those enrolled in high-poverty schools or school districts in which all students are deemed eligible for free meals.
National trends in WIC and SNAP (called CalFresh in California) caseloads also suggest that children are not as well connected to nutrition programs as they could be. SNAP participation rose rapidly during and after the Great Recession, which officially began in late 2007 and continued through mid-2009.12 The share of young children who benefited from SNAP doubled from about 20 percent in the early and mid-2000s to 40 percent in 2011 through 2014. Although WIC participation also increased over much the same period, the change was far more modest.13 In addition, WIC participation remained higher than SNAP participation among infants and young children throughout the entire period.
Both of these observations-greater variability in SNAP enrollment compared to WIC enrollment and higher WIC participation compared to SNAP’suggest that children are not consistently enrolled in all programs for which they are eligible. Building robust, two-way connections between the three major nutrition programs could contribute to reaching additional children. As we will demonstrate below, reaching children who are entirely disconnected from nutrition programs is also important, particularly for public school students.
Arguably, the greatest room for improvement lies in increasing CalFresh participation.14 Although about one-quarter of California’s children participate in CalFresh, we estimate that roughly half of children statewide are likely to be eligible for CalFresh. Figure 2 maps the wide variation in CalFresh eligibility across the state. Across counties, we estimate that between 23 percent (Marin County) and 66 percent (Tulare County) of children are eligible for CalFresh.15 This broad range is one reason why counties may face different challenges in reaching eligible children.
Figure 2. Across counties, about a quarter to two-thirds of children are eligible for CalFresh
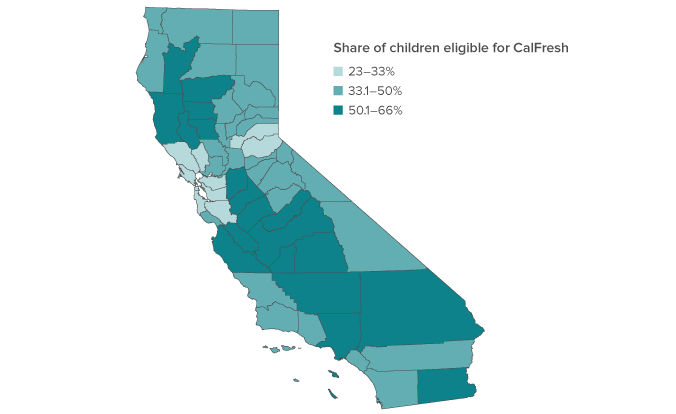
SOURCE: Author calculations from the 2012-2014 California Poverty Measure.
NOTE: Included are children age 0-5 and public school students age 5-19.
In the remainder of this report, we focus on the 21 counties with the largest eligible populations for one or more of the three nutrition programs over the period 2012-2014.16 Together, these counties make up 90 percent of the eligible child population. Technical Appendix B provides estimates for the remaining 37 counties that together comprise the remaining 10 percent.17 We also provide estimates for the five school districts with the largest student populations in the state: Elk Grove Unified School District (USD), Fresno USD, Los Angeles USD, Long Beach USD, and San Diego USD. According to enrollment data from the California Department of Education, these five school districts enroll about 16 percent of the state’s 6.2 million public K-12 students.18
CalFresh and Free School Meals
Overall, a solid majority of eligible children are both enrolled in CalFresh and participate in free school meals. However, notable shares of CalFresh-eligible students participate only in free meals or are disconnected from both programs. In many counties, outreach efforts to draw school children into nutrition programs are likely to be as important as outreach to engage students who are participating in free school meals (but not CalFresh) into CalFresh.
Figure 3 indicates that nearly two-thirds (65%) of public-school-aged children in California whom we estimate to be eligible for CalFresh are participating in both CalFresh and free school meals-a total of 1.84 million school children. Of the remaining 35 percent, sizeable shares are enrolled in free meals but not participating in CalFresh (21% or 608,000 children), or are disconnected from both programs (12% or 331,000 children). Few are participating in CalFresh but not school meals (2% or 48,000 children).
Figure 3. Many CalFresh-eligible children participate in school meals but not CalFresh, or are in neither program
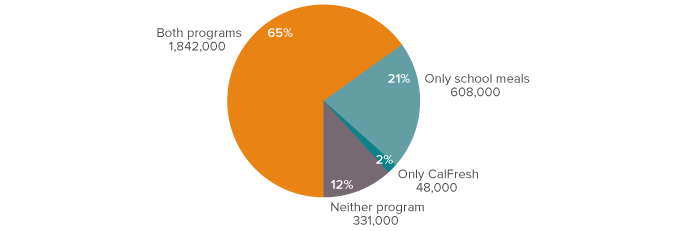
SOURCE: Author calculations from the 2012-2014 California Poverty Measure.
NOTES: Estimates show shares of CalFresh-eligible public school students participating in CalFresh and/or free school meals. Public school students include children between the ages of 5 and 19 enrolled in a public school in the past three months. Estimate of CalFresh eligibility is the mid-range estimate shown in Figure 3 and presented in Table B1 in the technical appendix. Total CalFresh-eligible public school children estimated to be 2.82 million.
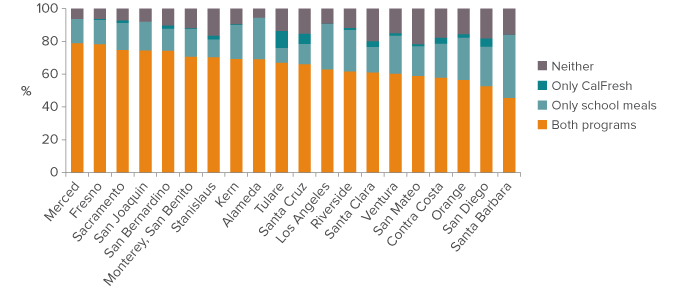
Across the largest counties in the state, shares of CalFresh-eligible public school children who actually participate in both CalFresh and free meals vary widely, from 46 percent in Santa Barbara County to 79 percent in Merced County (Figure 4). Between 5 percent (Alameda) and 22 percent (San Mateo) of CalFresh-eligible public school students participate in neither program. The remainder are enrolled in one of the two programs-typically school meals.19
Figure 4. Merced County has the highest enrollment in both CalFresh and school meals, while Santa Barbara has the lowest
SOURCE: Author calculations from the 2012-2014 California Poverty Measure.
NOTES: Counties shown from highest to lowest participation in both CalFresh and school meals. Estimates show shares of CalFresh-eligible public school students participating in CalFresh and/or free school meals. Estimate of CalFresh eligibility is the mid-range estimate shown in Figure 3 and presented in Table B1 in the technical appendix.
Across the five largest school districts, Fresno USD has the highest rate of participation in both CalFresh and free school meals (82%) as well as the lowest rate of disconnection from both programs (2%). San Diego USD (54% in both and 17% disconnected) fares the worst, and participation across Los Angeles USD mirrors the statewide average (66% in both and 7% disconnected). This suggests that rates of participation and disconnection in school meals but not CalFresh are matters of concern for both the state as a whole and certain large school districts.
CalFresh and WIC
Overall, infants and young (preschool-age) children are better connected to nutrition programs than public school students. A much smaller share of infants and young children who are eligible for CalFresh are disconnected from both WIC and CalFresh than is the case for public school students. Comparing infants and young children, infants are more likely to participate in both programs. At the same time, this statewide picture does not hold true in all counties. The wide variation in participation patterns across California’s counties suggests that attention to local needs is important for enrolling additional infants and young children in one or both nutrition programs.
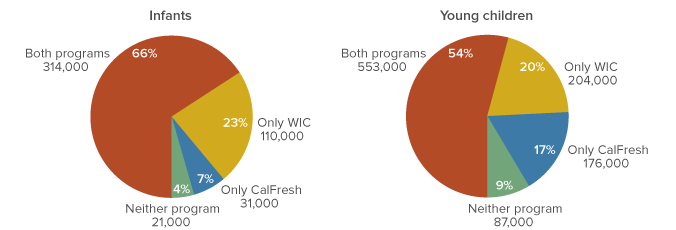
As is the case for public school students, the majority of young children who are eligible for CalFresh are participating in both WIC and CalFresh: an estimated 66 percent of infants and 54 percent of young children (Figure 5).20 However, in contrast to public school students, smaller shares of infants and young children are disconnected from both programs (4% of infants and 9% of young children).
Among infants, the majority of the remainder are participating in WIC but not CalFresh (23%, or 110,000 infants). Only 7 percent of CalFresh-eligible infants are participating in CalFresh but not WIC (31,000 infants). Among young children, the shares participating in only one program are fairly similar (20% in only WIC and 17% in only CalFresh). This represents 204,000 children benefiting from WIC who could also be enrolled in CalFresh, and 176,000 children participating in CalFresh who could also be connected to WIC.
Figure 5. Rates of disconnection are relatively low among infants and young children
SOURCE: Author calculations from the 2012-2014 California Poverty Measure.
NOTES: Estimates show shares of CalFresh-eligible children age 0-1 (infants) and age 2-5 (young children) participating in CalFresh and/or WIC. Absence of information about precise birth date restricts the precision of the age range used. Estimate of CalFresh eligibility is the mid-range estimate shown in Figure 3 and presented in Table B1 in the technical appendix. Total CalFresh-eligible infants and young children estimated to be 1.50 million.
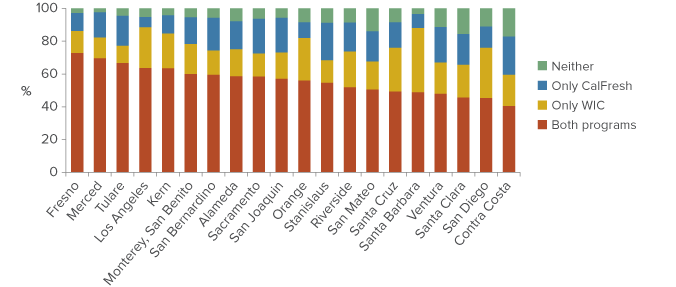
Across the largest counties, shares of CalFresh-eligible infants and young children who participate in both CalFresh and WIC vary from 41 percent (Contra Costa) to 73 percent (Fresno). Between 2 percent (Merced) and 17 percent (Contra Costa) of CalFresh-eligible infants and young children do not participate in either program (Figure 6).
There is little consistency across counties in the pattern of enrollment in only WIC and only CalFresh among the remainder of CalFresh-eligible infants and young children. In certain counties, WIC dominates. For example, in Orange County, about 24,000 CalFresh-eligible infants and young children are enrolled in WIC alone, while only about 9,000 are enrolled in CalFresh alone. In other counties, like Sacramento, more eligible infants and young children are enrolled only in CalFresh than only in WIC (12,000 vs. 8,000). In still a third group of counties, roughly similar numbers of CalFresh-eligible infants and young children are enrolled in a single program (e.g., Alameda).21
Figure 6. Fresno County has the highest participation in both CalFresh and WIC, while Contra Costa County has lowest
SOURCE: Author calculations from the 2012-2014 California Poverty Measure.
NOTE: Counties ordered from highest to lowest participation in both CalFresh and WIC. Estimates show shares of CalFresh-eligible children age 0-5 participating in CalFresh and/or WIC. Absence of information about precise birth date restricts the precision of the age range used. Estimate of CalFresh eligibility is the mid-range estimate shown in Figure 3 and presented in Table B1 in the technical appendix.
Poverty and Child Nutrition Programs
We noted at the outset that nutrition programs make up a substantial share of family resources for those living in poverty; these programs also mitigate child poverty. Reducing economic need thus represents one benefit of higher participation in nutrition programs. Here, we assess the extent to which family resources would increase-and child poverty decrease-if all eligible children fully participated in both CalFresh and WIC or both CalFresh and free school meals.22
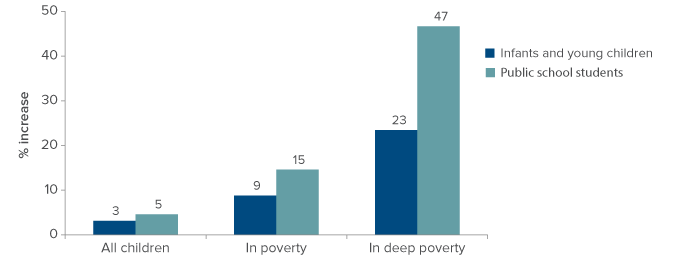
Figure 7 shows percent increases in family resources among infants and young children age 0-5 (for WIC) and public school students (for free school meals). We find notable increases in resources for children living in poverty and substantial increases among those with severe economic need. If all eligible infants and young children participated in both WIC and CalFresh, the overall average increase in family resources would be 3 percent. We project the increase in family resources to be 9 percent for those living in poverty, and 23 percent for those living in deep poverty (below half of the poverty threshold). Among public school students eligible for CalFresh and free school meals, the changes resulting from full participation would be even larger: a 5 percent increase on average for all children, but a 15 percent increase among those living in poverty and a 47 percent increase among those living in deep poverty.23
The estimates for children in deep poverty are quite large because family resources are extremely low for this group. Accordingly, the cash-equivalent annual amounts from any one of these programs-which we estimate to range on average from about $700 for WIC to $1,000 for free school meals to $4,100 for CalFresh-can make a notable impact. Note that while nearly one in four California children live in poverty, only about one in twenty children live in deep poverty (Bohn, Danielson, and Bandy 2015).
Figure 7. Full participation in nutrition programs would increase family resources, especially among those in poverty
SOURCE: Author calculations from the 2012-2014 California Poverty Measure.
NOTE: Scenario shown assumes that all California children participate in all nutrition programs for which they are eligible. Resource calculation includes cash income and safety net programs, but does not subtract medical and work expenses. Estimates exclude families with no, or negative, reported resources. Children living in such families make up only 2 percent of children living in deep poverty.
We estimate the additional resources that families would see if eligible children were fully enrolled in CalFresh, WIC, and school meals would total roughly $3.5 billion statewide. Of this total, 71 percent of these resources would come from CalFresh, 22 percent from school meals, and 7 percent from WIC. Increased resources imply that some families would move above the poverty line. Specifically, we estimate that child poverty rates would drop by 4.5 percentage points for infants and young children and by 4.2 percentage points for public school students.24
Clearly, alleviating economic need is only one goal of nutrition programs. We lack sufficient evidence to determine whether other outcomes-for instance, children’s well-being and future academic success-would be improved by incremental changes leading to full or substantially increased participation. However, available rigorous research examining dramatic changes in programs or eligibility (for example, during the Great Recession) indicate positive effects.25 For instance, research on the introduction of the Food Stamp Program (later renamed SNAP) in the early 1970s provides evidence of positive health outcomes and increased economic self-sufficiency (Hoynes, Schanzenbach, and Almond 2016). Additional evidence suggests that increased SNAP benefits from the severe economic downturn of the Great Recession helped families avoid food insecurity, that is, concerns about insufficient food or actual lack of sufficient food (Nord and Prell 2011). Finally, there is also a case to be made that maximizing enrollment among those eligible simply promotes equitable access to programs that have statewide and national eligibility criteria.
Most Policies to Integrate Nutrition Programs Start with CalFresh
Although the differences in program enrollment, funding, and eligibility present obvious challenges for integration (see Table 1), the overarching program goals-ensure adequate and nutritious food for children-provide ready motivation to align the programs as closely as possible. We find that if all CalFresh-eligible children were fully enrolled in both CalFresh and free school meals or both CalFresh and WIC, these nutrition programs would reach an additional 1.6 million children. Of these children, 439,000 would benefit from nutrition programs where they had been disconnected before. The remaining 1.2 million would be enrolled in both programs for which they are eligible rather than one alone. We also find suggestive evidence that counties with more eligible children have relatively higher rates of enrollment in multiple nutrition programs and lower rates of disconnection from all nutrition programs.26 This is encouraging, although there is room for improvement in most parts of the state.
While outreach and enrollment for CalFresh, WIC, and school nutrition programs are conducted at the local level in California, the three programs share federal funding and strong federal oversight. Thus, not surprisingly, the strongest links across programs are the result of federal mandates.
There are longstanding and recent efforts to integrate CalFresh with school nutrition programs. When parents fill out application forms for school meals, they have long been asked whether anyone in the family receives benefits from CalFresh, CalWORKs (California’s cash assistance program for families with children), or a food program for Native American tribal groups (FDPIR). If so, the child is automatically eligible for free school meals (known as “categorical eligibility”). Direct certification is a more recent effort to match students using CalFresh and CalWORKs enrollment records kept by the state or counties. Students matched in this way are sent notifications of their enrollment in free school meals. Direct certification supplants the application process, helping to connect children on CalFresh with school nutrition programs.27 Both categorical eligibility and direct certification are federally required. In 2011, California lawmakers enacted legislation that allows (but does not mandate) school districts to establish a process for sharing free meal applications with county welfare offices, conditional on parental consent. This law, Assembly Bill 402, offers a way for students’ families to be identified as potentially eligible for CalFresh when students are not directly certified.28
Links between CalFresh and WIC, which stem from federal law and regulation, are less extensive. WIC applicants who can provide proof of their CalFresh enrollment are considered income eligible, though other eligibility determinations-age of child, nutritional risk-must still be made. Additionally, WIC participants not already enrolled in CalFresh may receive a referral to CalFresh, since a longstanding goal of the WIC program is to connect participants to other resources that promote health and nutrition.
There are also opportunities to integrate enrollment in nutrition programs with other safety net programs. In June 2016, the state received the federal go-ahead to implement a statewide pilot program that will use information from Medi-Cal enrollment records to directly certify school children for free and reduced-price school meals. This initiative promises to improve enrollment in nutrition programs among school children.29 Other emerging initiatives could help to integrate the programs by unifying delivery mechanisms. These include proposals to provide an amount on CalFresh EBT cards to replace summer meals when school is out of session and to transition WIC from paper vouchers to electronic cards by October 2020 (though this system will be different from CalFresh EBT).30
Finally, there is potential to strengthen links across WIC and school nutrition programs. The 2016 US Senate proposal to reauthorize the federal Child Nutrition Act includes a proposal that would extend WIC eligibility to five-year-olds who are not yet enrolled in kindergarten, which could help prevent gaps in enrollment. In addition, to the extent that local WIC agencies can share records with school districts to facilitate districts’ identification of students as eligible for free or reduced-price meals, more incoming students could be connected early on to school nutrition programs.
Conclusion
Many California children already benefit from food and nutrition assistance programs to improve nutrition and mitigate food insecurity. However, enrollment in uneven across the three main nutrition programs, with lower participation in CalFresh compared to WIC and free school meals. We estimate that approximately 422,000 young children who are eligible for CalFresh are not participating (although nearly three-quarters of these children are participating in WIC), and 939,000 public school children eligible for CalFresh are not participating (although about two-thirds of these children are receiving free school meals). Altogether, we find that full enrollment of CalFresh-eligible children in CalFresh, free school meals, and WIC would allow these nutrition programs to better serve an additional 1.6 million children.
To some extent, lower CalFresh enrollment is due to the program’s more restrictive eligibility requirements. Another important consideration is whether children are disconnected from programs because they are never enrolled or because they move in and out of programs over time. A more detailed assessment of enrollment trajectories over time using records linked across settings would provide important insights into this and related questions. Nonetheless, there is good reason to believe that additional children could be connected to CalFresh through their participation in WIC or free school meals.
The three programs share key goals and strong federal oversight; however, each has distinctive characteristics that present challenges to further integration. CalFresh and school meals are structurally better integrated than CalFresh and WIC. However, currently the primary direction of integration is from CalFresh to school meals, not vice versa. Because roughly one in five eligible public school students participate in school meals but not CalFresh, and one in five eligible young children participate in WIC but not CalFresh, further efforts to integrate the programs from the opposite direction seem warranted.
Establishing data exchanges across county human services, public health, or school district offices is likely the best way to connect children across these programs. Closer integration with CalFresh via Medi-Cal enrollment is also promising, particularly for WIC. The Medi-Cal direct certification pilot for school meals is a reminder that boosting enrollment in nutrition programs can start from outside of those programs. Still, school districts and public health departments have programmatic reasons to try and strengthen connections with CalFresh as a means of more fully achieving the nutrition goals of their programs. Although not a focus of this report, data exchanges between local WIC offices and school districts could further help ensure that low-income children are seamlessly connected to school nutrition programs when they first enroll.
Given the wide variation in eligibility and participation across the state, counties should consider conducting local assessments of the most effective strategies for reaching additional children. In some cases, counties might focus more on school children participating in school meals than on young children receiving WIC (or vice versa). In other cases, it may make the most sense to tackle disconnection from all nutrition programs.
One of the primary goals of the social safety net is to ensure that all children have access to adequate, nutritious food. Developing more robust connections across nutrition programs-particularly from school meals and WIC to CalFresh-can help counties and the state get closer to attaining this goal.
Topics
Health & Safety Net Population