Highlights
- California’s 2020 census count was highly accurate. Recent estimates from the United States Census Bureau suggest that California did not under- or overcount its general population.
- Accuracy for California’s hard-to-count populations—including Black and Latino residents—is high and better than almost every other state. However, some groups – specifically Asian and white Californians—were overcounted.
- California’s spending on supporting the census was comparatively high, at $4.75 per capita. But it may have saved the state from a significant undercount given the disproportionately high hard-to-count populations.
California Invested Heavily in Census Efforts
Every 10 years, the Census Bureau strives to count the entire US population. This critical activity—mandated in the text of the Constitution itself—provides the basis for our system of political representation and supplies much of the information necessary to administer and fund a range of government programs. It also shapes how we understand ourselves and our communities for the ensuing decade. The most recent count in 2020 showed that California’s population growth had slowed to a crawl, and the state lost a congressional district for the first time in its history.
No census is perfect, but past censuses have been especially likely to miss certain communities—including children, African Americans, and Latinos. About seven in 10 Californians belong to one or more “hard to count” (HTC) groups, making California more vulnerable than most states to an undercount (Bohn et al. 2019). This most recent census was conducted during the worst of the COVID pandemic, further raising the risk of inaccuracies. The consequences of a poor census count can be severe: losses in political power and reductions in critical federal funding.
To minimize error, California invested $187 million in “get out the count” (GOTC) efforts: far more in raw dollars than any other state and among the highest in per capita terms. The efforts included a public messaging campaign, real-time information about the status of the count, and concerted planning and coordination with community groups and trusted messengers throughout the state. Some of this work had to be scrapped or revised in response to the pandemic, but a large portion had already been completed by the time the pandemic started.
Given the amount of money and effort put into getting out the count, it is important to understand the degree to which California did, in fact, avoid a bad count. Results from the Census Bureau’s recent evaluation provides a first look at California’s performance.
California’s Overall Count Was Strong
The census faces two potential problems: an overcount or an undercount, relative to a hypothetically perfect census. An undercount occurs when people are missed entirely, while an overcount occurs when some people are counted more than once (for example, if they live at more than one address).
California’s 2020 count was quite accurate, just 0.47% higher than it would have been if everyone had been counted correctly (Hill et al. 2022). This estimate is not statistically different from zero, meaning it is not possible to confidently say there was any over- or undercount in California at all.
This outcome ranks California 12th among all states in closeness to a perfect count, slightly off the national undercount of -0.24% (Figure 1). This is an excellent result and certainly the best that ought to be expected for this overall number. In comparison, many states in the South and mountain West had significant undercounts, while a number of New England states had significant overcounts. Notably, New York had a major overcount, avoiding an expected congressional seat loss, while Florida and Texas had major undercounts and missed out on expected seat gains.
California’s count was accurate overall and fell in the middle of all states
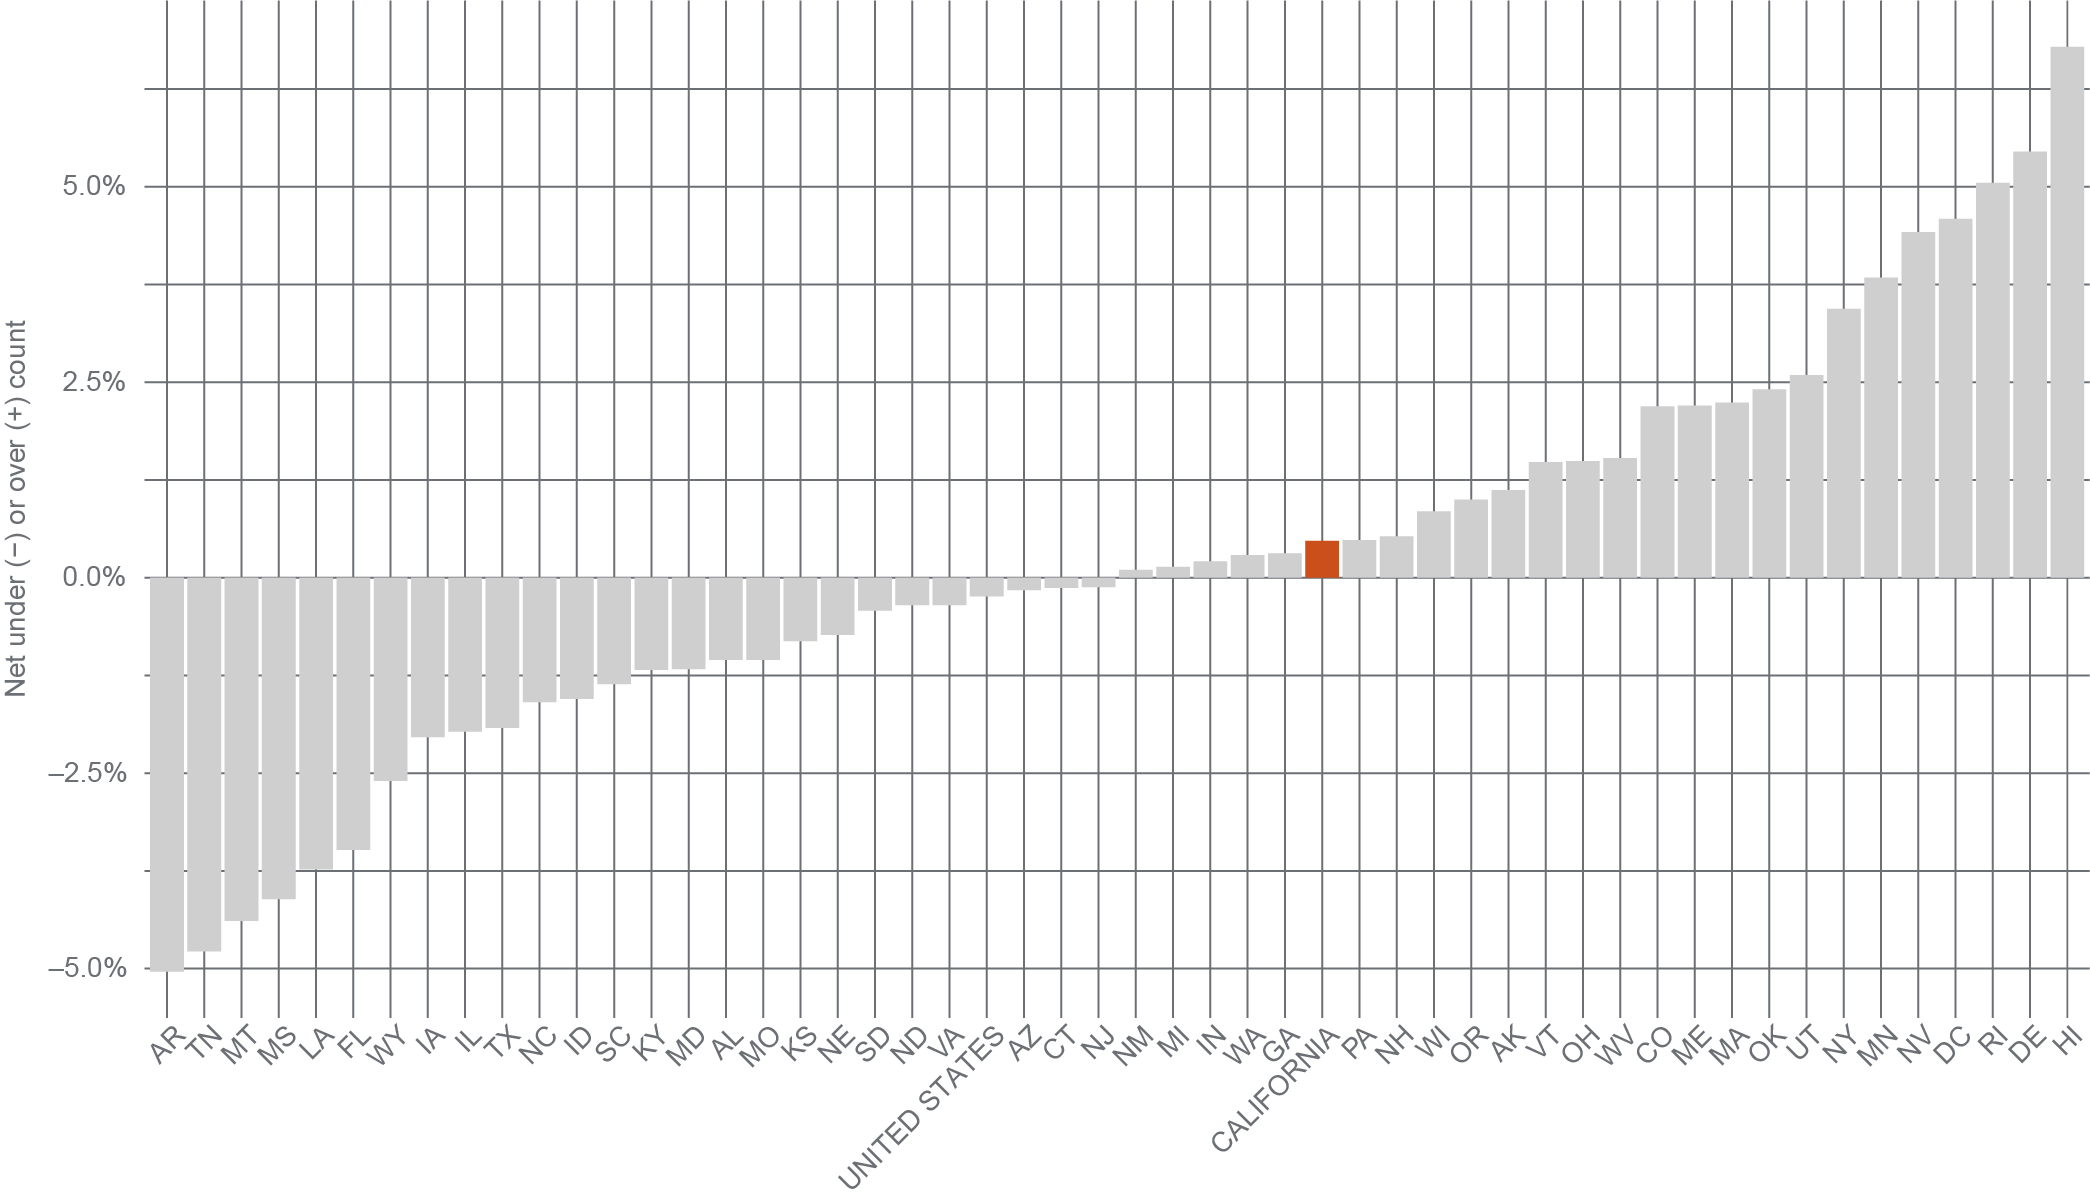
SOURCE: Hill et al. (2022).
NOTES: Values indicate the percentage deviation between the original census count and the estimate from the Post-Enumeration Survey. Positive values are overcounts and negative values are undercounts. The states are organized by the deviation, with the largest net undercounts on the far left and the largest net overcounts on the far right.
However, California spent a great deal more money than the other states that achieved accurate counts. California spent $4.75 per capita, compared to an average of $0.55 per capita in the other states with similar results. So at first blush it might seem that California received little return from its heavy GOTC investment.
Results for Many Hard-to-Count Communities Were Also Successful
Simple comparisons between California and other states do not take into account California’s disproportionately hard-to-count population—and California’s extra effort may have saved the state from a significant undercount. The Census Bureau has not released state-level estimates of count quality for HTC populations, but current data allows us to estimate count quality for several hard-to-count groups: Latinos, African Americans, and children (see Technical Appendix for more detail).
California’s count of Latinos, African Americans, and children was better than in most other states
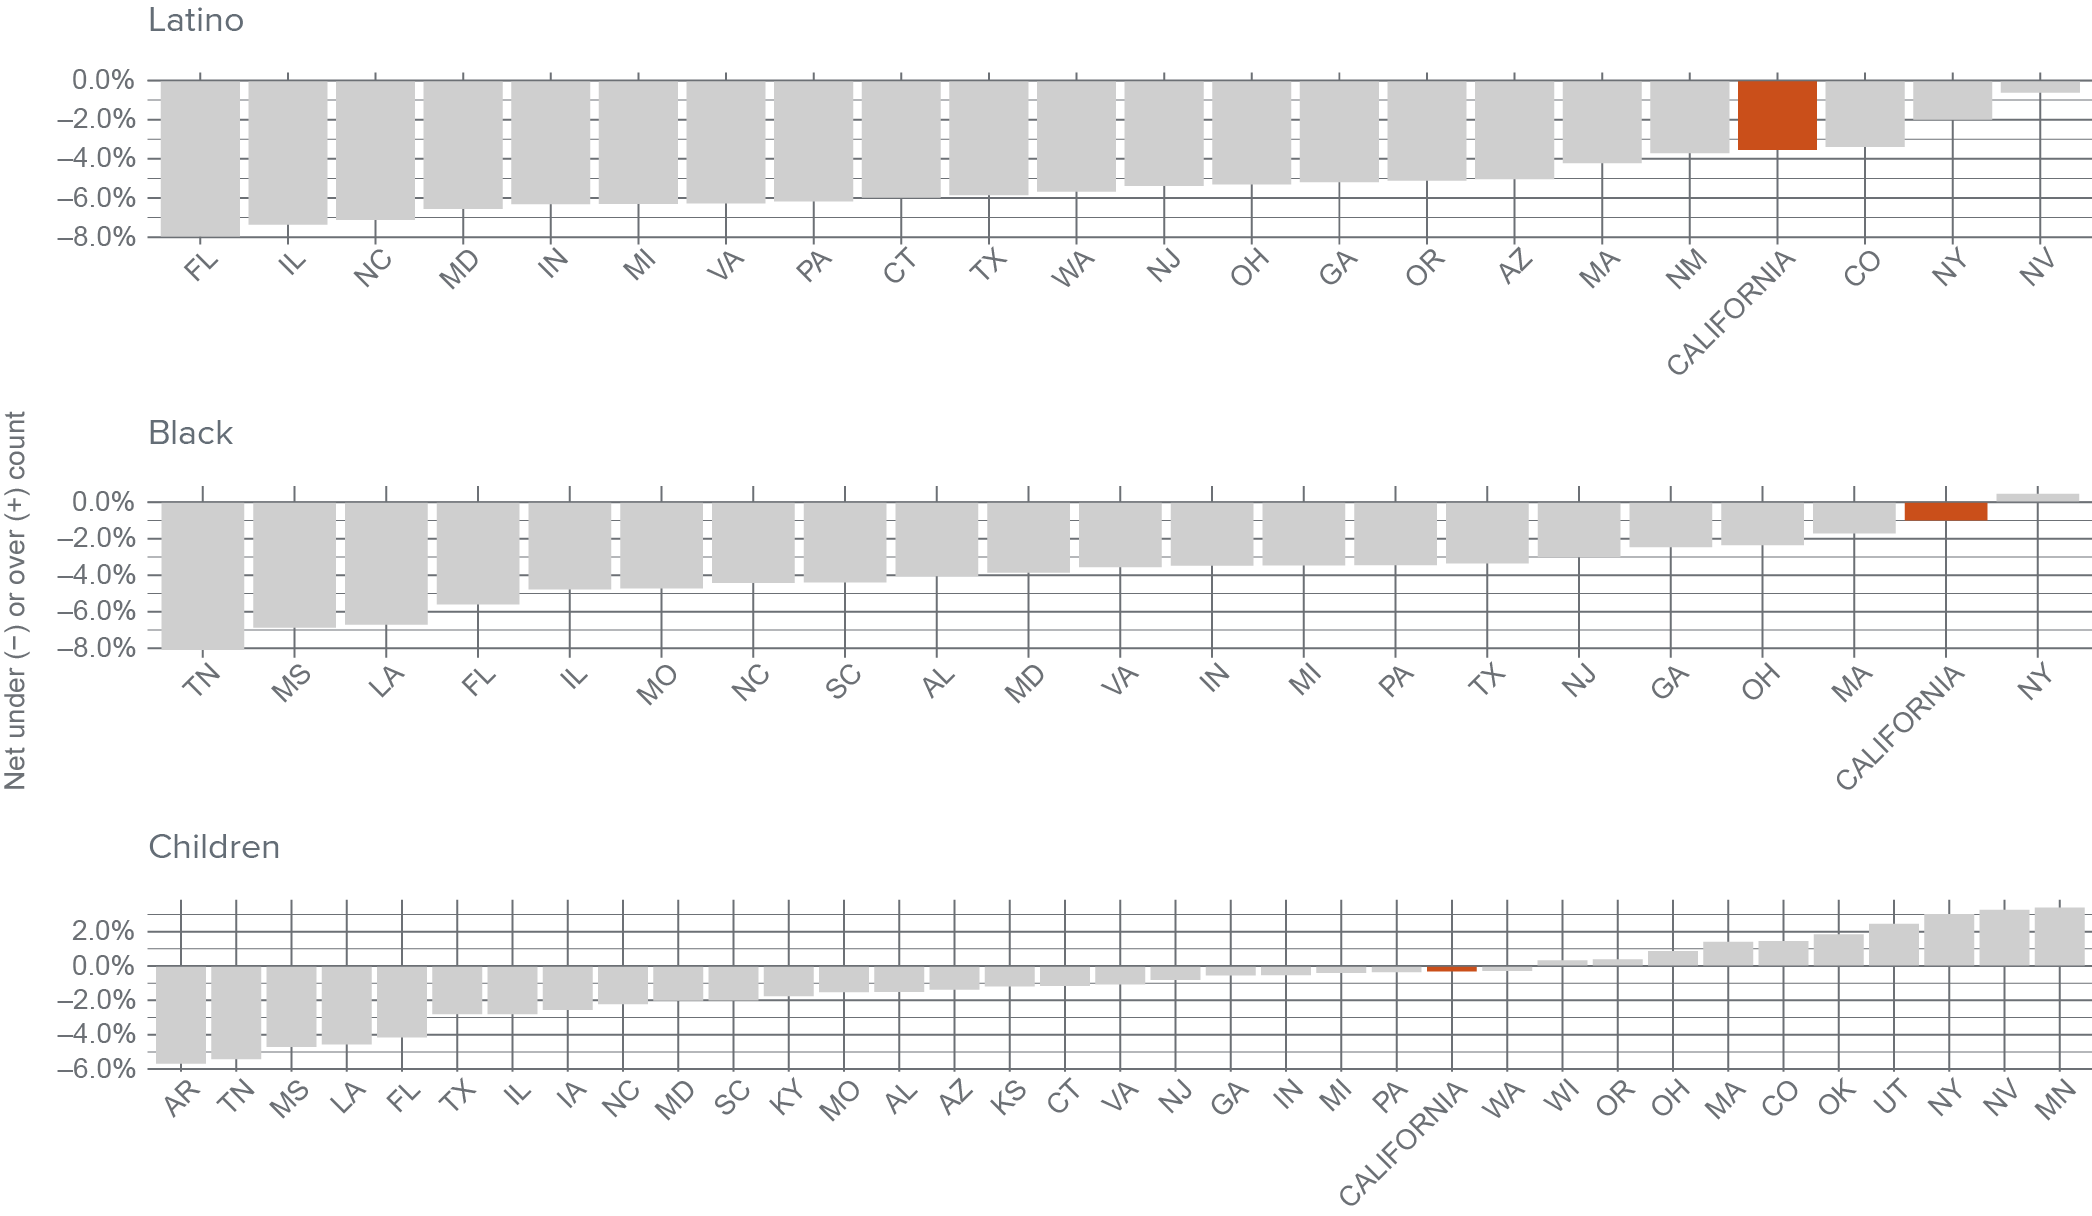
SOURCE: Author calculations using Hill et al. (2022) and Khubba et al. (2022).
NOTES: Values indicate the percentage deviation between the original census count and estimates of the count from the PES using released totals and iterative proportional fitting. The states are organized by the deviation, with the largest net undercounts on the far left and the largest net overcounts on the far right. To limit sampling and estimation error, we report only states with at least 500,000 residents in the relevant group.
California’s count of these key HTC groups was considerably higher and more accurate than in many other states. California’s Latinos were undercounted by -3.54%—a disconcertingly high number, but still notably better than the undercount in the United States as a whole (-4.99%). Compared to other states with substantial Latino populations, California’s count was closer to accurate than all but Colorado, New York, and Nevada.
California’s count of African Americans was even better. While the nation as a whole had a Black undercount of -3.30%, the estimated undercount for Black Californians was -0.99%, ahead of all other large comparison states except New York.
California’s count of children was also successful: at -0.31%, it fell close to the national average (-0.84%) and behind only one large comparison state (Washington) in closeness to a perfectly accurate count. However, this estimate includes many children that would not necessarily be considered hard-to-count. Currently, it is not possible to estimate undercounts for especially hard-to-count children like the very young (ages 0–4) or children of color.
Overall, California appears to have had relatively good enumerations of HTC populations. Of particular note, compared to Texas and Florida (the second and third most populated states), which spent very little or nothing on GOTC efforts, California’s results are especially positive. Indeed, if these comparison states had counts as good as California’s, each might have gained another seat in Congress.
Understanding California’s Census Investment
California’s overall count was quite accurate and produced relatively accurate counts of several hard-to-count groups. California also spent a significant amount of money on its GOTC efforts. While we cannot confirm that the good count followed from the spending, some link seems plausible. The average undercount in states that spent nothing was larger than in states that spent something: by 2.38% for Latinos, by 1.92% for African Americans, and by 2.24% for children.
Could California have spent less and gotten the same result? The state’s overall count was better than most states and statistically indistinguishable from a perfectly accurate count. The state’s count of Latinos, African Americans, and children were also quite good given the historical challenge of counting those communities; California’s outcomes were better than almost any other state.
It is also worth noting that the same states that did well with HTC communities likely overcounted some other communities. California overcounted Asian Americans by 3.52% and non-Hispanic whites by 4.05%. These overcounts are inequitable: they distort political representation within the state and give disproportionate government funding to areas with higher concentrations of these populations.
If the state’s GOTC efforts raised the participation of HTC communities they may have also contributed to these overcounts. As part of reviewing the state’s GOTC in preparation for Census 2030, it will be important to consider ways to target mobilization more strategically. To the extent possible, the goal should be to improve undercounts without encouraging overcounts at the same time. Improving upon California’s highly accurate 2020 count will mean even greater equity and more accurate political representation for state residents in the future.
Topics
Political Landscape Population