

California enacted the Local Control Funding Formula (LCFF) in 2013–14 in an effort to simplify school finance and increase funding for high-need students—those who are low income, English Learners, or foster youth. In the wake of COVID-19, the LCFF in 2020 was able to distribute record-high funding from state revenues; the enacted 2021–22 budget includes $1.1 billion for an ongoing increase to the LCFF.
Students are seeing some benefits from the funding formula. After the state fully implemented the LCFF, test scores rose in the highest-need districts that receive the most funding. While these early gains are notable, disparities in outcomes by student income, race, and language status remain large.
How do districts spend LCFF funding?
More money is now reaching high-need districts due to the LCFF, and those districts spend slightly more of that money at schools with greater need, largely on staffing. Staff salaries and benefits account for about 80 percent of student spending, on average.
When districts received increases through the LCFF in 2018, they spent about $250 more per student on teachers in their highest-need schools, relative to their lowest-need schools. These districts also had smaller class sizes in their higher-need schools. However, high-need schools also employ lower-paid, less-experienced teachers, a staffing pattern that predates the LCFF.
The largest spending increases under the LCFF went to staff benefits and salaries
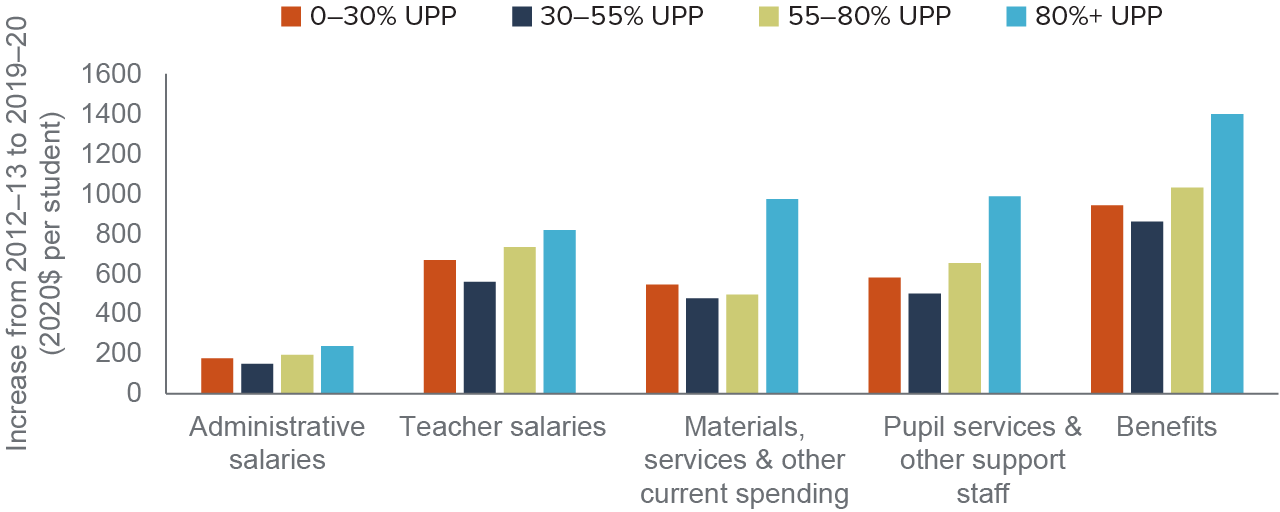
SOURCE: California Department of Education, SACS district finance data and enrollment files; Author’s calculations.
NOTES: UPP refers to the “unduplicated pupil percentage” of low-income, English Learner, foster youth, and homeless students in a district. Averages are weighted by average daily attendance (ADA). Districts with ADA less than 250 are excluded. Districts with greater than 500 percent or less than 20 percent of California mean spending per pupil or funding formula revenues per pupil are excluded.
How well does the LCFF target funding to high-need schools?
The LCFF has increased spending for high-need students across all school districts. However, no formal mechanism exists for tracking whether districts spend this extra funding on their high-need students. Currently, about 55 cents of every dollar of additional funding for high-need students is spent at the school that generates the funding, signaling that LCFF funding for high-need students does target those schools that generate it, but not completely.
Furthermore, one-fifth of the state’s high-need students live in middle- and higher-income districts that receive less LCFF funding. The LCFF intentionally directs more money to the highest-need districts on the grounds that it costs more to educate high-need students in areas with higher concentrations of student need. The formula led to roughly $700 more in per-pupil student spending in high-poverty relative to low-poverty districts in 2018; however, spending per disadvantaged student was roughly $350 higher than the increase for each non-disadvantaged student.
What other obstacles hinder LCFF targeting?
Districts must allocate LCFF funding based on student need, but standards are unclear, with little to no regulation over where or how districts choose to spend. Meanwhile, state funding for special education has not kept up with costs of living and costs of disabilities. This means that districts with higher-need special education populations must cover increased costs.
Because high-need schools rely more heavily on less-experienced staff, translating additional funding into improved student outcomes may remain a challenge. And as pension costs continue to rise, as schools manage teacher shortages, and as student enrollment falls in half of California districts, district officials must weigh these constraints as they determine how they can spend their additional funds.
Which policy changes can improve the reach of LCFF funds?
Moving forward, policymakers must take into account that the highest-need schools and districts disproportionately rely on novice and less-experienced educators. Key policies, therefore, should involve additional funding and incentives that allow districts to hire and retain qualified staff in the highest-need schools, especially given teacher shortages around high-demand subjects.
To further address gaps in student outcomes, policymakers must consider that a majority of high-need students live in districts where the high-need share is between 30 percent and 80 percent. Funding increases that target high-need students across a broader set of schools and districts can improve efforts toward distributing funds equitably, as poverty levels can vary widely within a district.
Finally, school-level spending data under the federal Every Student Succeeds Act (ESSA) provide deeper information and insights into how districts allocate resources. While important, these federal data are not meant to comprehensively account for LCFF funds. To improve tracking and transparency, state policymakers should consider required reporting mechanisms for funding down to the site level, mechanisms that may require shifts in accounting practices for many districts as well as funding, guidance, and technical assistance from the state.
Topics
K–12 Education PopulationLearn More

Commentary: On California Funding Formula’s 10th Anniversary, Celebrate Progress but Double Down on Fairness

Financing California’s Public Schools

Examining the Reach of Targeted School Funding

District Spending of One-Time Funds for Educational Recovery

Understanding the Effects of School Funding

Video: Targeted K–12 Funding and Student Outcomes
