


After pandemic-era declines, California’s poverty rate is on the rise. Expansions to safety net programs during the pandemic reduced poverty substantially, but these expansions had mostly expired by the end of 2022. And while economic growth throughout 2022 countered some of these program losses—by boosting family resources from work—the state’s overall poverty rate increased from 11.7% in fall 2021 to 13.2% in early 2023, according to the most recent California Poverty Measure (CPM).
The CPM, a collaborative research effort by PPIC and the Stanford Center on Poverty and Inequality, reflects both the varying cost of housing and the key role of safety net resources in helping low-income families make ends meet. Last week we released an updated Who’s in Poverty interactive that breaks down poverty differences by age, race-ethnicity, education, employment, family composition, immigration, and place of birth. New this year are regional breakdowns for these demographic groups. California’s most populous counties—Los Angeles, Orange, and San Diego—make up three of the nine regions; the other 55 counties are grouped into six regions.
Across regions, Los Angeles County (15.5%) and San Diego County (15.0%) had the highest poverty rates; rates were lowest in the Central Valley and Sierra region (10.7%), in part due to lower housing costs. The child poverty rate was nearly twice as high in Orange County (18%) and the Central Coast region (17%) than in the Northern and Central Valley regions (10%).
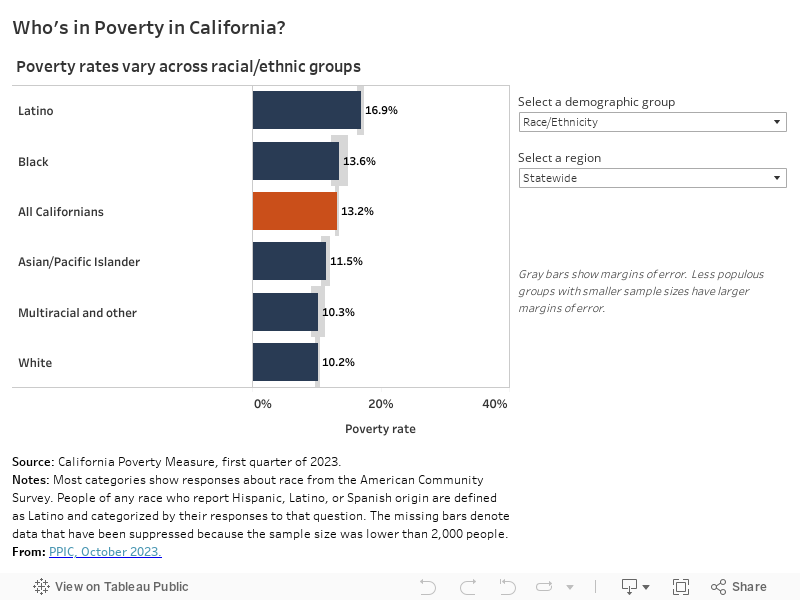
This variation in regional poverty is linked to race-ethnicity and immigration. In early 2023, Latinos made up a disproportionate share of the poor population across the state: Latinos comprised about 50.7% of poor Californians but only about 39.7% of the state population. The disproportionality is most pronounced in the Bay Area and in Orange County; it is not as marked in the Central Valley and Sierra and Inland Empire. Across regions, poverty also tends to be higher among immigrants than among US-born Californians, in part due to limited eligibility for and access to safety net programs.
Single-adult families, with or without children, have the highest poverty rates across regions, ranging from 24.1% in the Sacramento Area to 29.5% in the Central Coast region. Poverty rates for married adults with or without children range from 7.3% in the Central Valley to 13.1% in Los Angeles.
Our interactive shows how strongly education is tied to poverty among working-age adults (ages 25–64) across the state. Poverty rates among Californians with at least a bachelor’s degree are low (from 5.2% to 7.7% across regions), while those with less than a high school diploma have the highest poverty rates—particularly in the Bay Area and LA County (26.6% and 24.7%, respectively).
This updated interactive is part of our ongoing effort to show how poverty rates differ across regions and demographic groups, and to highlight the important role played by housing costs and safety net programs. Through our interactives (which also include California Poverty by County and Legislative District), fact sheets on poverty and the working poor, and more, we offer insights that can help local leaders and policymakers address poverty and understand the needs of the diverse populations they serve.


