

Voter turnout in California’s 2014 midterm election was awful. It looks to have hit a new low, with about 42 percent of registered voters deciding to cast a ballot. The previous low came in a 2002 race between Bill Simon and Gray Davis that everyone at the time agreed marked a low point for engagement and interest.
But are these numbers really so bad? Can we put them in some broader context that makes them look better? We can try, but it turns out that when we do, it only makes them look worse.
First, turnout as a share of registered voters tells only half the story. It ignores all the Californians who were legally eligible to vote but didn’t even bother to get registered in the first place. If we’re worried about citizen engagement, then ignoring these people is a problem. When they are included in the calculation, turnout drops to 31 percent—5 percentage points below the previous low and 17 points below the average for midterm elections since 1922.
The problem is still more dire when we stack California against the rest of the country. The graph below shows midterm turnout among eligible voters in California and the United States as a whole (the U.S. numbers come courtesy of Michael McDonald and his United States Elections Project).
 As the graph indicates, national turnout was low this year (about 36%), but it wasn’t too far out of line with the trend since the 1970s, which has been a little low but flat. California’s midterm turnout, by contrast, has been in a fairly steady decline since the mid-1950s. Our recent turnout is 5 points below the national number, despite the fact that many other states did not have any statewide election (and the national average includes California itself).
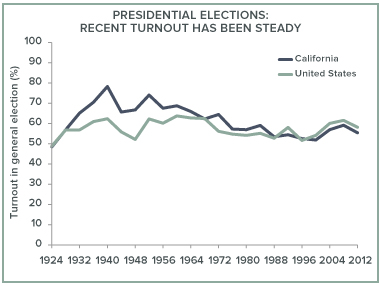
Before we conclude this is a California problem, it’s useful to see the same graph for presidential elections.
It looks about the same—fairly flat national turnout and falling California turnout since the 1970s—until roughly the last 20 years. During this most recent period, California’s decline has stopped, and turnout in both California and the nation has even increased a little.
 Taken together, these graphs rule out some explanations. The problem is not California’s political reforms like the redistricting commission or the top-two primary, because the gubernatorial decline predates those changes (which came in 2012). But it’s not something immutable about California, either, because it’s nothing a few exciting presidential elections can’t fix. In fact, what’s interesting is how good California’s turnout used to be compared to the rest of the country, and therefore how new it is to have a California with turnout that is actually below the national average.
To get at the answer, we will need to understand what has been different about recent presidential elections in California, and why higher turnout for them has not extended to gubernatorial races. Is turnout decline the natural state of things, from which presidential contests have departed? Or is higher turnout the more reasonable expectation, from which gubernatorial turnout is an aberration? Both accounts seem reasonable, but it’ll take further study to pull the two apart.