On March 13, Governor Newsom signed an executive order placing a moratorium on the death penalty for the 737 inmates on death row in California’s prisons. The order suspends executions for the remainder of Newsom’s administration but does not allow for the release of any inmates or alter any convictions or sentences. California joins Colorado, Pennsylvania, and Oregon as the only states where governors have taken executive action to halt the legal use of the death penalty.
Permanently abolishing California’s death penalty would require voter approval. When this question was on the ballot in 2012 and 2016, a slight majority of Californians (52% in 2012 and 53% percent in 2016) voted to uphold the death penalty as the maximum punishment for those found guilty of first-degree murder.
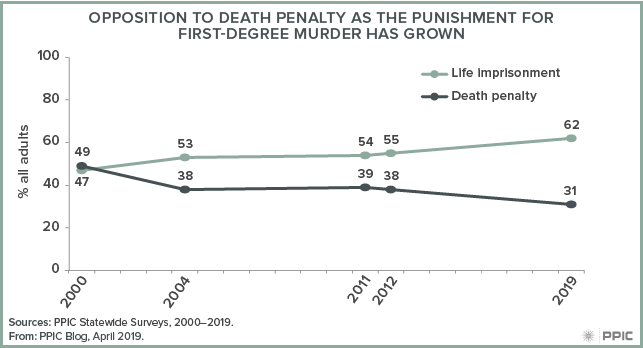
How do Californians view the death penalty today? In our March PPIC survey, a record-high 62% of adults (58% likely voters) prefer life imprisonment with no possibility of parole as the penalty for first-degree murder, compared to 31% of adults (38% likely voters) who prefer the death penalty. The preference for life imprisonment has grown steadily since January 2000, when opinions were divided among Californians (49% death penalty, 47% life imprisonment).
The issue is highly partisan: three in four Democrats (76%) and more than half of independents (56%) favor life imprisonment over the death penalty, compared to only one in three Republicans (32%). Since September 2012, when we last asked this question, support for life imprisonment has risen substantially among Democrats (up 9 points) and independents (up 11 points)—but stayed about the same for Republicans (down 1 point).
The preference for life imprisonment has climbed across nearly all age, education, income, and racial/ethnic groups—with the exception of African Americans and Latinos. African Americans are now less likely to favor life imprisonment (67% today versus 75% in 2012), though their support is still high. Among Latinos, 69% prefer life imprisonment, same as in 2012. In contrast, Asian Americans are now much more likely to support life imprisonment (66% today versus 50% in 2012), as are whites (54% today versus 45% in 2012).
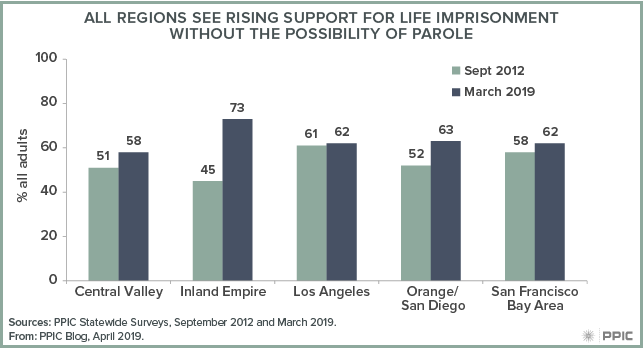
Support has also grown in all major regions of the state, with particularly large shifts in the Inland Empire and Orange/San Diego Counties. In the Inland Empire, 73% of residents favor life imprisonment, up 28 points since 2012. In Orange/San Diego Counties, 63% prefer life imprisonment, up 11 points since 2012.
Following the governor’s executive order, Assemblymember Marc Levine introduced a constitutional amendment that would abolish the death penalty in California. If approved by a two-thirds vote in the legislature, it will appear before voters on the 2020 ballot. Stay tuned as we continue to monitor Californians’ perceptions and policy preferences on this issue.