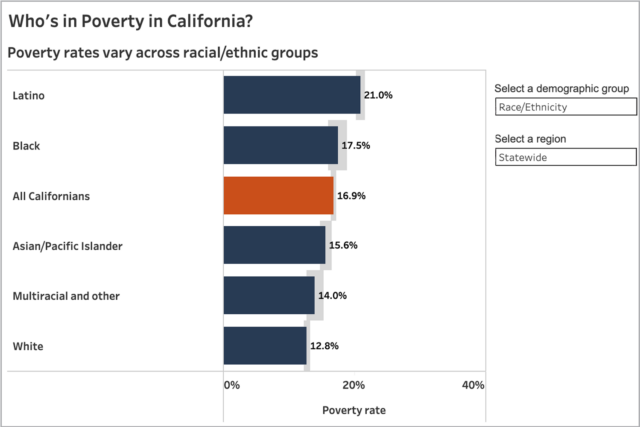

As a new legislative session begins, nearly one-third of state lawmakers are new to their role. This year, some state leaders have committed to prioritizing policies that address California’s affordability and cost-of-living issues. One way to understand how the state’s high cost of living affects families is to look at poverty levels. In early 2023, about 5 million Californians were living in poverty—meaning that they lacked the resources to meet basic needs—according to the California Poverty Measure, a research effort by PPIC and the Stanford Center on Poverty and Inequality.
In California, a family of two adults and two children need on average $39,900 annually to make ends meet at a very basic level, based on California Poverty Measure (CPM) data from the first quarter of 2023. A family’s basic needs include housing, food, clothing, utilities, and other necessities. This cost varies across regions: the threshold is lower in inland areas ($32,300 in the Central Valley and Sierra) and higher in coastal areas ($46,000 in the Bay Area).
Income from work as well as benefits from government nutrition programs like CalFresh and cash assistance like EITC and CalWORKs can help families meet their basic needs. Meanwhile, necessary expenditures like transportation to work, child care, and medical care may make it harder for families to make ends meet.
A key strength of the CPM is its geographic and demographic specificity. Our interactive maps show poverty levels and thresholds across counties and legislative districts. We also provide additional estimates on the poverty impact of CalFresh, CalWORKs, and tax credits across geographies.
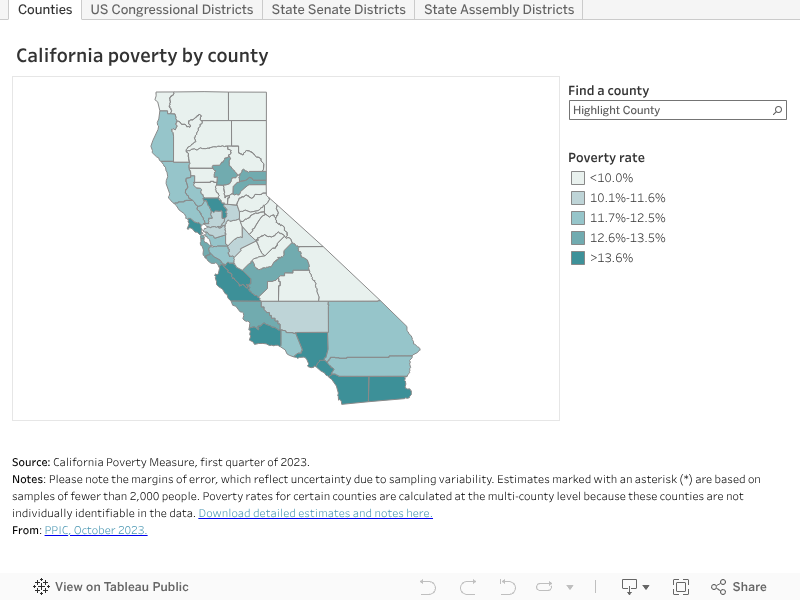
The overall picture shows poverty increased across the state after the end of pandemic-related safety net expansions, but there is wide variation across districts.
- Across assembly districts, poverty ranges from 6.1% in District 16 (Alameda and Contra Costa Counties) to 26.1% in District 57 (Los Angeles).
- Across senate districts, poverty ranges from 8.8% in District 12 (Central Valley) to 21.9% in District 26 (Los Angeles).
- Across congressional districts, poverty ranges from 8.8% in District 3 (northern region, Sacramento area, and Central Valley and Sierra) to 22.3% in District 37 (Los Angeles).
Along with our fact sheets on poverty and the working poor, these interactive maps shed light on the impact of safety net resources and housing costs on California families. A more nuanced understanding of California’s regional and demographic differences can help inform local and state stakeholders’ efforts to address the cost-of-living challenges many Californians face today.