PPIC policy director and senior fellow Magnus Lofstrom testified before the Little Hoover Commission on January 25, 2024. Here are his prepared remarks.
Thank you for the opportunity to testify this morning. My name is Magnus Lofstrom, and I am a policy director of criminal justice and senior fellow at the Public Policy Institute of California (PPIC). PPIC is an independent, nonpartisan policy research organization; it does not take positions on legislation. My comments on retail theft draw on PPIC’s extensive research on crime in California, including the impact of criminal justice reforms.
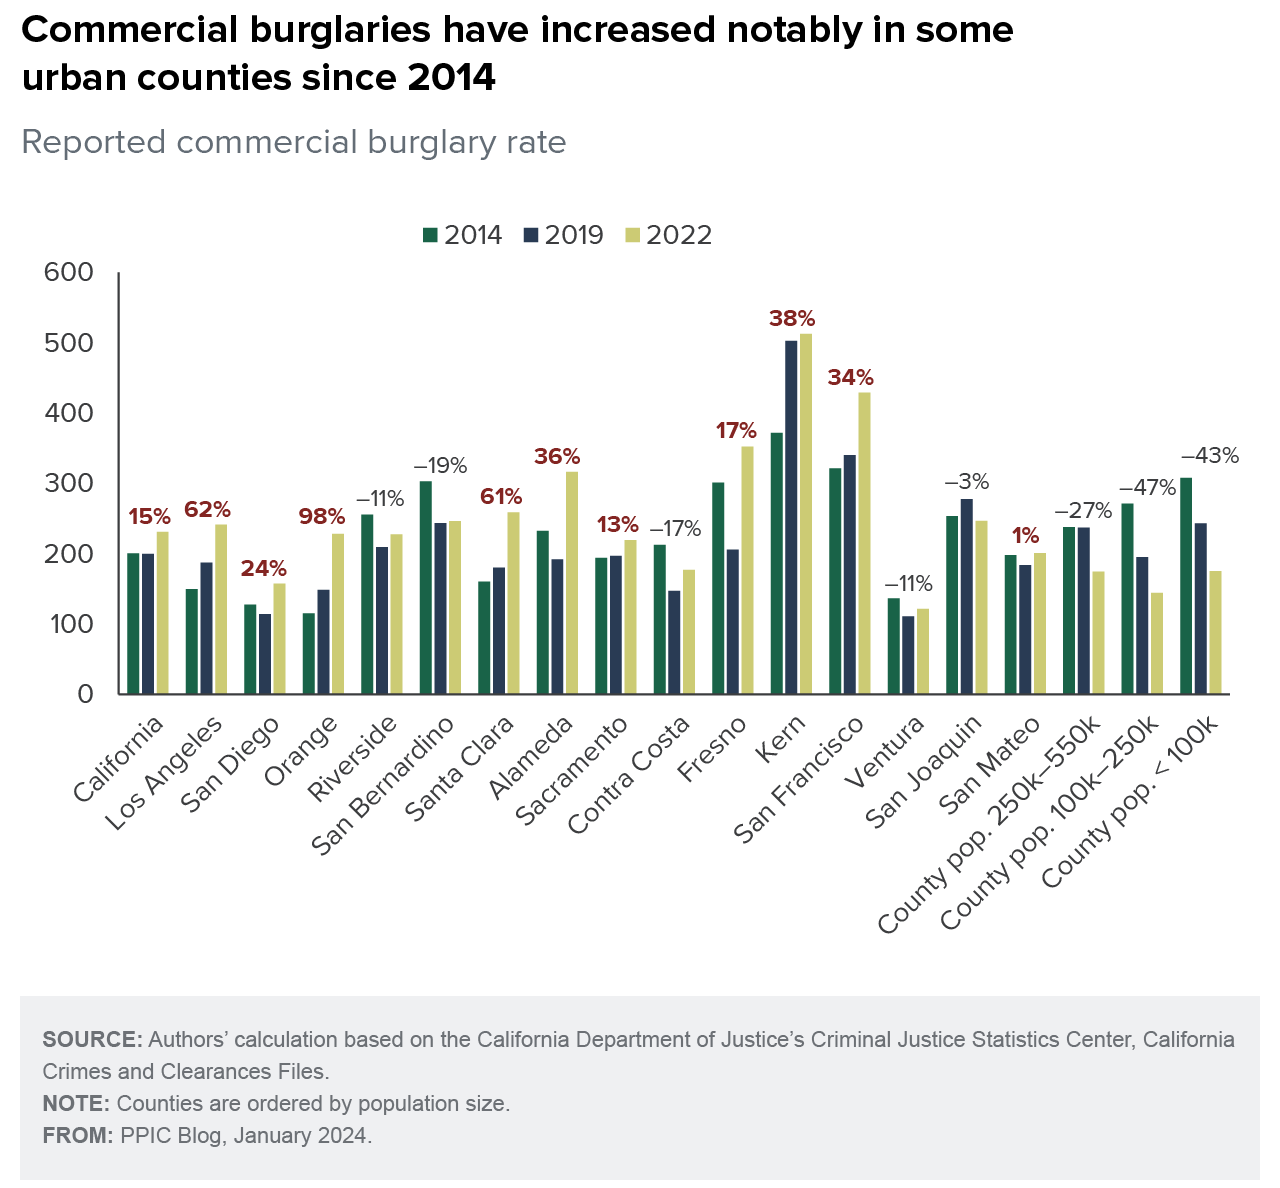
Recent trends in retail theft vary across the state and by type of offense—but the data indicate a rise in shoplifting, especially in the Bay Area, and a broader rise in commercial burglary among urban counties. Concentration of increased retail theft in some areas, and likely underreporting of lower value incidents, plausibly contribute to differences in how retailers and residents perceive the problem of retail theft. To more accurately assess the magnitude of the challenges and identify effective solutions, more comprehensive data are needed.
While not without limitation, currently available data from the California Department of Justice (CADOJ) can inform our policy discussions about retail theft. It is important not to limit analyses of retail theft to shoplifting, especially given that Proposition 47 (passed in November 2014) reclassified a number of property and drug offenses from felonies to misdemeanors. Under Prop 47, shoplifting is defined as theft below $950, a misdemeanor. Higher value retail theft that falls under second degree burglary (which can be charged as either a misdemeanor or a felony) can be captured in the crime data as commercial burglary.
As with any data, there are important caveats. First, the data currently available for the entire state do not extend beyond December 2022. Second, the data are limited to incidents that are reported to law enforcement agencies; retail theft is likely underreported, especially low-value theft. Moreover, local law enforcement agencies may vary in how they report and categorize offenses. Lastly, the data do not allow us to identify so-called smash-and-grabs, or retail theft that is organized. With these limits in mind, here is what the data tell us.
At the statewide level, shoplifting jumped 29% from 2021 to 2022 but remains 8% below pre-pandemic levels and 17% below the 2014 rate. By contrast, commercial burglary has been ticking up in recent years; the rate rose by 16% between 2019 and 2022 and is 15% above the 2014 rate.

Recent trends in shoplifting have varied widely across the state. Only 3 of the 15 most populous counties saw increases in shoplifting from 2014 to 2022. San Mateo’s shoplifting rate almost doubled (up by 95%), while San Francisco and Alameda saw increases of 40% and 9%, respectively. Relative to pre-pandemic rates, 6 of the largest counties saw increases. Between 2014 and 2022, however, shoplifting rates fell at least 20% in 6 other populous counties and in 5 of the most populous counties from 2019 to 2022.

Increases in commercial burglary in urban counties are more widespread. Commercial burglary rose in 10 of the state’s largest counties between 2014 and 2022; the largest increases were in Orange (98%), Los Angeles (62%), and Santa Clara (61%). Most of these increases are driven by increases over the last few years. Fourteen of the largest counties saw increases between 2019 and 2022, with the largest increases in Fresno (71%), Alameda (65%), and Orange (54%). These increases are concentrated in urban counties; as with shoplifting, commercial burglary fell in smaller and rural counties.
Monthly crime numbers for 2022 offer clues about what 2023 data may reveal. The 2022 numbers show commercial burglaries holding steady, with what might be a downturn late in the year. Shoplifting, by contrast, increased steadily from late summer 2021 to the end of 2022; the number of shoplifting incidents was slightly above pre-pandemic numbers.

Monthly crime numbers show similar patterns across a number of urban counties. Shoplifting in Los Angeles has climbed steadily since mid-2021; by late 2022, it was 10%–15% above pre-pandemic levels. Other large urban counties—such as Sacramento, San Mateo, and Riverside—also show upward trends in shoplifting. However, San Francisco’s increase in shoplifting was driven by a jump from mid-2021 to mid-2022; by the second half of 2022, it returned to its pre-pandemic level.
Overall, crime data indicate that retailers have increasingly been targets of crime in some parts of California. Reported shoplifting incidents rose in the Bay Area and monthly crime data for 2022 shows that shoplifting is trending up in Los Angeles and other urban areas. Commercial burglary increases in recent years are more widespread. By 2022, commercial burglary was up in 21 of California’s 58 counties relative to 2019—mostly in large urban counties—home to 82% of the state’s population.
Proposition 47 has been a central focus in discussions about property crime and retail theft. In a 2018 report, we examined crime rates before and after Prop 47 passed in November 2014; we used data through 2016 (the latest available at the time). We did not find statistically significant evidence of Prop 47 affecting violent crime, but we did identify increases in property crime. Specifically, we estimated that larceny increased by 9%, driven primarily by car break-ins. We also found that shoplifting jumped initially but fell to pre–Prop 47 levels by the end of 2016; we could not determine the extent to which this decrease was driven by decreased reporting.
What is needed to effectively address retail theft? One key requirement is detailed data that would allow for determination of driving forces and differences across regions. Policy solutions need to be informed by an understanding of who is committing retail theft and under what circumstances: incidents that can be tied to organized retail theft call for different approaches and solutions than thefts by offenders made desperate by poverty and/or substance abuse disorders.
Lastly, but importantly, responses to incidents of retail theft may play a role in retail theft trends. Retailers may be less likely to report incidents if law enforcement responses are lacking, and offenders may be more likely to commit retail theft if there is a low likelihood of apprehension and limited consequences. To analyze the significance of law enforcement responses, researchers need data on initial responses to calls for service, whether an arrest was made for a given incident, whether the case was referred to the district attorney, whether and what charges were filed, and the final disposition of the case. Automated Criminal History System (ACHS) data collected and held by CADOJ may partially fill some of the current data and research gaps.
Topics
crime Criminal Justice Proposition 47 retail theftLearn More
Crime Trends in California

Overall Crime in California Fell Last Year, but Shoplifting Continued to Rise

Commercial Burglaries Fell in 2023, but Shoplifting Continued to Rise

Testimony: Crime Data on Retail Theft and Robberies in California

Retail Theft and Robbery Rates Have Risen across California