

Key Takeaways
Established in 2013, the California Competes Tax Credit (CCTC) aims to boost job growth by lowering the cost of labor to businesses that want to locate or expand in California. Using tax credit data from fiscal years 2014–15 to 2017–18, we evaluate the impact of the CCTC on job creation. We find:
- Each CCTC-incentivized job in a neighborhood (i.e., a census tract) increases the number of individuals working in that neighborhood by close to three—a significant local multiplier indicating that the CCTC creates more jobs than the number it directly incentivizes.
- CCTC awards increase employment among workers across socioeconomic and demographic groups, including workers living in poverty, those without a bachelor’s degree, Black workers, and Latino workers. CCTC also spurs job creation in both more- and less-advantaged neighborhoods, as measured by poverty and unemployment levels.
- Being awarded CCTC credits boosts firm employment and payroll growth within California by as much as 30 percent within three years, with positive effects extending to firms in areas with higher poverty and unemployment.
- For every $1 spent on the CCTC, we estimate as much as $5.66 in benefits generated, driven by the fact that earnings from the jobs created well exceed the costs of spurring this job creation.
Our results indicate that the CCTC is a well-targeted and well-designed hiring incentive subsidy that has proven effective in promoting local business expansions. Moreover, the costs per job created are low relative to other job creation incentive programs, suggesting that the benefits of the CCTC considerably outweigh the costs. Our evidence also suggests that the recent short-term expansion of the CCTC in 2021–22, as well as the creation of a related grants program, could lead to additional job creation at relatively low cost. However, more research would be necessary to determine if these changes are as effective as the smaller-scale, credit-based program.
Introduction
State and local economic development programs have proliferated in recent decades. To try to stimulate local economic activity, state and local governments in the US currently spend about $45 billion every year on business tax incentives alone (Bartik 2020). However, research tends to suggest limited, if any, positive effects of such programs—especially “place-based” incentives that target specific locations (Neumark and Simpson 2015).
California adopted the California Competes Tax Credit (CCTC) in 2013, replacing its longstanding enterprise zone program, which had been demonstrated to be ineffective at creating jobs (Neumark and Kolko 2010). The CCTC parallels other economic development programs around the country in aiming to attract and retain businesses in the state, and in providing some preferential treatment for proposed job creation and investment in distressed communities.
However, the CCTC departed from other programs in important ways in hopes of improving upon their meager record of success.
- First, the CCTC incentivized new job creation (rather than paying credits for jobs that might have been created anyway). This was accomplished in part by including some discretion for program administrators to identify businesses more likely to grow or remain in the state because of the CCTC incentives.
- Second, the CCTC included strong provisions to recapture tax credits claimed if the jobs were not ultimately created over the five-year window covered by the credits and retained for three years afterwards. The California Competes office requires annual reports from participating businesses and monitors compliance with the Franchise Tax Board (FTB), which can recover tax credits if companies fail to meet reporting requirements.
Overall, the CCTC is of particular interest for research because it incorporates perceived best practices from previous hiring credits, and the program’s structure and implementation facilitate rigorous evaluation. This report summarizes the findings from two research papers evaluating the effects of the CCTC, using tax credit data from fiscal years 2014–15 to 2017–18 (Freedman et al. 2023; Hyman et al. 2023). The report begins by providing a brief overview of the application and selection processes for the CCTC. Next, we examine the impact of the CCTC on local employment, including effects on workers of different socioeconomic and demographic groups and on different kinds of neighborhoods. We then turn our attention to the effects of the CCTC on employer outcomes such as employment and payroll. We also consider how the costs of the program compare to the benefits of job creation.
The California Competes Tax Credit
Under the CCTC, businesses apply to the California Governor’s Office of Business and Economic Development (GO-Biz). In their applications, businesses specify how much in-state corporate income tax credits they need in order to achieve specific commitments for net new hiring (and investments) in California. Tax credits under the CCTC are awarded based on a two-phase competitive process, in which applicants with a lower ratio of requested tax credits relative to benefits (in the form of new employee compensation and capital investment) are more likely to receive an award, as detailed in the text box below. GO-Biz also gives some priority for job creation in areas with higher poverty or unemployment and considers the strategic importance of the firm to innovation in the state and other qualitative information regarding the proposed project.
During fiscal years 2014–15 to 2017–18, between $150 and $200 million per year was budgeted for tax credit allocation. The average winning applicant in our data was allocated roughly $865,000 in tax credits. There are an average of 284 applicants in each allocation round, of which there are typically three each fiscal year. On average, 82 applicants are awarded tax credits in each round. Winning firms pledged to create an average of 101 jobs each over the five-year term of their contract; the median number of jobs was 31. It is worth noting, though, that as a targeted program, the CCTC reaches only a tiny fraction of the total number of businesses in California. CCTC does, though, target many large businesses.
The CCTC had originally been set to end in July 2018, but the California State Legislature extended the program through 2028. The legislature also made several changes intended to improve targeting of the incentives toward firms that would otherwise locate outside of California and added job training opportunities as a factor GO-Biz can consider in awarding credits (Legislative Analyst’s Office 2020).
Effects on Local Employment
In this section, we examine the effect of the CCTC on job creation in the neighborhood (i.e., census tract) in which the applicant proposed its activity; this includes many jobs held by those residing in other tracts. Our analysis aims to estimate the causal effect of the program, stripping out any changes in employment that would have occurred in the absence of the tax credit awards.
To isolate the actual effect of the program, we compare tracts with CCTC jobs awarded to similar tracts where they were not awarded. We refine this in two ways. First, we compare job growth associated with CCTC jobs “awarded” (by which we mean the number of new jobs for which credits were given), to job growth in tracts where CCTC applicants proposed a similar number of jobs. Second, we examine job growth in areas where applicants’ scores were close to the program cutoff, who either just qualified or just missed the cutoff and thus were similar. Using both of these approaches, we believe we can credibly estimate the causal effects of the program on tract employment.
Our analysis relies on administrative data from GO-Biz on applicants to the CCTC and detailed census-tract-level data on employment, poverty, and demographic characteristics of workers from the American Community Survey (ACS). This combination of data allows us to estimate effects not just on jobs overall, but also for workers (or their tracts of residence) distinguished by poverty status, education, ethnicity, and race, which can shed light on who benefits from any job creation induced by the CCTC.
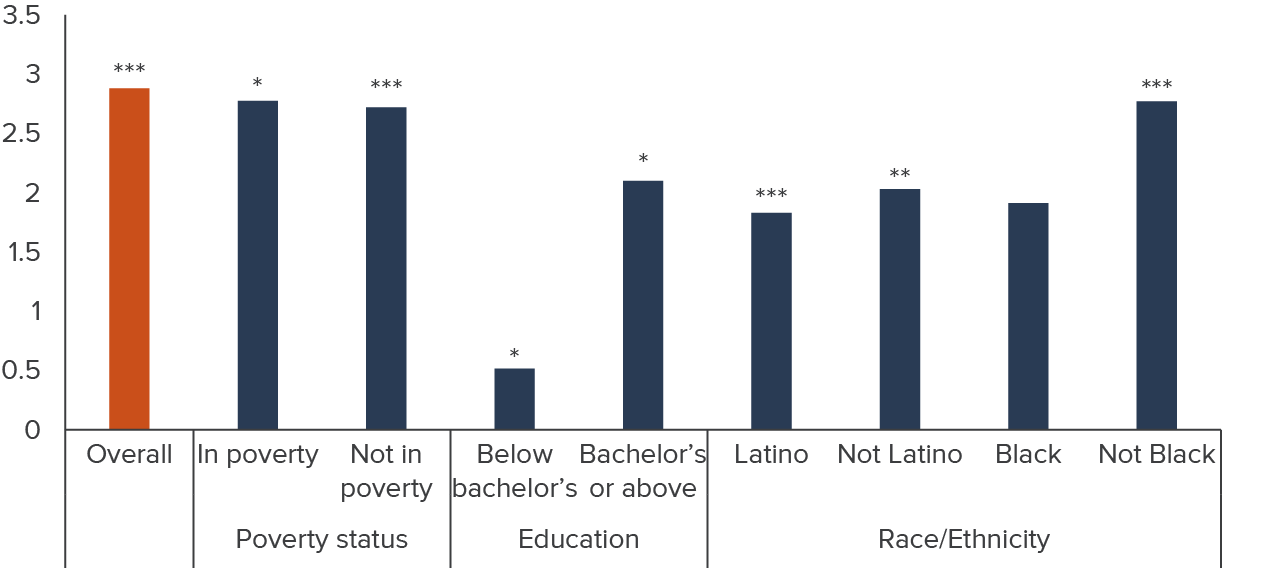
CCTC spurs jobs for different groups of workers
We find each CCTC-incentivized job awarded resulted in nearly three additional individuals working in the tract (Figure 1, first bar). This is referred to as a “multiplier” effect of the job creation spurred by the CCTC, because each subsidized job creates additional jobs; such a multiplier can arise because the tax credit enables the firm to expand employment more, or because jobs at some firms increase demand for employment at other firms (such as suppliers, or businesses that cater to workers taking jobs in an area).
We find these positive employment effects apply across different types of workers. As a result of incentivized jobs in a local area, CCTC increased jobs similarly for workers living in poverty and those not living in poverty. By education level, we find significant positive impacts for those with less than a bachelor’s degree and those with a bachelor’s degree or above, but job creation is biased toward more-educated workers. Finally, disaggregating by ethnicity and race, we find positive and significant impacts across race/ethnic groups. Job creation due to the CCTC is close to proportionate across these groups of workers.
CCTC spurs substantial job creation overall and across demographic groups
Jobs created per job awarded
SOURCES: Authors’ calculations based on American Community Survey data and CCTC data.
NOTES: Figure shows locally weighted difference-in-differences regression results for tract-level employment, by worker characteristics. Regressions include CCTC jobs proposed, and tract and year fixed effects. There are 900 tracts and 5,400 observations (these are approximated for confidentiality reasons). The regressions are weighted by average absolute values of score minus the cutoff; because of the weighting, tracts without at least 1 large applicant are excluded. Standard errors are clustered at the tract level. Three asterisks (***) indicate p<0.01, two asterisks (**) indicate p<0.05, and one asterisk (*) indicates p<0.1. Estimates for poor, below bachelor’s, Latino, and Black, are rescaled by one over the ratio of this group to the other. (For example, the ratio of poor to non-poor workers is 0.058, so the poor regression estimate is multiplied, in this figure, by 1/.058.) Thus, the estimates in this figure show, e.g., the number of jobs for poor or non-poor workers created per poor or non-poor worker.
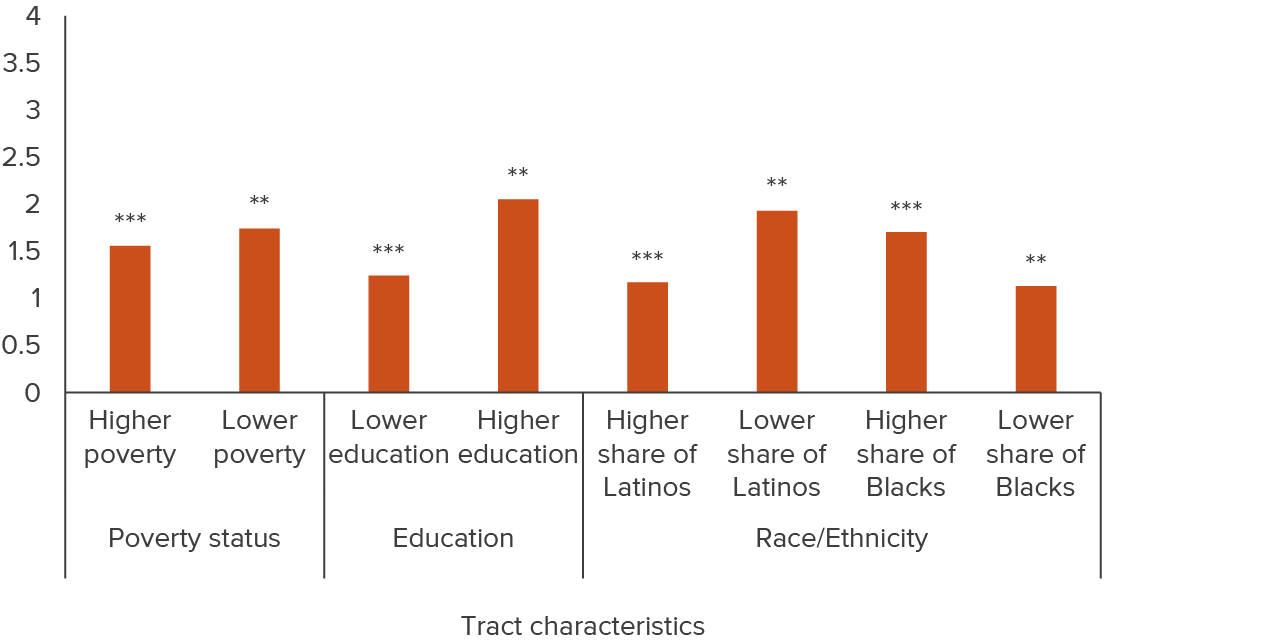
CCTC spurs jobs where workers live
We next examine CCTC’s overall employment effects based on the characteristics of the neighborhoods in which workers live. We categorize each census tract based on whether its poverty rate, its share of the population with a bachelor’s degree, and its share of the population who are Latino or Black are above or below the statewide median levels.
There are positive and statistically significant effects for workers residing in every type of tract we consider. The estimates indicate that jobs created for residents of high-poverty vs. low-poverty tracts were roughly similar. Jobs created for residents of tracts with lower education levels and high shares of Latinos were fewer, while jobs created for residents of tracts with higher shares of Black Californians were larger.
CCTC creates jobs for workers in a wide range of places, with some variation by education and race
Jobs created per job awarded
SOURCES: Authors’ calculations based on American Community Survey data and CCTC data.
NOTES: Figure shows locally weighted difference-in-differences regression results, for tract-level employment, by workers’ residential tract characteristics. Estimates are changes in employment per CCTC jobs awarded. Regressions include CCTC jobs proposed, and tract and year fixed effects. There are 900 tracts and 5,400 observations (these are approximated for confidentiality reasons). The regressions are weighted by average absolute values of score minus the cutoff; because of the weighting, tracts without at least 1 large applicant are excluded. Standard errors are clustered at the tract level. Three asterisks (***) indicate p<0.01, and two asterisks (**) indicate p<0.05. Estimates for tracts with higher poverty, lower education levels, higher shares of Latinos, and higher shares of Black residents are rescaled by one over the ratio of this type of tract to the other. (For example, the ratio of higher-poverty to lower-poverty tracts is 0.733, so the estimate of higher-poverty tracts is multiplied, in this figure, by 1/.733.) Thus, the estimates in this figure show, e.g., the number of jobs per resident of higher-poverty tract or lower-poverty tract created per resident of high-poverty tracts or lower-poverty tracts.
We find essentially no evidence of positive effects of CCTC awards on residents of the tracts in which the awarded businesses are located. In other words, the jobs created by CCTC are generally held by residents of surrounding tracts. This may not be surprising given that there is nothing in the structure of the CCTC program that prioritizes or requires jobs for tract residents. Moreover, it is common for some tracts to be dense in jobs, and a far larger number of tracts to have many residents but few jobs, so employment changes would not necessarily be concentrated on the residents of tracts where the employment changes occur.
Based on our estimates and data on program spending, we estimate that the total cost per job created by CCTC is approximately $3,315. This is a rough estimate based on jobs created in the early years of CCTC in specific areas, and thus might not reflect the total cost per job statewide. Our estimate of jobs created could be too high (and hence the cost-per-jobs estimate too low) if the program induces some job reallocation from other areas into the tracts where jobs are created. It could be too low if jobs are created in nearby tracts from, for example, expansions of businesses that serve the businesses receiving tax credits. Given that the CCTC program is relatively new, the permanence of jobs created as a result of the CCTC is also unclear. Nonetheless, in terms of the rough magnitude, our estimate is at the low end of the cost-per-job estimates from the literature on place-based policies and other business incentive programs.
Effects on Employer Outcomes
Next, we analyze employer responses to the CCTC, directly studying the impacts of CCTC awards on firms that received them. Doing so allows us to better understand the targeting of the program, including whether the CCTC draws in economic activity from other locations. As in the analysis of local employment effects above, in studying firm responses it is critical to isolate causal effects of the program, and not, for example, to confuse outcomes for firms that were going to create jobs faster than others regardless of whether the firm received CCTC incentives.
In this analysis, we exploit the two-phase process of selection for awardees to identify the effect of CCTC incentives, leveraging the fact that a firm whose score was just to the “wrong” side of the cutoff for selection is likely very similar to a firm whose score was just to the “right” side (with lower costs per benefits). In contrast, firms farther away from the cutoff are more likely to differ on dimensions we cannot measure that may affect job growth after CCTC award decisions. Thus, by focusing on the differences between firms very close to the cutoff, but on opposite sides, we can obtain rigorous evidence on the program’s effects.
For this analysis, we use the same administrative CCTC data on accepted and rejected applicants as above, now combined with the confidential US Census Bureau’s Longitudinal Business Database (LBD).
CCTC led to expanded firm employment and payroll
Two years after the awards, we find positive effects on both employment and payroll statewide. Our baseline estimates are reported in Figure 3 (two bars on the left). These estimates indicate that firms that receive a CCTC award increase employment and payroll by about 30 percent, on average. Some of our more conservative estimates are about half as large, which still represent sizable effects. Additionally, employment and payroll growth for firms also occurs in high-poverty/high-unemployment areas, although these estimates are less precise at least in part due to the smaller sample. We find that the effects on firm employment and payroll grow over time from the initial award date, as we would expect since the typical CCTC award is based on a commitment to increasing employment over a period of up to five years (results not shown). We find that these effects arise in large part from the expansion of jobs at existing businesses.
CCTC leads to significant expansions in firm employment and payroll, including in high-unemployment and high-poverty areas
Percent change after two years

SOURCE: Authors’ calculations based on Longitudinal Business Data and CCTC data.
NOTES: Figure shows regression discontinuity estimates of effects of receipt of CCTC credits on firm-level employment and total payroll. The estimates for each bar are from separate regressions. Estimates are approximate percentage changes (divided by 100). There are approximately 1,700 firms before different rules for estimation are imposed (confidentiality restrictions preclude reporting more detail). Each regression uses IMSE (Integrated Mean Square Error)-optimal bandwidths chosen separately on each side of the cutoff, and triangular kernel weights. All specifications include industry fixed effects, period fixed effects, and controls for baseline firm characteristics. Standard errors are heteroskedasticity robust. Two asterisks (**) indicate p<0.05, and one asterisk (*) indicates p<0.1.
CCTC’s benefits outweigh its costs
Our firm-level analysis, like the worker-level analysis, suggests that the CCTC is cost-effective. For every $1 spent on the CCTC, we estimate as much as $5.66 in benefits generated, driven by the fact that earnings from the jobs created well exceed the incentive costs of spurring this job creation (Hyman et al. 2023). This is consistent with our analysis above, which suggested a low cost per job created.
We also looked into whether the CCTC—which leads to higher job growth in California—comes at the expense of affected firms’ operations in other states. This may not be of direct concern to California policymakers. It is, though, relevant to a broader debate about local economic incentives and whether they are just a “zero sum” or “race to the bottom” game between states (and localities) that results in moving jobs around without creating new jobs in the aggregate—while rewarding companies with tax breaks that are, for the nation as a whole, unproductive. Such concerns have prompted some calls for bans on local business subsidies (Badger 2014; Markell 2017). However, we find little evidence that the program creates significant reallocation of employment or payroll across establishments within firms nationwide. Consistent with this, using data on firm-wide revenue, we find no evidence that CCTC-induced growth in California is associated with allocative inefficiency, i.e., businesses moving to locations with tax credits but also reducing firm productivity.
Conclusion
Our evidence shows that the CCTC program leads to employment and payroll growth in California, primarily due to business expansions. We also find that this job growth benefits a wide range of workers and is greater for firms in parts of the state with higher levels of poverty and unemployment.
The large positive impacts we find for the CCTC hiring incentives stand in contrast to much of the existing literature on state or local tax credits to boost employment, especially those targeting locations. Our best interpretation is that the CCTC program is more effective because its application process and discretionary tools allow program administrators to target firms whose behavior is most likely to be affected by the hiring credits offered, and because the CCTC has strong monitoring and credit recapture provisions to ensure that jobs are created when hiring credits are paid. It also effectively targets firms with proposed expansion plans, which may be more sensitive to tax credits and therefore grow more with a subsidy compared to a firm without such expansion plans.
As a result, our estimates may represent an upper bound on what economic development programs may achieve if properly structured and targeted. California’s CCTC program appears to be among the most effective of such programs, with a well-designed hiring credit that delivers strong employment gains, including gains that are generally balanced across different groups, and extend to disadvantaged areas. On the other hand, we would be cautious about generalizing these results to a much larger-scale program offering similar credits to many more firms, because CCTC program administrators may be choosing to offer incentives among a subset of firms poised for large employment growth if tax credits are received.
Our evidence suggests that the recent short-term expansion of the CCTC in 2021–22, as well as the creation of a related grants program, could lead to additional job creation at relatively low cost. However, new research would be required to determine whether the program at larger scale, and a grant version of it, are equally effective. The only reliable way to assess this question would be to continue to evaluate the program’s impact on firms that receive credits.
Topics
Economic Growth Economy Jobs and Employment