

Table of Contents
Key Takeaways
California has seen increases in some crime over the last decade, including notable jumps in homicides, auto theft, and most recently retail theft, as well as a slow gradual uptick in aggravated assaults. While these recent increases have dominated headlines, longer-term trends in fact point toward significant overall decreases in crime since the 1990s that appear to be concentrated among juveniles and young adults.
In this report, we examine these long-term changes, focusing specifically on whether younger generations are less likely to be criminally active, as measured by violent crimes, than past generations—or if drops in offending have affected all age groups. One of the most robust relationships in criminology is between age and crime: criminal offending increases in adolescence, peaks in the late teens or early 20s, and then continually decreases. This relationship is the foundation for the well-known “age-crime curve,” which underlies predictions and risk assessments about future offending.
Drawing from unique, individual-level data on arrests in California between 1980 and 2020, we use arrests for violent felonies as our measure of criminal offending because these offenses have not been directly targeted by the numerous reforms implemented in the state over the past several decades and arrests for these crimes are subject to less law enforcement discretion.
- Between 1990 and 2010, the age-crime curve in California generally follows historical patterns, with peaks in crime during the late teen years or early 20s; these curves follow these patterns but have gradually shifted downward, reflecting declines in violent crime during this period. However, the most recent age-crime curves differ from earlier, well-established state and national patterns in ways that are consistent with generational shifts in criminal offending. →
- The violent felony arrest rate for young adults (ages 18–22) dropped by more than 50 percent over the last 25 years, from 1,712 per 100,000 residents in 1994 to 840 in 2019. The drop is even more notable as the rate for adults in their late 30s and older increased over the same period. This steep decline is the driving factor behind the most recent shift in the age-crime curve. After representing about 25 percent of violent felony arrests among adults for decades, young adults now account for 16 percent of these arrests. →
- We see reductions in violent criminal offending beginning with individuals born in the early 1990s. For those born in 1993 and later, the violent felony arrest rate is 20 to 25 percent lower than in previous generations. →
- The decrease in violent criminal offending among younger generations is driven by fewer individuals arrested for violent felonies. However, the number of offenses each individual is arrested for in a year has increased by about 5 percent, a notable deviation from decades-long levels. This increase has not been limited to any single generation but represents a broader increase over the last decade. →
While our study does not aim to identify the reasons behind these shifts, nor the extent to which they apply to other offenses, the decrease in criminal offending coincides with changes in some teen behavior; for example, measures of risky behavior, like alcohol consumption and drug use, have declined among more recent generations. Future work to determine specific contributing factors and whether the changes are persistent would have great value and policy relevance.
Even without knowing the root causes, several policy implications follow from our findings. The decrease in crime among younger generations suggests the possibility of lower future capacity needs for the criminal justice system. But although there has been a drop in the number of offenders arrested, the frequency of offending is up somewhat, pointing toward the potential need for new and/or alternative approaches to reduce crime among a plausibly more challenging-to-rehabilitate offender population. Lastly, but importantly, our results also suggest that risk assessment tools—which are widely used by criminal justice agencies—need to be adjusted to account for declines in offending among younger generations to reduce inaccurate predictions.
Introduction
California has seen increases in some crime over the last decade, including noticeable jumps in homicides and auto theft as well as a slow gradual uptick in aggravated assaults since 2014. Most recently, so-called smash-and-grabs at high-end stores across the country are frequently making the national headlines, and crime data show that retail theft is up in recent years.
Nonetheless, crime rates are, from a historical perspective, relatively low and have been trending downward over the past decades. Even with year-to-year fluctuations, property crime started its long-term decline in the early 1980s, while violent crime reached a peak in 1992 and then sharply dropped over the next two decades. The violent crime rate is now where it was in the early 1970s, less than half of its peak in the early 1990s. Meanwhile, the property crime rate is one-third of its 1980 peak—and although the 2022 rate was about 9 percent higher than the unusually low pandemic-era 2020 rate, the latter was the lowest level observed since 1960.
These trends are not unique to California and are in line with what has been observed nationwide. And while there is no consensus concerning the factors driving these decreases, potential explanations include incapacitation effects from increased reliance on incarceration (i.e., removing offenders from the community), changing demographics in the population, different policing strategies and increased staffing levels, as well as shifts in drug markets, including the decline of crack cocaine (see, for example, Blumstein 2006 and Levitt 2004).
Recent data on arrests suggests decreases in crime and arrests are concentrated among juveniles and young adults. The Office of Juvenile Justice and Delinquency Prevention (OJJDP) shows that arrests of juveniles started to sharply decline nationwide about a decade ago, falling 84 percent between the 1996 peak and 2020 (OJJDP 2022). Arrest data for California reflects a similar trend. Lofstrom et al. (2018) find that although arrest rates decreased for all age groups, the plummeting arrest rates for juveniles and young adults are the driving factor behind the steep decreases in overall arrests over the last few decades.
There are numerous possible contributing factors to the decreases in arrests among youth and young adults, including juvenile justice reforms. California passed a number of juvenile justice reforms in the 1990s and 2000s, some supported by broader federal efforts and funding (Krisberg et al. 2010; National Research Council 2014). Reforms included Senate Bill 681 (1996), a significant change that shifted the cost of incarcerating juveniles in a California Youth Authority (CYA) facility from the state to the counties, and Assembly Bill 2312 (1996), which provided counties with funding for programming.
These laws reversed the earlier trend of increasing juvenile incarceration in state facilities and was followed by other reforms, including Senate Bill 81 (2007), which limited incarceration in a state juvenile facility to offenders of serious, violent, and sexual crimes. By 2009, the juvenile offender population in state facilities had dropped from its 1996 peak of over 10,000 to 1,500 (Krisberg et al. 2010). Furthermore, over the last decade, California has passed a number of significant criminal justice reforms that may have included changes to the enforcement and sentencing of offenses with higher concentrations of juvenile and young offenders.
In this report, we build on recent research to examine another possible key contributor to decreases in crime and arrests: less criminal offending among more recent generations, or birth cohorts. Kim, Bushway, and Tsao (2016) conducted some of the earliest research on this topic, finding that the 1990–2010 drop in felony arrest rates in New York State was mostly due to decreased arrests among individuals born in more recent years rather than a broad decrease across all age groups. Examining arrest histories among a sample of individuals born in Chicago, Neil, Sampson, and Nagin (2021) find that individuals born in the mid-1990s are notably more likely to be non-offenders than those born in the mid-1980s.
The goal of this report is to examine whether such significant shifts bear out in California, as measured by violent felony arrests, and if so, determine when, based on year of birth, changes in criminal offending started. To do so, we use detailed data on all arrests in California between 1980 and 2020 as reported to the California Department of Justice’s Automated Criminal History System (sometimes referred to as “rap sheet” data). We focus on arrests for violent felony offenses as our measure of criminal offending because these crimes have not been directly affected by the numerous reforms implemented in the state over the past several decades and arrests for these offenses are subject to less law enforcement discretion. This limitation means that we cannot say whether our findings and conclusions apply to other types of offenses.
There may be significant policy implications if more recent generations are less likely to commit crimes than earlier generations. The relationship between age and crime is often depicted as the “age-crime curve,” and it underlies predictions, expectations, and risk assessments about future offending. Risk assessments based on data from earlier generations may be less accurate when applied to more recent generations.
If there is less criminal offending among more recent generations, another potential impact is that future capacity needs in the criminal justice system may be lower than anticipated, possibly making downsizing both feasible and safe. However, such shifts may also bring about changes in the characteristics of offenders. Offenders from younger generations may be more criminally active, for example, potentially requiring different responses and treatments than those used today.
In examining changes in crime by age and over time, we consider three underlying factors that could be influencing trends, alone or in combination:
- Age-crime relationship (age effects), which describes the well-established pattern that crime peaks among those in late adolescence and early adulthood
- Generational changes (birth-cohort effects), which describe the pattern that people born in the same or adjacent birth years may have similar rates of criminal offending
- Broader societal changes (period effects), which describe the effects of social and economic conditions that can influence crime rates across all age groups
This report begins by exploring the age-crime relationship over time in California. We then examine changes in offending by birth year and age group to see whether patterns have changed for younger generations compared to previous generations. Next, we aim to pinpoint when these shifts began and investigate whether age and broader societal changes are influencing factors as well. We then determine whether differences in offending are due to changes in the number of offenders and/or the frequency of offenders’ arrest incidents. We also consider shifts in youth behavior in recent decades that may be contributing to changes in criminal activity. Finally, we conclude by discussing the policy implications of our results.
Long-Term Trends in the Age-Crime Relationship in California
Our analysis is conducted through the lens of age and crime. Age is one of the strongest predictors of criminal behavior, with crime and age being “one of the most robust relationships in all of criminology” (Rocque, Posick, and Hoyle 2016). Research has consistently found that crime increases in adolescence, peaks in the late teens or early 20s, and then continually decreases.
Two broad factors have been found to contribute to this steadfast relationship. First, biological changes (e.g., brain and physical developments) include changes during adolescence and early adult years in the prefrontal cortex that affect risk-taking, impulse control, emotional maturity, and decision-making, while the aging of our bodies contributes to decreases in risk-taking later in life. Second, life-course events, such as employment, income, marriage, and children, become increasingly relevant with age and make the consequences of possible detection and conviction of committing a crime greater.
Given the influential role of age in predictions about criminal offending and risk assessment, we begin our analysis by examining the arrest rate for violent felonies from the perspective of the age-crime curve over the last few decades. Possible shifts in age-crime curves can provide insights into whether changes in criminal offending are specific to certain ages or represent broader changes experienced by individuals of all ages.
Age-crime curves in California between 1990 and 2010 followed historical patterns, with crime increasing through adolescence, peaking in the early 20s, and then continually decreasing (Figure 1). In addition, the age-crime curve has gradually shifted downward, reflecting the broader decreases in violent crime in California during this period.
However, the most recent age-crime curve (light blue line in Figure 1) looks notably different. In particular, rates of criminal offending now peak among those in their late 20s/early 30s. One possible interpretation is that the relationship between age and crime has shifted, although this would be a departure from a relationship with a long and robust history, as discussed above. However, this explanation is unlikely because the difference between the 2019 age-crime curve and the earlier ones is driven by the notable drop concentrated among juveniles and young adults. For example, the violent felony arrest rate dropped from 1,299 in 2010 to 689 in 2019 among 18-year-olds. This 47 percent decrease is even more striking given that the overall violent felony arrest rate for adults 18–52 increased somewhat over this period.
Another, more likely, interpretation of this change in the age-crime curve is that more recent generations may be less likely to commit crimes compared to earlier ones. That is, the continued increase in criminal offending throughout most of the 20s age range in the 2019 age-crime curve may partly be a consequence of the notable drop in the violent felony arrest rate of juveniles and the youngest adults in recent years, as opposed to people having increasing offending rates through their 20s. These young individuals in 2019 were born in the mid-1990s and later, while those in their mid- to late-20s in 2019 were born about a decade earlier. We explore the possibility that the decline in the offending rate among juveniles and young adults is due to generational differences further in the next section.
Driven by decreases in crime among juveniles and young adults, the most recent age-crime curve looks notably different from earlier ones
Violent felony arrest rate

SOURCE: Authors’ calculations using data from California Department of Justice, Automated Criminal History System, 1990–2019.
NOTE: Figure shows age-crime curves as measured by the violent felony arrest rate (annual number of violent felony arrests per 100,000 residents) by year and age.
Are Younger Generations Committing Less Crime?
There are several policy implications that follow if younger generations are less criminally active than older generations. Unlike broader and oftentimes temporary fluctuations in crime that occur due to changes in economic and social conditions, generational changes in criminal activity may point toward longer-term shifts in future criminal justice capacity needs, as well as a need to incorporate birth years in risk assessment tools to reduce inaccurate predictions.
To shed light on this question, we begin by examining the age distribution of the violent felony arrest rate over time. Since it is unclear whether juvenile arrests are consistently included in the ACHS data, we limit our analysis to adults only.
The share of violent crimes committed by young adults between the ages of 18 and 22 has dropped considerably. As Figure 2 shows, after reaching a peak of 32 percent in the mid-1980s, this age group made up around a quarter of violent crimes committed by adults from 1989 to 2009 (ranging from 23% in 1994 to 27% in 2009). However, in 2014, this share dropped to 21 percent, and by 2019, it was down to slightly below 16 percent.
These changes are to some extent driven by broader demographic changes in the age distribution of the population in California. For example, 18- to 22-year-olds made up almost 18 percent of the population between the ages of 18 and 52 in 1984 but only slightly more than 13 percent in 1994 (Technical Appendix Figure A2). Likewise, the increase in the share of young adults ages 18–22 between 1994 and 2009 (from 13.4% to 14.9%) contributed to that age group’s rising share of violent felony arrests. However, the share of the youngest adults in the population increased somewhat between 2009 and 2019 (from 14.9% to 15.9%), making the 9 percentage point decrease in their share of violent felony arrests even more striking. Furthermore, if there were a shift in the underlying age-crime relationship, with a continued increase in criminal offending beyond the early 20s, we would expect the share for the next-youngest age group to increase, but the figure shows that this was not the case. Instead, the share for 23- to 27-year-olds decreased very slightly in 2019 to 21 percent, from 22 percent in 2014.
The share of violent felony arrests for young adults dropped notably over the last decade
Share of violent felony arrests, adults 18–52 (%)

SOURCE: Authors’ calculations using data extracted from California Department of Justice, Automated Criminal History System, 1984–2019.
NOTE: Figure shows the share of all violent felony arrests of adults between 18 and 52, by age group.
Since changes in the population’s age distribution over time contribute to the age distribution of offenders, as seen above, next we turn to arrest rates, defined as the number of arrests per 100,000 individuals by age group, and examine how they have changed over time by selected age groups.
Figure 3 shows violent felony arrest rates from 1990 to 2020 by select ages (18, 25, 30, 35, and overall for 18- to 52-year-olds). This provides a somewhat different perspective of the age-crime relationship. Importantly, it highlights if there are any changes to offending compared to other ages and the overall violent felony arrest rate, and if applicable, when those differential trends occur. As the birth year is simply the difference between year and age (year – age), we can also identify when, if any, birth-cohort changes begin.
Between 1990 and 2008, the data shows that the violent felony arrest rates among 18-, 25-, 30-, and 35-year-olds, as well as the overall rate, roughly follow the same broad trends. Namely, crime rates are highest (of these age groups) among 18-year-olds, followed by 25-, 30-, and 35-year-olds. However, in 2008, this pattern shifted. Unlike the other groups, 18-year-olds had a notable drop in their violent felony arrest rate (orange line in Figure 3) in 2008, and by 2012, their rate fell below that of 25-year-olds. By 2014, it was below that of 30-year-olds, and by 2016, below the rate of 35-year-olds. By 2018, quite remarkably, the arrest rate for violent felony crimes was lower for 18-year-olds than the overall rate for adults. These changes go against historical trends that have been observed for decades; previously, the rate for 18-year-olds had never fallen below the rates for the older age groups examined here.
We also see that starting in 2015, the rate for 25-year-olds (dark blue line in Figure 3) also declines, while that of 30-year-olds (light green line) continues to increase. In other words, the trends start to deviate from previous patterns among more recent generations—those born after 1990. Among 30-year-olds, we likewise see the beginning of a downward trend for those born in 1990 in the last year of data, 2020.
Criminal offending rates among 18-year-olds are now below that of individuals in their 30s
Violent felony arrest rate

SOURCE: Authors’ calculations using data from California Department of Justice, Automated Criminal History System, 1990–2020.
NOTE: Figure shows the violent felony arrest rate (annual number of violent felony arrests per 100,000 residents) by selected age groups and the overall rate for adults 18–52, by year.
The above discussion reveals notable recent changes in the age-crime curve. Decreases in criminal offending among young adults over the last decade suggest lower crime rates among more recent generations, those born after 1990, compared to earlier generations. We next take a closer look at these trends to determine the role of generational shifts, if any, in these patterns.
Multiple Factors Contribute to Changes in Criminal Offending
While the above patterns are consistent with decreases in criminal offending among more recent generations, other factors may also contribute. As noted in the introduction, potential factors include the age-crime relationship (age effects), generational changes (birth-cohort effects), and broader societal conditions (period effects).
We begin our analysis of the role of the above factors by examining violent felony arrest rates by five-year age groups over time, shown in Table 1. We first note that the table mimics what we gleaned from the figures above. The age-crime relationship in California typically follows the historically well-established pattern. In a given year, offending rates usually peak in the earliest young adult years (ages 18–22) and then continually decrease among older age groups. But in recent years, rates show a notably different pattern, with a peak at a later stage in life.
Importantly, Table 1 can also provide valuable insights into the possible role of both broader societal effects (period effects) and generational shifts (birth-cohort effects), as it utilizes the longitudinal aspect of the ACHS data, allowing for tracking of criminal offending by birth cohort. To make that easier to see, we use color codes in Table 1.
For example, the generation born between 1982 and 1986 (shaded in purple), followed expected patterns in the age-crime relationship. This generation was between the ages of 18–22 in 2004, ages 23–27 five years later in 2009, and ages 28–32 in 2014. Offending rates for this birth cohort decreased from 1,455 violent felonies per 100,000 residents in 2004 to 1,167 five years later, dropping again to 957 ten years later, when the cohort was between the ages of 28–32.
Age, generational differences, and societal conditions all contribute to patterns in criminal offending rates
Violent felony arrest rates, by five-year age group, 1984–2019

SOURCE: Authors’ calculations using data from California Department of Justice’s Automated Criminal History System, 1984–2019.
NOTE: Birth cohorts are color coded. For example, the generation born between 1962 and 1966 are shaded in red, those born between 1982 and 1986 are shaded in purple, and those born between 1987 and 1991 are shaded in light peach.
Table 1 also illustrates the influence of period effects on a specific birth cohort. For example, for the birth cohort born between 1962 and 1966 (shaded in red), their offending rates were largest in 1994, when this group was between the ages of 28–32. This cohort’s offending rates grew from 1,054 violent felonies per 100,000 residents in 1984, when they were between the ages 18–22, to 1,214 five years later, peaking another five years later at 1,234. This peak occurred at a later age than would be expected according to the traditional age-crime curve. However, this increase coincided with a widespread surge in violent crime throughout California and the nation in the 1990s. The bottom row of Table 1 also shows that the overall violent felony arrest rate for individuals ages 18–52 soared from 582 to 986 between 1984 and 1994, an increase of almost 70 percent. Put differently, the broad increase in crime represents a period effect that outweighed the historical effect of crime decreasing with age after early adulthood.
After violent crime peaked in the early to mid-1990s, each birth cohort consistently had lower rates of criminal offending as they aged, except we see some relatively small increases with age for the most recent birth cohort (ages 18–22 in 2014). This, however, is a change from very low crime rates and also coincides with a broader increase in violent crime; the table shows that the overall violent felony crime rate increased from 765 to 817 (an increase of 7%). In other words, while much smaller than what we saw in the 1980s and early 1990s, the period effect is countering the age-crime effect. The overall increase between 2014 and 2019 is partly muted by very small absolute increases observed for relatively older individuals, at a point in life when criminal offending has typically flattened out (as can be seen in Figure 1).
Importantly, Table 1 also shows that the only decreases observed between 2014 and 2019 are for the two youngest age groups (ages 18–22, ages 23–27). Among the youngest adults, the notable decrease in the violent felony arrest rate started after 2009, dropping from 1,467 in 2009 (individuals born between 1987 and 1991) to 840 in 2019 (individuals born between 1997 and 2001). This trend is especially notable as the overall rate stayed relatively unchanged over that decade.
Criminal Offending Started to Drop for Individuals Born in the 1990s
The descriptive analysis so far strongly points toward generational declines in criminal offending that have led to lower rates among individuals born in the 1990s and later. We now examine criminal offending by specific year of birth to determine whether the data can indicate the timing of this possible generational shift.
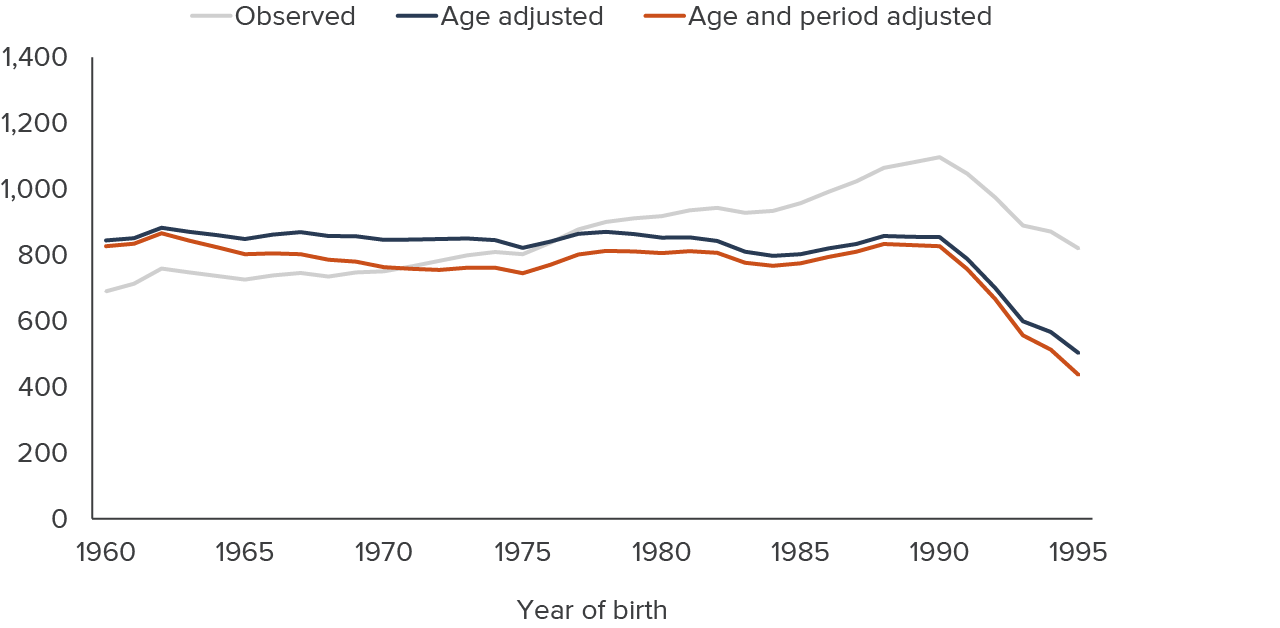
Using a regression framework, we find that after adjusting for period and age effects, criminal offending stayed relatively constant for individuals born between 1960 and the early 1990s, and then dropped notably below that of previous generations. For the most recent generation, those born in 1993 and later, the criminal offending rate is 20 to 25 percent lower than for all previous generations.
To show this, we analyze violent felony arrest rates by year of birth for individuals born between 1960 and 1995. The gray line in Figure 4, which does not account for age or period effects, appears to suggest that criminal offending (for adults ages 18–52) steadily drifted up for individuals born after the mid-1960s, then sharply dropped starting with people born in the early 1990s. However, it is important to note that the age distribution changes across birth years.
Since our data covers criminal offending between 1980 and 2020, we can only track individuals born between 1962 and 1968 for the entire age range of 18–52. For example, for individuals born in 1960, we do not have data from when they were 18 and 19. For those born in 1980, we do not have data for them after age 40, and among those born in 1990, we do not have data after age 30. Since crime tends to peak in the early adult years, we would expect that criminal offending would appear higher for those born later (like in the 1990s) simply because our data does not capture these generations at the time in their lives when individuals typically “age out” of crime.
Given this, we would expect the gray line to continuously increase over the entire range of birth years. However, the increase we observe is limited to individuals born before 1990 and, surprisingly, criminal offending actually decreases for those born in the 1990s.
After staying relatively constant for decades, criminal offending rates started to drop with individuals born in the early 1990s
Violent felony arrest rate

SOURCE: Authors’ calculations using data from California Department of Justice, Automated Criminal History System, 1980–2020.
NOTE: Figure shows the violent felony arrest rate (annual number of violent felony arrests per 100,000 residents) for adults 18–52, by birth year. The age-adjusted line (blue) shows estimated criminal offending rates accounting for age effects (adjusting for age compositional changes across birth year) and the orange line represents rates adjusted for age and period effects (which accounts for broader non-age-specific or birth-year-specific changes in crime). See Technical Appendix B for the fixed effect regression estimates.
When we adjust for age, we find that criminal offending stayed relatively constant across generations for decades, roughly around 1,000 arrests per 100,000 residents (blue line in Figure 4). However, starting with people born in the early 1990s, we see a notable break, with the rate starting to drift down. With no statistically significant difference across all birth years from 1960–1991, the offending rates show a statistically significant deviation for the first time with those born in 1992 (see Technical Appendix Table B1).
We also consider the possible effects of broader societal changes over time, or period effects. We can make some assumption about how broader changes may affect criminal offending by adjusting for five-year interval changes (as opposed to adjusting by each individual year).
Adjusting for both period and age effects shifts the line somewhat but does not meaningfully change the trends across birth years, compared to what we see when we only adjust for age. The orange line in Figure 4 indicates that period effects are relevant to some degree (based on deviations from the blue line). As expected, ignoring period effects overstates criminal offending most for generations that were born in the late 1960s and 1970s and experienced widespread growth in violent crime in the 1980s to the mid-1990s, while they were juveniles and young adults, consistent with Neil and Sampson (2021). While not to the same extent, the figure also shows that accounting for period effects is important for the most recent generation, those born in the early to mid-1990s.
To summarize, we find that generational changes are statistically significant, with people born in 1993 and later 20 to 25 percent less likely to commit crimes than earlier generations. However, it is unclear whether this decrease is driven by reductions in the number of individuals committing crimes or fewer crimes committed by the criminally active population. It is also possible that the changes are driven by fewer individuals who are more criminally active, or the reverse (i.e., more individual offenders but those individuals may commit fewer offenses in a year). Since these possibilities have different policy implications, we explore these questions in the next section.
Fewer Offenders or Fewer Offenses per Offender?
Measures of criminal offending, like the violent felony arrest rate, are defined by the number of recorded incidents per 100,000 residents in a time period (here, a year). This represents a combination of the number of individuals arrested and the number of offenses each individual is arrested for in that time period. However, the unique individual identifiers in our data allow us to identify and calculate each of these two components separately. We can then determine the extent to which the declines in criminal offending for those born after the early 1990s are driven by changes in the number of offenders and/or how criminally active these individuals are.
We begin by examining the number of individuals arrested for a violent felony each year per 100,000 residents—as opposed to the number of arrests in a year, which was the focus of our analysis above. Figure 5 shows that this rate follows the same patterns as the violent felony arrest rate shown in Figure 4. For those born after 1990, we see a notable decline in the number of individuals arrested for a violent felony. Adjusting for age and period effects reveals that controlling for age is especially important and that the number of individuals arrested per 100,000 residents stayed relative stable until the generation born in the early 1990s.
The number of individuals arrested for a violent felony began declining with individuals born in the 1990s
Number of individuals arrested for a violent felony per 100,000 resdients
SOURCE: Authors’ calculations using data from California Department of Justice, Automated Criminal History System, 1980–2020.
NOTE: Figure shows a rate of the number of individuals arrested for a violent felony in a given year per 100,000 residents. As above, we limit this to adults 18–52. The age-adjusted line (blue) shows estimated criminal offending rates accounting for age effects and the orange line represents rates adjusted for age and period effects. See Technical Appendix B for the fixed effect regression estimates.
Frequency of Criminal Offending Has Slowly Been Increasing
Turning to the frequency of criminal offending, as measured by the number of violent felony arrests in a year per individual arrested, we find no evidence of generational shifts, meaning that the generational changes seen above are entirely driven by fewer individuals in the most recent generations committing crimes. A corollary is that those who are criminally active commit slightly more offenses in a year. The data also points toward a broader shift toward higher frequency of offending, not unique to any particular generation.
Figure 6 indicates that the frequency of criminal offending starts to slowly and steadily increase with individuals born in the 1970s. Importantly, there are no sharp changes with the most recent generations. In addition, adjusting for age does not change the patterns (comparing gray and blue lines) but adjusting for broader changes in violent offending, or period effects, does—implying that broad societal factors are responsible for roughly half of the increase in offending between individuals born in the early 1960s and those born in the early to mid-1990s. Figure 6 also shows that the number of violent felony arrests was on average slightly above 1.1 arrests per year for individuals born in the 1960s, increasing to about 1.15 violent felonies per year on average for the most recent birth years.
Put differently, our analysis shows that the number of arrests per person has been ticking up, even for the younger generation, even though the prevalence of criminal offending itself has gone down for this group. As this appears to be part of a broader trend, we next turn to determining when this change began.
The number violent felonies per individual arrested is slowly increasing with year of birth
Violent felony arrests per individual arrested

SOURCE: Authors’ calculations using data from California Department of Justice, Automated Criminal History System, 1980–2020.
NOTE: Figure shows the number of violent felonies per individuals arrested in a year. As above, we limit this to adults 18–52. The age-adjusted line (blue) shows estimated criminal offending rates accounting for age effects and the orange line represents rates adjusted for age and period effects. See Technical Appendix B for the fixed effect regression estimates.
Both the violent felony arrest rate and the number of individuals arrested for a violent felony fluctuated notably between 1980 and 2020, doubling between the early 1980s and the mid-1990s. Then both decreased in most years until 2013, after which both measures drifted up somewhat (Figure 7).
In contrast, the number of times an offender was arrested in a year displayed much less variation, except for a relatively moderate but steady increase over the last decade. From 1980 to 2010, the number of times an offender was arrested in a year stayed in a rather narrow band between 1.09 (observed in 1999) and 1.14 (1980). It has increased modestly, by about 5 percent, over roughly the last decade, reaching 1.18 in 2019. When we examine these changes by age (Technical Appendix Figure A3), we see similar trends across age. Putting it all together, this points toward a broader increase over the last decade in the number of violent felonies per individual arrested, and no generational shift in this measure.
The number of violent felonies per individual arrested has steadily increased over the last decade

SOURCE: Authors’ calculations using data from California Department of Justice, Automated Criminal History System, 1980–2020.
NOTE: Figure shows the number of individuals arrested for a violent felony in a given year per 100,000 residents (orange line), and the number of violent felonies per individuals arrested in a year (blue line). As above, we limit this to adults 18–52.
Lastly, the finding that the average number of violent felony arrests per arrested individual increased over the last decade could theoretically be driven by increases in law enforcement targeting more serious offenses, like violent felonies, especially during a time when the state implemented less punitive criminal justice reforms, like realignment and Proposition 47. There has also been a coinciding decrease in police officers in California. The number of patrol officers decreased from 72,000 in 2008 to 66,700 in 2020. As a result, while the number of total arrests per officer decreased over the last decade, the number of violent felony arrests has stayed constant. This suggests that changes in policing are not a driving factor behind the recent increases in frequency of the number of violent felony arrests per arrested individual.
Coinciding Changes in Youth Behavior
Determining causal factors of the generational declines in criminal offending is beyond the scope of this report, but here we examine some broader changes that may have contributed to the patterns and changes we observe. Recent research finds that people’s surrounding environments during preadolescence and adolescence, defined by both crime-related outcomes (such as crime rates, policing, and incarceration) and shared social conditions, have significant impacts on future criminal behavior in late adolescence and early adulthood (Shen et al. 2020; Neil and Sampson 2021; Sampson and Smith 2021). Building on this, we examine trends in the broader social environment that might be affecting youth criminal behavior (see Sampson and Smith 2021).
Teens’ Risky Behaviors Have Decreased, while Screen Time Has Gone Up
Research on youth behavior is finding evidence of notable changes in the 2000s. For example, nationwide data finds less risky behavior, such as drinking alcohol and drug use, among youth in recent decades than in the 1990s. After fluctuating within a relatively narrow band between 28 percent and 32 percent since 1990, the share of 12th graders who reported binge drinking (consuming five or more drinks in a row) in the past two weeks started to trend downward in the mid-2000s, and by 2019 was down to 14.6 percent (Figure 8). We see similar patterns for 10th graders and when we examine trends in regular alcohol consumption. The downward trend started in the early to mid-2000s, meaning that the decline began with children born after 1990. Similarly, after a decade of about a fifth of 12 graders reporting having ever used illicit drugs other than marijuana, this percentage started to decline in the mid-2000s and was slightly above one in ten in 2019 (see Technical Appendix Figure A4).
Alcohol consumption among teens is down notably

SOURCE: Authors’ calculations using data from Monitoring the Future Study, University of Michigan.
The teenage birth rate (another measure of risky behavior) in the US has also decreased and is now a third of what it was in 1980 (Technical Appendix Figure A5). While the teenage birth rate increased in the 1980s, it then declined in the 1990s, and by 2000, it was slightly below what it was in 1980 (down to 48 teenage births per 1,000 teenage girls, from 53). The teenage birth rate dropped by 28 percent between 2000 and 2010 and then by an additional 55 percent (to a rate of 15) between 2010 and 2020.
Teens have also significantly shifted how they spend their time. The share of high schoolers spending three or more hours per day at home playing videogames or on computers increased from 21 to 22 percent in the early 2000s to 46 percent in 2019 (Technical Appendix Figure A6). The Pew Research Center reports a drop of 16 percent in time spent socializing in person—including in-person hangouts, partying and entertainment, and sports and extracurricular activities—among 15- to 17-year-olds between 2003–2006 and 2014–2017 (Livingston 2019).
Higher school enrollment rates and educational attainment may also have contributed to decreases in juvenile and young adult criminal offending. Research consistently finds that increases in educational attainment and school enrollment lowers criminal offending rates (Lochner 2020). In California, the share of 18- to 22-year-olds enrolled in school has been ticking up over the last few decades, increasing from 49 percent in 1990 to 62 percent in 2021. The average number of years of schooling completed for 25-year-olds increased from about 12 years to slightly below 14 over the same period (see Technical Appendix Table A2).
While far from conclusive, many of these changes in adolescent behavior—during an especially influential time that the research finds affects future criminal offending—seem to have started for individuals born in the early 1990s. The changes in risky behavior and how time is spent among adolescents are plausibly associated with fewer opportunities and less temptation to commit crimes. If so, these changes would then contribute to the declines in violent felony arrests that we see among younger generations.
Conclusion
Motivated by recent findings that juveniles and young adults are the driving factor behind much of the drop in arrests over the last decades in California (Lofstrom et al. 2018), we examine whether criminal offending among younger generations has declined compared to previous generations. To do so, we extracted data on all arrests in California between 1980 and 2020 in the California Department of Justice’s Automated Criminal History System (also known as the “rap sheet”), using arrests for violent felonies as our measure of criminal offending.
Our analysis is conducted through the lens of the age-crime relationship, with a focus on violent offenses. Criminal offending changes as people age and is traditionally found to steadily decrease after peaking in the early 20s. At the same time, criminal behavior is subject to broader changes due to social and economic conditions (known as period effects), as well as when individuals are born (generational or birth-cohort effects), due to the shared environments among individuals born in the same or adjacent years. The latter has recently been found to be of great consequence in criminal behavior, even for individuals whose births are separated by 10 years (Kim, Bushway, and Tsao 2016; Neil, Sampson, and Nagin 2021; Sampson and Smith 2021). These influential studies have been limited to pre-2010 data for New York state (Kim et al. 2016) or a sample of individuals born in Chicago (Neil et al. 2021; Sampson and Smith 2021), underlining the policy relevance of our study, which includes the full set of adult arrests from 1980–2020 from a large state.
We find that the violent felony arrest rate for the youngest adults (ages 18–22) in California dropped by more than 50 percent over the last 25 years. This drop is even more remarkable because the rate for adults in their late 30s and older increased over the same period. As a result, after representing about 25 percent of violent felonies among adults for decades, young adults are now responsible for 16 percent of these offenses.
When examining criminal offending by birth year, we find a notable decrease beginning with individuals born in the early 1990s. After making statistical adjustments for age and period effects, the violent felony arrest rate stayed constant for individuals born in the 1960s through the 1980s and started to decline with those born in 1990. For those born in the mid-1990s, we see a statistically significant drop in criminal offending of 20 to 25 percent compared to earlier generations.
This decline in criminal behavior is driven by fewer individuals arrested for violent felonies. Notably, when we examine the number of violent felony arrests in a year per arrested individual, we see an increase of about 5 percent over roughly the last decade. That is, while the violent felony arrest rate has declined among younger generations, the frequency of offending has been gradually increasing over the last decade across age groups and generations. The magnitude of the increase is arguably modest, but the deviation from decades-long patterns is noteworthy and deserves further attention.
Our age-crime analysis suggests that the most recent generation may well continue to follow historical patterns, with a peak in criminal offending in the early 20s. What is unknown at this time, given the recency of the generational shift, is whether criminal offending will decrease at the same rate through life as before. And while the data so far reveals no evidence of a reversal of the decline in offending among more recent generations, we note that it is a future possibility, and efforts to continue to track and monitor the patterns reported here are important. Furthermore, as we limit our study to violent offenses, the extent to which our findings hold for other types of crime is unknown at this time, and studies aimed at filling this gap would be valuable.
Our study does not aim to identify the reasons behind the generational shifts in criminal offending, but we find that the decrease does coincide with changes in some teen behavior, with reductions in several measures of risky behavior (like alcohol consumption, drug use, and teenage pregnancy) among more recent generations. These changes also align with changes in how teens spend their time, including more time spent playing video games and being on a computer, less time socializing in person, as well as higher school enrollment rates and greater educational attainment.
While far from conclusive, many of these changes in adolescent behavior seem to have started for individuals born in the early 1990s and have occurred during a time in life that research finds especially influential for criminal offending. The changes in risky behavior and how time is spent among adolescents are plausibly associated with fewer opportunities and less temptation to commit crimes, and the effects may be lasting.
This is not to suggest that juvenile justice reforms and broader criminal justice reforms have not contributed to the decline in criminal offending established here. However, the timing of the changes in arrests and crime among juveniles and young adults do not line up very well with the reforms. The decrease in offending rates among juveniles and the youngest adults started before California embarked on a string of significant criminal justice reforms in 2011 with realignment. Key juvenile justice reforms like Senate Bill 681 (1996) and Senate Bill 81 (2007) are more plausible contributors, but the trend of declining criminal offending among juveniles and young adults is not unique to California.
Building on the findings and observations in this report, future research aimed at determining specific contributing factors to the generational shifts, and whether the changes are persistent, would be of broad and significant value and policy relevance.
Our findings have several policy implications. The decrease in criminal behavior among more recent generations suggests the possibility of lower future capacity needs in the criminal justice system. That is, if these changes persist, it is possible that law enforcement may need to make fewer arrests, criminal courts may be required to handle fewer cases, and jails and prisons may need less space for a smaller population. The latter may be especially relevant, as the prison population has dropped dramatically (down from its peak of 173,000 in 2008 to 96,000 today) and the state is in the process of closing several prisons. It is also possible that the generational shift is one reason California’s prison downsizing through reforms like realignment and Proposition 47 did not lead to increases in violent crime (Lofstrom and Raphael 2016; Bartos and Kubrin 2018; Dominguez, Lofstrom, and Raphael 2022).
Although we find that the decline in offending is driven by a drop in the number of offending individuals, the frequency of offending is up somewhat, which suggests the possible need for new and/or alternative approaches to reduce crime among a plausibly more challenging-to-rehabilitate offender population. With realignment and, perhaps especially, the recent closure of the state’s Division of Juvenile Justice, these challenges increasingly fall on county probation departments. Their ability to offer effective rehabilitation programs likely differs across counties as resources and experience with serious juvenile offenders vary. Chief probation officers as well as juvenile justice advocates have raised concerns about the transition after the closure of state facilities. From both public safety and programming perspectives, these changes will require close monitoring and evidence-based research to determine effective approaches.
Lastly, but importantly, age is a key factor in assessing individuals’ risks of future offending, including in pretrial detention risk assessments and the widely used Correctional Offender Management Profiling for Alternative Sanctions (COMPAS) risk assessment instrument. Our findings of notable recent generational shifts suggest that these predictions may be inaccurate, overpredicting risk for individuals born in the 1990s and later, a concern also raised by Neil, Sampson, and Nagin (2021). Adjusting those instruments to account for not only age but also lower offending rates among more recent generations would reduce inaccurate predictions.
Topics
Criminal Justice