
- Although K–12 enrollment is declining, schools will need funds for modernization and construction.
California’s public schools serve more than 6 million students at 10,000-plus schools in more than 300,000 classrooms—70% of which are more than 25 years old. Statewide enrollment has declined by more than 93,000, or 1.5%, from its 2005 peak of 6.32 million. By 2022, the student population is expected to fall to 6.16 million. Even so, schools statewide are projected to need about $117 billion for facilities by then. About 69% of that amount is needed for school maintenance and modernization—updating science labs and adding computers, for example—while only 10% is needed to keep pace with enrollment or address overcrowding. - School construction and maintenance are funded mainly by state and local bonds.
Both the state and local school districts issue bonds to pay for school facilities. The state’s School Facility Program provides grants to school districts that cover half of the cost of new construction projects and a larger share for modernization. The number of local bonds proposed—as well as the passage rate—has been higher since 2000, when California voters passed Proposition 39 to lower the share of votes needed to pass local school bonds from two-thirds to 55%. Local bonds are not uniformly distributed across the state—they are especially popular in the San Francisco Bay Area. - The state’s “first come, first served” approach tends to benefit wealthier school districts.
The School Facility Program processes applications for matching funds in the order they are received. Smaller, wealthier districts tend to have an advantage in securing school facilities funding: their higher property values generate more revenue for bonds and expenditures—and also for staff dedicated to applying for state funding. In the past, temporary adjustments have provided funding for large urban districts; as a result, more state funding has gone to districts in the Central Valley and in Southern California than to districts in the San Francisco Bay Area. - Local bond funding has greatly outpaced state bonds.
Proposition 55 in 2004 and Proposition 1D in 2006 provided $16.8 billion in K–12 school facilities funding. The funding largely went toward new construction, modernization, and reductions in overcrowding. Most state bond funding was exhausted in 2012, leaving a small amount available only for specialized programs, such as sustainability upgrades. Over the same time frame—from 2004 to 2016—local school districts proposed 1,018 bond initiatives and voters passed 83% of them, approving $91.1 billion in funding of their own.
State funding is more evenly distributed and much lower than local bond funding
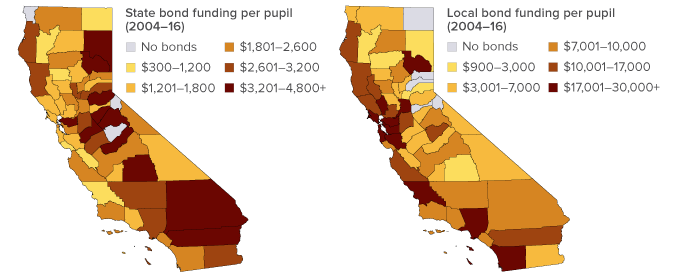
SOURCE: California Department of Education; Office of Public School Construction; California Debt and Investment Advisory Commission.
NOTES: State bond funding includes only funding from Proposition 55 (2004) and Proposition 1D (2006). State bond funding was exhausted in 2012.
- In 2016, Californians approved the first state school construction bond since 2006.
In November 2016, Californians passed Proposition 51 (55% yes, 45% no), a statewide school bond measure that authorized $7 billion in general obligation bonds for the construction and modernization of public school facilities (and $2 billion for community college facilities). Proposition 51 was the first statewide school bond passed since Proposition 1D in 2006 and the first one that was not placed on the ballot by the legislature. Though Governor Brown expressed concern over accountability for how it would be spent, his proposed 2017–18 budget included $594 million in Proposition 51 bond money, according to the Legislative Analyst’s Office. - More than 200 local school bond measures passed in 2016, as Californians continue to favor them.
In 2016, Californians across the state voted on 205 local school bond measures, of which 94% passed; more than $18.8 billion in local bonds for K–12 facilities was approved. In PPIC Statewide Surveys since 1999, at least 6 in 10 Californians have said they would vote yes on a local bond for school construction projects. In our April 2017 survey on Californians and education, support for local bonds remained high, with 68% of adults and 58% of likely voters saying they would support a local bond for school construction.
In 2016, a large number of local bond measures were proposed and the passage rate was especially high
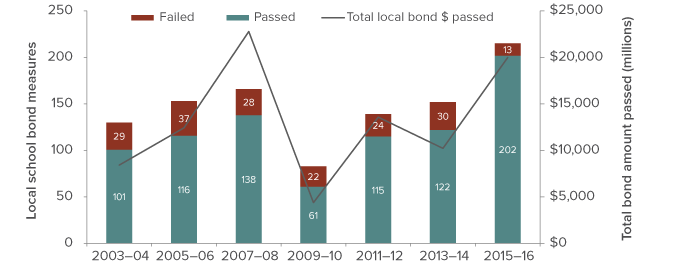
SOURCES: California Office of the State Treasury; California Debt and Investment Advisory Commission; Debt Issuance and Election Data.
NOTE: Yearly numbers of local state bond measures include general, primary, and special elections.
Topics
K–12 Education