
- Californians across the state experience financial strain from their housing costs …
According to a recent report from the California Department of Housing and Community Development, California’s homeownership rate is the lowest it has been since the 1940s, and nearly one in three renter households spend at least half of their income on rent. The PPIC Statewide Survey found that 47% of Californians—including at least four in ten across regions—say housing costs place a financial strain on themselves and their families. Renters are more likely than homeowners to say their housing costs cause financial strain (61% to 30%), and more than a third of renters say they face a lot of financial strain (36%). Similarly, around a third of Californians age 18 to 34 (33%) and those age 35 to 54 (29%) experience a lot of financial strain due to housing costs (18% 55 and older). More than half of Latinos (55%) and African Americans (54%) report financial strain due to housing costs, compared with 48% of Asian Americans and 39% of whites.
Personal financial strain from housing costs
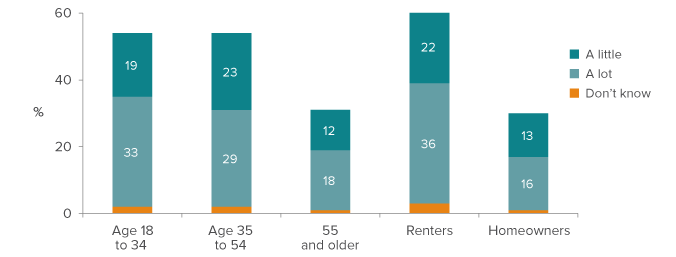
SOURCE: PPIC Statewide Survey, May 2017. The margin of error for all adults for each survey is ±3.2%. The margins of error for subgroups are larger.
- … but perceptions of housing affordability vary regionally.
Seventy-nine percent of San Francisco Bay Area residents say housing affordability is a big problem in their area, compared to 35% in the Central Valley (63% Los Angeles, 59% Orange/San Diego, 46% Inland Empire). Homeowners (59%) and renters (60%) are equally likely to see housing affordability as a big problem; responses are also similar across age groups. At least half across racial/ethnic groups say housing affordability is a big problem, with African Americans (74%) and whites (65%) most likely to say so. College graduates (68%) and those with household incomes of at least $40,000 (65%) are the most likely to say it is a big problem.
Perceptions of housing affordability
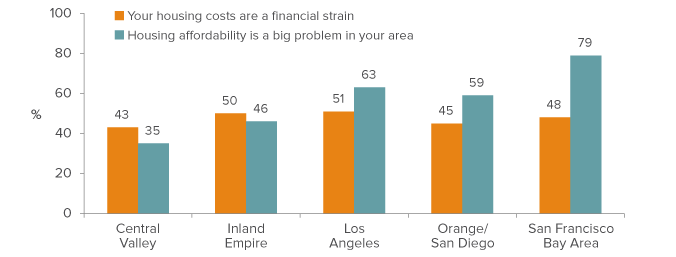
SOURCE: PPIC Statewide Survey, May 2017. The margin of error for all adults for each survey is ±3.2%. The margins of error for subgroups are larger.
- One in three seriously consider leaving the state because of housing costs.
Thirty-three percent of Californians say the cost of their housing makes them seriously consider moving out of the state, and an additional 10% consider moving elsewhere within California. Residents of coastal counties are more likely than residents of inland counties to consider relocating (48% to 37%). A majority of adults age 18 to 34 say their housing costs make them consider moving (54%), including 38% who say they would leave the state. More than half of renters (56%) consider leaving their part of California, compared to a third of homeowners (33%). African Americans (52%) are most likely to say their housing costs make them seriously consider moving, followed by Latinos (47%), whites (44%), and Asian Americans (35%).
Seriously consider moving because of housing costs
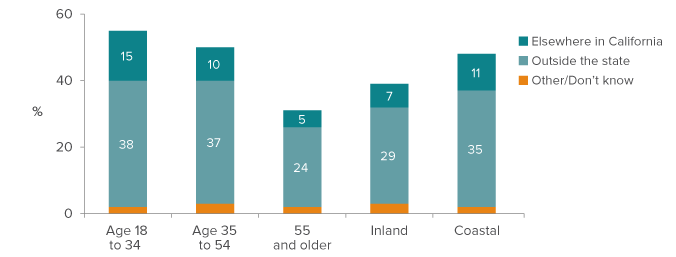
SOURCE: PPIC Statewide Survey, September 2017. The margin of error for all adults for each survey is ±3.1%. The margins of error for subgroups are larger.
- Strong majorities favor an affordable housing bond; fewer want a real estate transaction fee.
Seventy percent of adults and 57% of likely voters say they would vote yes on a state bond measure to pay for affordable housing projects. Eight in ten Democrats (81%) are in favor, followed by six in ten independents (61%) and a third of Republicans (34%). Forty-six percent of adults and 44% of likely voters support a $75 fee on real estate transactions, with a cap of $225 per transaction, to fund affordable housing projects. A solid majority of Democrats (61%) are in favor, while majorities of independents (53%) and Republicans (80%) are opposed. Renters are more likely than homeowners to favor either a state bond or the real estate transaction fee, but even among renters, support is much higher for a bond. - Solid majorities support regulatory changes and want more housing in their area.
Sixty-one percent of adults favor changing California’s environmental regulations and local permitting process to make housing more affordable. Among likely voters, 47% are in favor and 39% are opposed. Majorities across parties and regions favor this proposal. At least two in three renters and adults age 18 to 54 support these changes, compared to half of homeowners and adults 55 and older. When asked about building more housing in their city or community to meet current housing needs, 64% of Californians are in favor. That includes solid majorities in the Central Valley (72%), the San Francisco Bay Area (70%), Los Angeles County (63%), and Orange/San Diego Counties (60%), and nearly half in the Inland Empire (48%). Renters are much more likely than homeowners to favor more housing construction (73% to 55%). Seventy-seven percent of Latinos, 69% of African Americans, and 64% of Asian Americans support building more housing in their local areas, compared with 53% of whites.
Favor building more housing in your city or community
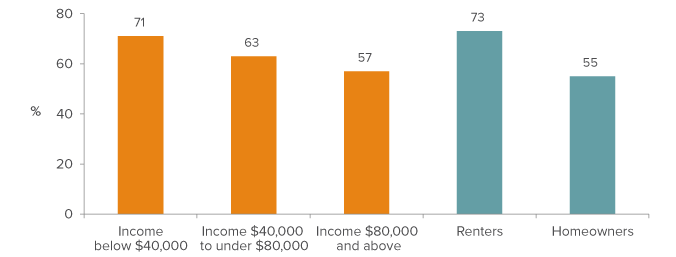
SOURCE: PPIC Statewide Survey, September 2017. The margin of error for all adults for each survey is ±3.1%. The margins of error for subgroups are larger.
Support for three housing proposals
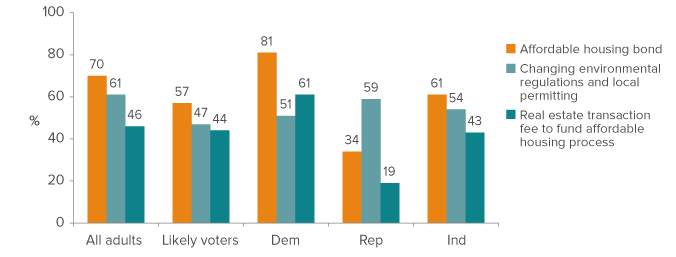
SOURCE: PPIC Statewide Survey, May 2017 and September 2017. The margin of error for all adults for each survey is ±3.1% to ±3.2%. The margins of error for subgroups are larger.
Topics
Statewide Survey