Summary
With the 2020 presidential election fast approaching, attention turns to how public views may shape the outcome. California is often considered quite liberal, with strong support for the Democratic Party-but the state encompasses many people with differing political views. In this report, we examine California’s political geography to inform discussion for this election season and beyond.
Our findings suggest the state continues to lean Democratic and Donald Trump is unpopular virtually everywhere. As California leans more Democratic in general, conservative Democrats are becoming rarer even in the places where they used to be common; meanwhile, independents, also known as No Party Preference voters, are leaning slightly more Republican in many parts of the state. However, many issues have their own geographic patterns:
- Most Californians from coast to interior feel their taxes are too high, and Californians almost everywhere believe immigrants are a benefit to the state.
- Concern about the cost of housing shows sharp divides between the coast and the interior, though Californians are concerned in most parts of the state.
- Support for the Affordable Care Act (Obamacare) is lukewarm in most places.
Even as support for the Democratic Party has strengthened in general, and opinions on some policy issues have grown more polarized in parts of the state, a closer look indicates that registering all eligible residents to vote might actually moderate the more strongly partisan places.
Broad Geographic Patterns
Today, California is widely understood to be a solidly Democratic state. All statewide elected officials are Democrats, including both United States senators and the governor. No Republican has been elected statewide since 2006. Democrats also hold supermajorities in both chambers of the legislature and represent all but 7 of the state’s 53 congressional districts. Democrat Hillary Clinton won 62 percent of the presidential vote against Republican Donald Trump in 2016.
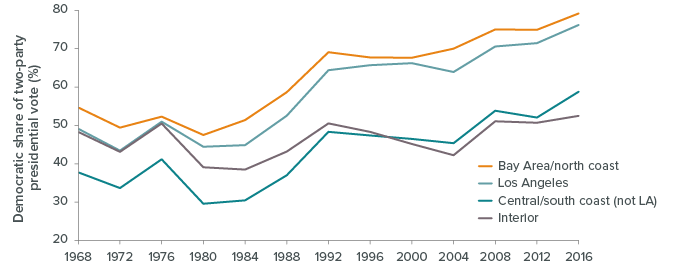
The state was not always so Democratic, and for many years voted Republican for president. Moreover, many areas have continued to vote Republican even as the state as a whole has grown more Democratic. Figure 1 shows the two-party vote (i.e., excluding minor parties) for president by four different regions: the Bay Area and north coast, Los Angeles County, other portions of the central and south coast outside of LA, and the remaining interior of the state. The interior votes about as Republican now as it did in the late 1960s, while the Bay Area and Los Angeles have grown markedly more Democratic. The central/south coast started out as the most Republican region but has slowly trended in a Democratic direction. For a while this brought its voting in line with the interior region, which started out more Democratic but has also changed less over time, leaving it slightly Republican overall. These trends created a bifurcated state: Los Angeles and the Bay Area/north coast supported Democrats, while everywhere else went far more Republican than those areas.
This status quo shows signs of cracking. In 2016, the central/south coast separated from the interior and became more Democratic, following Bay Area and Los Angeles trends, albeit with lower overall Democratic support. The shift in this region has large electoral consequences because the two-party vote for the central/south coast hovers around 50 percent. In fact, Democrats won new seats in 2018, and many of them came from the central/south coast.
Figure 1. The Bay Area and Los Angeles are the most Democratic, but the central/south coast is trending that way
SOURCE: California Secretary of State.
NOTES: Trend lines show the Democratic share of votes cast in each presidential election (excludes third-party candidates). “Bay Area/north coast includes Alameda, Contra Costa, Humboldt, Lake, Marin, Mendocino, Napa, San Francisco, San Mateo, Santa Clara, Santa Cruz, Solano, and Sonoma Counties. “Central/south coast (not LA)” includes Monterey, Orange, San Benito, San Diego, San Luis Obispo, Santa Barbara, and Ventura Counties. “Los Angeles’ includes only Los Angeles County, and “Interior” includes all other counties.
In Figure 2, we break apart these regions into “places’ for 2016. Places are mostly counties, but we split some larger counties for nuance and combined smaller ones where data were sparse. These places reveal variation deeper inside each region’s geography. Central LA is more Democratic than the rest of LA County, while the far East Bay (across the hills from cities like Berkeley, Oakland, Hayward, and Fremont) is less Democratic than the rest of the Bay Area. Northern San Diego County is less Democratic than the rest of the county, while the mid/northern Central Valley is more Democratic than the southern portion. Shasta County, in the far north, is an outlier in its support for Trump.
Figure 2. The land area of the state is evenly balanced between the two parties

SOURCE: California Statewide Database (presidential vote by precinct).
NOTE: Shading reflects share of votes cast for Hillary Clinton in the 2016 presidential election (third parties excluded).
In Figure 2, California appears balanced between red and blue areas. But if we adjust the map so that places with more eligible residents take up more space, the blue places with large Democratic cities dominate the map, as shown in Figure 3. The interior may hold a majority of the state’s territory, but it accounts for a small fraction of its voting population.
Figure 3. The state is more Democratic when distorted to reflect number of eligible residents

SOURCE: California Statewide Database (presidential vote by precinct).
NOTE: Shading reflects share of votes cast for Hillary Clinton in the 2016 presidential election (third parties excluded).
Party Strength
Party commitments are more nuanced than we can observe through the presidential vote alone. Some party registrants do not fit the party line, such as registered Democrats who are conservative or registered Republicans who are liberal.1 In fact, “no party preference” (NPP), California’s version of independent, is the fastest-growing registration category.
Independents can be divided into those who “lean” toward either the Democrats or the Republicans on the one hand, and “pure” independents who remain in the middle even when pressed to choose one side or the other. Leaners behave like partisans in many ways. They vote consistently for their preferred party across different offices in a single election and between elections over time (Keith et al. 1992). The difference between the share of independents who lean Democratic and the share who lean Republican has consistently favored Democrats by 10 to 15 percentage points, and there is little sign of any trend over time (see technical appendix Figure C1).
The rate of dissenting Democrats and Republicans has also changed little. While there have always been more conservative Democrats than liberal Republicans, few of either exist (see technical appendix Figure C2). However, conservative Democrats are becoming slightly less common since 2016, consistent with the idea of growing partisan polarization, with ideology and party identification increasingly aligned.
Figure 4 maps the balance of leaners across the state using 12 Statewide Surveys over the last two years, totaling about 20,000 respondents. The balance tilts Democratic in most places, with the Bay Area and central and coastal LA having the strongest tilt, but the pattern has become somewhat more polarized. In earlier work (McGhee and Krimm 2012), independents leaned Republican in only 2 places; now they lean Republican in 11 places. Likewise, independents in the most Democratic places now tilt even more Democratic. This is consistent with the idea that many who now identify as independents might have identified with the dominant party of their area in the past.
Figure 4. Independents lean Democratic in most places around the state

SOURCES: PPIC Statewide Surveys (March, May, July, September, October, November, December 2018; January, March, May, July, September 2019) (public opinion data); Statewide Database (elections data for modeling); National Health Insurance Survey (cell phone data for weighting); IPUMS American Community Survey 2017 (Census data for weighting).
NOTE: Shading represents the share of independents who lean Democratic minus the share who lean Republican. Estimates come from multilevel regression and poststratification models as described in Technical Appendix A. Full model results can be found in Technical Appendix B.
The geography of party dissent is different for Democrats and Republicans. The share of Democrats who are conservative varies quite a lot across places, and such Democrats are far more common in the Central Valley than anywhere else (see technical appendix Figure C3). By contrast, liberals are a small share of Republicans almost everywhere: such Republicans are about as rare in San Francisco, which has very few Republican registrants overall, as in the southern San Joaquin Valley, where Republican registrants are a plurality of voters (see technical appendix Figure C4). California Republicans appear to vary less in ideology than in number. They share a broad ideological perspective whether they are the dominant partisan group or a small minority.
Fitting with a general story of greater polarization among those who decide to register with a party, a small decline in conservative Democrats of about 5 percent has occurred in the parts of the state where they are otherwise most concentrated (McGhee and Krimm 2012). Increasingly, registered voters are less likely to deviate from party ideology even in places where such deviation used to be more common.
Many California adults are not registered to vote, generally because they have not taken the necessary steps or because they are not citizens and so are not eligible. PPIC’s work on the “exclusive electorate” has shown that these unregistered Californians have different policy views than those who are part of the electorate, especially in favoring a larger and more active government (Baldassare et al. 2019). PPIC has asked unregistered Californians (including noncitizens who cannot legally register to vote) which party they lean toward, and they lean Democratic in virtually every part of the state (Figure 5).
Figure 5. Unregistered Californians lean Democratic in most places around the state

SOURCES: PPIC Statewide Surveys (March, May, July, September, October, November, December 2018; January, March, May, July, September 2019) (public opinion data); Statewide Database (elections data for modeling); National Health Insurance Survey (cell phone data for weighting); IPUMS American Community Survey 2017 (Census data for weighting).
NOTE: Shading represents the share of unregistered Californians who lean Democratic minus the share who lean Republican. Estimates come from multilevel regression and poststratification models as described in Technical Appendix A. Full model results can be found in Technical Appendix B.
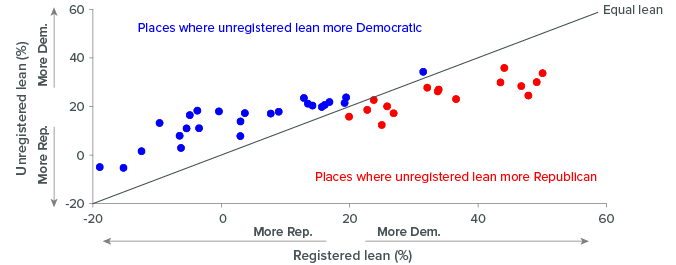
Yet registering everyone might not make the electorate much more Democratic. If we calculate a similar partisan “lean” for all registered voters-that is, subtract the share who are registered Republicans from the share who are registered Democrats-we find more places with strong partisan leans. Among the registered, the total range extends from a 69-point Democratic advantage in central LA to a 23-point Republican advantage in counties along the northern border; among the unregistered, the same range is only 38 points Democratic in San Francisco County to 8 points Republican in Shasta County. Thus, geography would determine the effect of registering every adult in the state, making the electorate more Democratic in Republican places and more Republican in many Democratic places. Figure 6 illustrates this idea by plotting the partisan lean of voters and nonvoters in our places. If voters and nonvoters had the same lean, the points would cluster around the diagonal line in the figure. Instead, they fall in a more Democratic direction on the far left-places where registered voters are more Republican-and in a more Republican direction on the far right-places where registered voters are more Democratic. However, the Republican places tend to be more competitive between the two parties to begin with, so the overall effect of registering everyone would likely benefit Democratic candidates by pushing these competitive areas over to the Democratic side.
Figure 6. Unregistered Californians make Republican places more Democratic and Democratic places more Republican
SOURCES: PPIC Statewide Surveys (March, May, July, September, October, November, December 2018; January, March, May, July, September 2019) (public opinion data); Statewide Database (elections data for modeling); National Health Insurance Survey (cell phone data for weighting); IPUMS American Community Survey 2017 (Census data for weighting).
NOTE: The line shows equivalence: points on or near that line represent places where the unregistered have about the same partisan lean as the registered. Points below that line indicate places where the unregistered lean more Republican on average, and points above the line indicate places where the unregistered lean more Democratic on average.
The final partisan topic we examine is presidential approval. Figure 7 maps the difference between Trump approval and disapproval for each of our 46 places. Red areas have more people who approve than disapprove, while blue areas have the opposite.
The PPIC Statewide Survey has consistently shown Trump’s approval at least 27 points below his disapproval, so it is not surprising to find him underwater in most places throughout the state as well. More surprising is the fact that approval outstrips disapproval in only 5 of our 46 places, representing about 3 percent of the total population.2 This gap between approval and disapproval in California sits above the current national approval gap (approval about 14 points below disapproval) in only 13 places, representing about one-sixth of the population. His numbers are better among registered voters-the gap is positive in 10 places and beats the national average in 19-but the more positive places are still relatively less populated and rural (see technical appendix Figure C5). In fact, Trump’s approval is mixed or negative in many places that voted for him in the 2016 election. If approval equates to votes, then he may struggle to match even his low performance in the state when he was first elected.
Figure 7. Trump's approval is underwater in all but a few very rural parts of the state

SOURCES: PPIC Statewide Surveys (March, May, July, September, October, November, December 2018; January, March, May, July, September 2019) (public opinion data); Statewide Database (elections data for modeling); National Health Insurance Survey (cell phone data for weighting); IPUMS American Community Survey 2017 (Census data for weighting).
NOTE: Shading represents the share of Californians who approve of Trump minus the share who disapprove. Estimates come from multilevel regression and poststratification models as described in Technical Appendix A. Full model results can be found in Technical Appendix B.
Policy Issues
Public opinion is about more than party support; a range of issues animates the state’s politics, and those issues may not link perfectly to party loyalties. A few issue questions have been asked often enough in recent PPIC Statewide Surveys to permit detailed mapping in our places. As with the questions about party strength, we draw on surveys from the last two years, but because these questions are not asked as often we generally have fewer surveys to work with.
The questions we review here cover topics popular in contemporary debate. These include three questions about the size and scope of government: opinions about one’s own tax burden, concern about the state budget, and favorability toward the Affordable Care Act (ACA). Three questions address immigration: abstract feelings about the value of immigrants to California, attitudes about whether California should take action to protect undocumented immigrants, and support for President Trump’s border wall with Mexico. Finally, we review two questions about issues at the top of public discussion: feelings about housing affordability and support for gun control. For our purposes, what is interesting about these questions is how they map onto the state’s geography. Some questions, such as gun control, produce sharp geographic divisions while others, such as feelings about one’s tax burden, do not.
Issues for which Location Does not Matter
Despite the spectrum of people and lifestyles across California, there are some issues where opinion is roughly similar everywhere. Many of these issues touch on the general role of government: its size and scope. At least a majority-but never more than two-thirds-in every place in the state believes taxes are too high (overall, 58 percent hold this opinion; see technical appendix Figure C6 for a map). More politically liberal places like San Francisco or the East Bay are the least aggrieved, but the difference is small. Likewise, 42 percent think the budget situation is a big problem but the number falls in a relatively narrow range of between 40 and 58 percent in all but 11 of our places. (Those remaining 11 have less concern; see technical appendix Figure C7.)
Issues for which Location Plays Some Role
Though taxes and concern about the budget show relatively little geographic variation, one topic that touches on similar issues of government size and scope-opinions of Obamacare’shows more (Figure 8). Support is strongest-between 60 and 70 percent-in the Bay Area and central and coastal LA, and weakest-less than 40 percent-in the rural far north and east of the state. Yet most of our places remain lukewarm toward the law, with support between about 40 and 60 percent. This includes most of the Central Valley and most of the coast outside of central and coastal LA and the Bay Area.3
Figure 8. Support for the Affordable Care Act is concentrated in highly Democratic areas

SOURCES: PPIC Statewide Surveys (May, October 2018; March, September 2019) (public opinion data); Statewide Database (elections data for modeling); National Health Insurance Survey (cell phone data for weighting); IPUMS American Community Survey 2017 (Census data for weighting).
NOTES: Question wording is “A health reform bill was signed into law in 2010, known commonly as the Affordable Care Act or Obamacare. Given what you know about the health reform law, do you have a generally favorable or unfavorable opinion of it?” Shading represents the share of Californians who say they have a favorable opinion. Estimates come from a multilevel regression and poststratification model as described in Technical Appendix A. Full model results can be found in Technical Appendix B.
Immigration is another topic with modest but not high geographic disagreement. Under the Trump administration, immigration has become a key political issue and a flash point between California and the federal government. Californians broadly support a fairly tolerant attitude toward immigrants: 72 percent believe immigrants are a benefit to the state, and 60 percent support the state taking separate action to protect undocumented immigrants. In almost every one of our places, a majority considers immigrants a benefit (see technical appendix Figure C8). Support for a separate state immigration policy shows slightly more variation, falling below 50 percent in 14, mostly rural, places and rising above 70 percent in very liberal places like San Francisco and central LA (Figure 9). Yet outside these places, views are similar throughout the rest of the state.
Even on a highly specific and charged issue related to immigration-President Trump’s proposal for a Mexican border wall-the geographic range of views is surprisingly small. Statewide, only 26 percent of Californians support a new border wall, and only two places (Shasta County and the northern border) demonstrate even bare majority support for the idea (see technical appendix Figure C9).
Figure 9. Most places strongly support state policy to protect undocumented immigrants but there are pockets of weakness

SOURCES: PPIC Statewide Surveys (March, October 2018; March 2019) (public opinion data); Statewide Database (elections data for modeling); National Health Insurance Survey (cell phone data for weighting); IPUMS American Community Survey 2017 (Census data for weighting).
NOTES: Question wording is “Do you favor or oppose the California state and local governments making their own policies and taking actions, separate from the federal government, to protect the legal rights of undocumented immigrants?” Shading represents the share of Californians who say they favor independent action. Estimates come from a multilevel regression and poststratification model as described in Technical Appendix A. Full model results can be found in Technical Appendix B.
Issues for which Location Drives Opinion
Two of our issue questions showed strong geographic disagreement: housing and gun control. On these topics, the dense urban areas of the state hold far different opinions than more-rural areas.
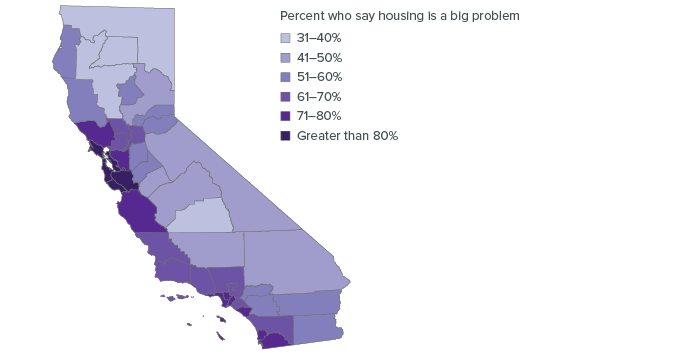
California is in the midst of a housing crisis. The cost of housing is pricing people out of the state and contributes to high poverty rates (Bohn and Danielson 2017). Overall, 67 percent of Californians say that housing affordability is a big problem in their part of the state. Figure 10 reveals clear geographic differences, especially between the coast and the inland areas. In most parts of the Bay Area, concern is remarkably high. This includes the counties of San Francisco (92%), Marin (89%), San Mateo (88%), and Santa Clara (85%), as well as in the East Bay (85%). At the other extreme, concern falls below 40 percent in the most rural parts of the state, suggesting that there remain places in California where neither housing prices nor concern about them has reached elevated levels.
Figure 10. Majorities believe housing is a big problem along almost the entire coastal region
SOURCES: PPIC Statewide Surveys (October 2018; March 2019) (public opinion data); Statewide Database (elections data for modeling); National Health Insurance Survey (cell phone data for weighting); IPUMS American Community Survey 2017 (Census data for weighting).
NOTES: Question wording is “How much of a problem is housing affordability in your part of California? Is it a big problem, somewhat of a problem, or not a problem?” Shading represents the share of Californians who say it is a big problem. Estimates come from a multilevel regression and poststratification model as described in Technical Appendix A. Full model results can be found in Technical Appendix B.
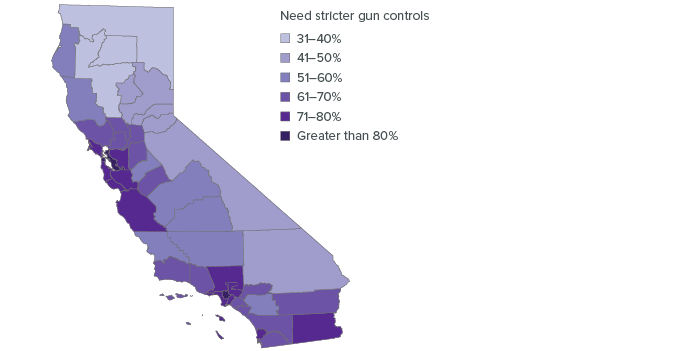
The country (including California) has suffered a string of mass shootings in recent years, which has once again put gun control at the center of political debate. About two-thirds of Californians (68%) have supported stricter gun control laws over the past two years of PPIC Statewide Surveys. Figure 11 shows that this strong overall support masks an extremely sharp geographic divide. In the rural places in the far north and east of the state, support for stricter gun laws falls below 40 percent. In most of the remaining rural areas-along the north coast, the southern San Joaquin Valley, and the Mojave Desert, support falls short of a majority. But support is above 70 percent in most of the Bay Area and all of LA County, and it exceeds 80 percent in the three liberal enclaves of central LA, the East Bay, and San Francisco.
Figure 11. Views on gun control display a strong urban-rural divide
SOURCES: PPIC Statewide Surveys (March, October 2018; September 2019) (public opinion data); Statewide Database (elections data for modeling); National Health Insurance Survey (cell phone data for weighting); IPUMS American Community Survey 2017 (Census data for weighting).
NOTES: Question wording is “In general, do you think laws covering the sale of guns should be more strict, less strict, or kept as they are now?” Shading represents the share of Californians who say laws should be more strict. Estimates come from a multilevel regression and poststratification model as described in Technical Appendix A. Full model results can be found in Technical Appendix B.
Conclusion
Exploring California’s public opinion at a detailed level of geography reveals diversity but also some surprising uniformity. President Trump’s approval rating is lower than his disapproval almost everywhere. There is broad agreement across the state that immigrants are a benefit and that taxes are too high. Liberals are a small share of Republicans everywhere, and signs indicate that Democratic conservatives may be disappearing, even in places where they have been more common.
There are also topics where the geographic divide is more substantial. Concerns about housing, support for stricter gun control, and even Trump’s approval levels vary significantly across the state (though almost all are below 50 percent). Even when the difference in opinion is modest overall, extremes often differ significantly from each other. A core of the Bay Area-Marin, San Francisco, San Mateo, Santa Cruz, and Santa Clara Counties, plus the near East Bay (see technical appendix Figure A1).is consistently liberal across a wide range of issues. It is usually joined by two portions of Los Angeles County: the central county and the coast. These form the base of the state’s liberal, Democratic politics. At the other end of the spectrum, the far north near the Oregon border and the far east near the Nevada border make up a conservative base for the state. Opinions there are more conservative and Republican-leaning than elsewhere on virtually every question considered here.
Though often considered unusually conservative, the Central Valley tends to fall more in the middle range of opinion, and rarely stands out by itself on questions considered in this report. The notable exception is on the frequency of conservative Democrats, which is much higher in the Central Valley than in many other places. Conservative Democrats are also relatively common in Orange, Riverside, and San Bernardino Counties, but rarer in most other areas, including places that are otherwise conservative. These areas with more conservative Democrats also tend to land in the middle of the full range of views on the ACA, gun control, and immigrant rights. It may be no coincidence that these areas are the swing regions, where seats can change hands in either direction.
These results paint a curious picture of the future of parties in California. The Democratic Party is dominant today, and given the challenge of building a strong third-party movement, the Democrats’ greatest threat will likely come from the Republicans. Some potential openings exist for such a challenge. Many parts of the state continue to exhibit a mix of opinions on topics of government size and scope, and most of the state is far from liberal on these questions. Core liberal areas also express deep concern about housing. Yet on one of the clearest points of national partisan difference today-immigration-virtually all parts of the state side with the current Democratic position. Approval of Republican President Trump is also weak in almost all places. In theory, Californians may be open to views currently associated with the Republican Party, but in practice, those topics have not been enough to improve Republican performance.
Topics
Political Landscape Population Statewide SurveyLearn More