

Key Takeaways
The COVID-19 pandemic disrupted higher education in California, forcing students and institutions to adapt rapidly to the public health and economic crisis. Institutions’ revenue streams were predicted to decline just as new and increased costs for health, safety, and online education burdened budgets. The federal government provided over $10 billion directly to help campuses and their students weather the crisis. We analyzed these pandemic-related allocation and expenditure patterns across California’s higher education landscape.
Key takeaways include:
- Funding allocations were sent directly to colleges based on student characteristics. In the first round of funding, federal rules used each campus’s share of students receiving Pell Grants and the number of full-time-equivalent students to distribute funding, which disadvantaged colleges with low Pell take-up and more part-time students.
- Funding was required to be split evenly between emergency student aid and money for institutional relief. Many campuses also used some of their institutional relief funds to provide additional assistance to students.
- Individual campuses largely chose how to distribute student aid. Even with federal and system-wide guidance, they often had different calculation methods. Early on, more emergency aid went to students with financial aid applications on file and those enrolled in more courses, while some campuses also supplemented base aid with application-based grants.
- One-third of the institutional portion of expenditures was spent on replacing revenue from enrollment and auxiliary services. The other two-thirds covered increased costs due to the pandemic—such as social distancing and health, online instruction, and additional student funding. However, expenditures varied considerably by campus—likely a result of different needs, spending rule interpretations, and future plans.
- Because pandemic safety issues forced most courses into an online environment, campuses spent over $460 million on online education training, equipment, and subscriptions for students and staff. Some—especially CSUs and CCCs—see an expanded role for online education in their future.
- Most colleges have a significant amount of money left to spend. As of March 2022, California higher education institutions still had about a third (over $2.1 billion) of their institutional appropriations to spend.
Introduction
When the COVID-19 pandemic struck suddenly in March 2020, California students were sent home and their campuses closed. Up to that moment, California public higher education systems’ finances had been steadily improving since the Great Recession of 2008 (Figure 1). Funding had increased steadily since 2013–14, spurred on by a rapidly growing state economy. State funding per student for the California Community College system (CCC) had increased to an all-time high of over $5,000 per student. The California State University system (CSU) had exceeded its pre-2008 funding levels and was approaching the peak it had reached around the turn of the century. Although funding for the University of California (UC) had not quite reached its pre-Great Recession levels, efficiency efforts enacted during the Great Recession coupled with rapid enrollment growth had set the system on a path to financial sustainability.

Moreover, during the last decade none of the public systems substantially raised tuition; student outcomes like graduation rates, persistence, and time to degree were improving; and the state made targeted investments to increase financial aid awards and expand eligibility (Johnson, Cook, and Jackson 2019; Cook, Jackson, and Lee 2019). Additionally, the state’s robust financial aid system and recent efforts to establish emergency housing and food service programs for students in need likely provided key infrastructure and institutional knowledge about students that assisted in the distribution of emergency federal aid funding.
At the outset of the pandemic, all three systems faced sudden, rapid revenue declines. UC and CSU leadership projected declines of nearly $300 million and $100 million a month, respectively (Watanabe 2020). The major drivers of this revenue loss were the loss of auxiliary revenues like parking, dining, and bookstores, and the loss of tuition revenue from students who chose not to enroll. Moreover, the pandemic rapidly accelerated pre-existing CCC enrollment declines; because their funding is primarily based on state funding connected to enrollment, they also faced revenue declines.
At the same time, campus costs also increased. Although some campuses were more prepared than others to provide online learning, few had the infrastructure, training, and experience needed to adapt all in-person classes to an online medium. In addition, the pandemic further exposed the digital divide among students. Many—in particular low-income—students lacked access to the devices and bandwidth necessary to get course materials and participate in synchronous online classes. Institutions faced steep and immediate costs to train instructors to teach online, provide IT and technical support, purchase scarce technology like laptops and Wi-Fi hotspots, mail lab and art equipment to students, and purchase additional software licenses. Moreover, the shift to online was not limited to instruction. Colleges and universities also incurred new costs in switching student services—such as advising and counseling—and campus business systems—such as registration and financial aid—to an entirely online format.
Institutions also faced steep cost increases to reduce the chance that students, faculty, and staff were infected on campus. Campuses spent millions of dollars to provide personal protective equipment, quarantine facilities, testing and vaccine distribution, custodial and deep cleaning services, and housing and food for international students and others who could not go home. As the pandemic dragged on, campuses also began to invest in capital improvements to increase social distancing and upgrade HVAC systems.
This report addresses three key questions:
- How was federal emergency relief funding allocated to campuses?
- How did campuses distribute funds intended to support students?
- How did campuses prioritize and spend the funding intended to address institutional costs?
To answer these questions, we use US Department of Education data on Higher Education Emergency Relief Fund (HEERF) allocation by campus, and a data set that compiles the expenditure data by specified category, which institutions were required to post to their website as a condition of receiving the federal funds. We add context from interviews with 12 financial officers from UC, CSU, CCC, and private institutions, both to determine how they made the allocation choices they did and to explore challenges and opportunities as they emerge from the worst of the pandemic and federal funding concludes.
First, we provide an overview of how the government allocated funding to higher education across three pandemic relief acts. Next, we discuss how campuses distributed emergency aid to their students. And finally, we present how they used the funding allocated for institutional needs. We conclude with a brief review and recommendations.
Federal Relief Was Substantial and Timely
The combination of immediate revenue declines with rapidly increasing costs initially presented a dire financial reality for California’s higher education institutions. After nearly a decade of funding increases, campus leaders suddenly faced cuts similar to those in the Great Recession, when falling state revenues had led to budget cuts of nearly a third, and UC and CSU had tripled tuition to make up the difference. After that market crash, it took nearly a year before the 2009 American Recovery and Reinvestment Act brought relief. In contrast, the federal government’s pandemic response was much faster and, for the first time, provided relief funding directly to campuses.
How Much Federal Funding Went to California Higher Education?
In response to the financial hardship brought on by the pandemic, the federal government passed a series of three bills between March 2020 and March 2021 to provide funding to states, businesses, nonprofit organizations, and individuals. In all, over $77 billion went to higher education institutions across the nation that applied for relief. Together these three bills—the Coronavirus Aid, Relief, and Economic Security Act (CARES), the Coronavirus Response and Relief Supplemental Appropriations Act (CRRSA), and the American Rescue Plan (ARP)—are referred to as the Higher Education Emergency Relief Fund (HEERF).
Over the three rounds of funding, California received $10.1 billion—about 13 percent of the total. By comparison, Texas received only $5.2 billion, Florida $4.6 billion, and Illinois $2.5 billion (see Technical Appendix Table A1). Together, UC, CSU, and CCCs received $4.5 billion in institutional relief funding. CCC got just over $2 billion. UC received about $1 billion—the equivalent of about 9 percent of its yearly total core revenue. CSU got about $1.5 billion, representing around 26 percent of its yearly total core revenue. The balance of HEERF funds went to private colleges and universities in the state.
The remaining HEERF funding went to campuses qualified as minority-serving institutions—e.g., Hispanic Serving Institutions (HSI) and Historically Black Colleges and Universities (HBCU). California only has one HBCU, but the vast majority of its public institutions are certified as HSIs—5 of the 9 undergraduate UCs, 21 of the 23 CSUs, and 76 of the 114 CCCs. In all, 176 got an additional $440 million based on their role as minority-serving institutions.
Private colleges in California account for about 18 percent of undergraduate enrollment—12 percent in 150 nonprofits and 6 percent in 160 for-profits (Johnson and Cuellar 2019). Private colleges got $1.06 billion in HEERF money, most of which went to nonprofits ($847 million). The Department of Education rules regarding how HEERF funding was used for institutional expenditures under CARES, CRRSA, and ARP were similar for nonprofit private and public colleges and universities, as was the requirement that a minimum of 50 percent of funding be distributed to students. However, under CRRSA and ARP, for-profit colleges were required to pass on 100 percent of their funding to students in the form of emergency financial aid grants.
Allocation Rules Varied by Institutional Characteristics and Changed over Time
Not all institutions received the same federal funding through HEERF. Originally there were significant differences because allocations were based on numbers of Pell Grant recipients and on full-time students (FTEs). Both calculations caused marked inequities in how the student-directed funding was disbursed. Three-quarters of the funding was allocated based on Pell enrollment and one-quarter on non-Pell enrollment. At first glance, this makes sense. The student money was meant as emergency aid, and Pell eligibility was used to target funding toward campuses serving students with the most financial need. But while Pell eligibility was a useful proxy to determine student need, the measure likely underestimated the level of need at certain institutions such as community colleges (Wheelhouse 2019).
As successive bills were passed and the pandemic persisted, the change in the presidential administration shifted federal priorities and rules regarding how the funding was to be used. Initially, under the CARES Act, funding went to campuses based on their enrollment of full-time equivalent, Title IV–eligible students, which disproportionately favored campuses with large numbers of full-time students. For example, even though only 5 percent of the state’s undergraduates attend for-profit colleges, these schools were initially expected to receive 10 percent of federal funds. Yet the state’s community colleges, with 55 percent of undergraduates, would get only 34 percent. Community colleges and commuter campuses—whose students are more likely to work and attend courses part time—lost out. This was especially detrimental for community colleges, as 64 percent of the two million students in the system are enrolled part time and the majority of these students rely on state instead of federal financial aid.
Subsequent relief legislation—CRRSA and ARP—addressed these unintended consequences. Their allocation formula gave equal weight to total head count (i.e., the total number of students enrolled regardless of the number of credits that they take), and calculated FTE enrollment based on student credit hours to produce an equivalency for full-time, full-year students. As Figure 2 shows, while this change in the allocation formula vastly increased amounts for community colleges, they continued to receive less overall federal funding per student.

Federal funding was split evenly between student aid and institutional funding
Under all three bills, funding allocations were split. About half was earmarked for direct delivery to students and half to defray pandemic-related institutional costs. In addition, campuses were allowed to spend their institutional funds on supplemental financial aid for students.
The rules for institutional expenditures changed across bills. Initially, the CARES Act only permitted campuses to provide grants to students and to fund changing instruction from face-to-face to online. However, CRRSA and ARP expanded legitimate uses to include lost revenue, reimbursement of expenses already incurred, technology costs associated with shifting to online learning, faculty and staff training, and payroll. This gave campuses more flexibility. But it reduced transparency into the specificity of how the funding was used. More detailed reporting requirements regarding the type of revenue replaced could have fostered a better evaluation of the effectiveness of the federal funds.
The next two sections highlight how various higher education systems and campuses used federal funds.
Emergency Financial Aid
Higher education institutions were required to spend at least half of their total HEERF funding on direct financial aid grants for students. Although all recipient institutions received the same basic guidelines on how to spend the funds, individual campuses—even within the same sector—decided independently how best to distribute the aid that was allocated directly to them. Therefore, campuses’ methods of notifying students that aid was available, their criteria for awarding aid, the amounts of aid given to each type of student, and the methods of distribution varied drastically by campus.
Campuses Largely Determined Criteria for Student Aid
The federal rules for student aid distribution were flexible, which facilitated considerable variation in rules amongst campuses, even within the same educational sector. While many campuses used students’ records on file from before the pandemic to determine aid eligibility and deliver that aid, others set up emergency aid applications. As a result, students with the same enrollment status, financial need, and other characteristics received varied amounts of aid depending on their campus’s aid allocation practices.
Most institutions used information already on file to direct aid to students
In our interviews, many institutions expressed a desire to disperse COVID-19 relief funds to students as quickly as possible and federal guidelines had instructed them to target students most in need. For these reasons, over 75 percent of California public campuses used pre-existing data from their students’ records to determine grant aid awards from the student portion of their HEERF funds (US Department of Education 2022). In addition to relying on pre-existing student records, more than 30 percent of CCCs also used pandemic-specific aid applications (US Department of Education 2022).
Institutions that used existing student records were able to act with minimal delay by using students’ Expected Family Contribution (EFC) from their FAFSA application—if one was on file. Administrators used that information to identify which students were most in need, and this approach allowed for a shorter aid determination process. However, this information failed to account for pandemic-related changes, since the students’ financial records were submitted prior to the academic year and the pandemic onset. In March 2020, the most recent FAFSA available had been filed in 2019—based on 2018 earnings—well before the pandemic. Campus officials specifically expressed their awareness of the trade-off between speed and accuracy in assessing student need. Some believed the need to deliver aid to students as quickly as possible outweighed the desire for more recent, accurate information about changes in students’ financial needs. Others expressed the desire to avoid further stigmatizing their students by making them prove their limited financial means when institutions already commonly require their students to do so annually. Furthermore, many institutions used multiple methods of distributing funds to their students. The amount and types of information that were already in students’ records, the number of financial aid staff available to determine these distributions, and the overall urgency of financial need prompted many campuses to act quickly while distributing the funds through multiple routes to meet their students’ needs.
Among the campuses that did not use pre-existing data, some indicated to us that they did not have enough information about their students to make decisions. They often had to choose between automatically disbursing aid based on limited information or waiting until after their students submitted applications providing additional financial hardship information. Institutions often requested more details from students—many students submitted supplemental applications attesting to their pandemic-related increased financial need and students without FAFSA applications on file were prompted to complete them.
Students enrolled in more credits received higher financial aid amounts
During the first part of the pandemic, the CARES Act was the only source of funding and its allocation rules relied on FTEs. A student’s full-time or part-time status often impacted how much emergency aid they would receive. The largest awards went to students who were enrolled full time and smaller awards went to part-time students.
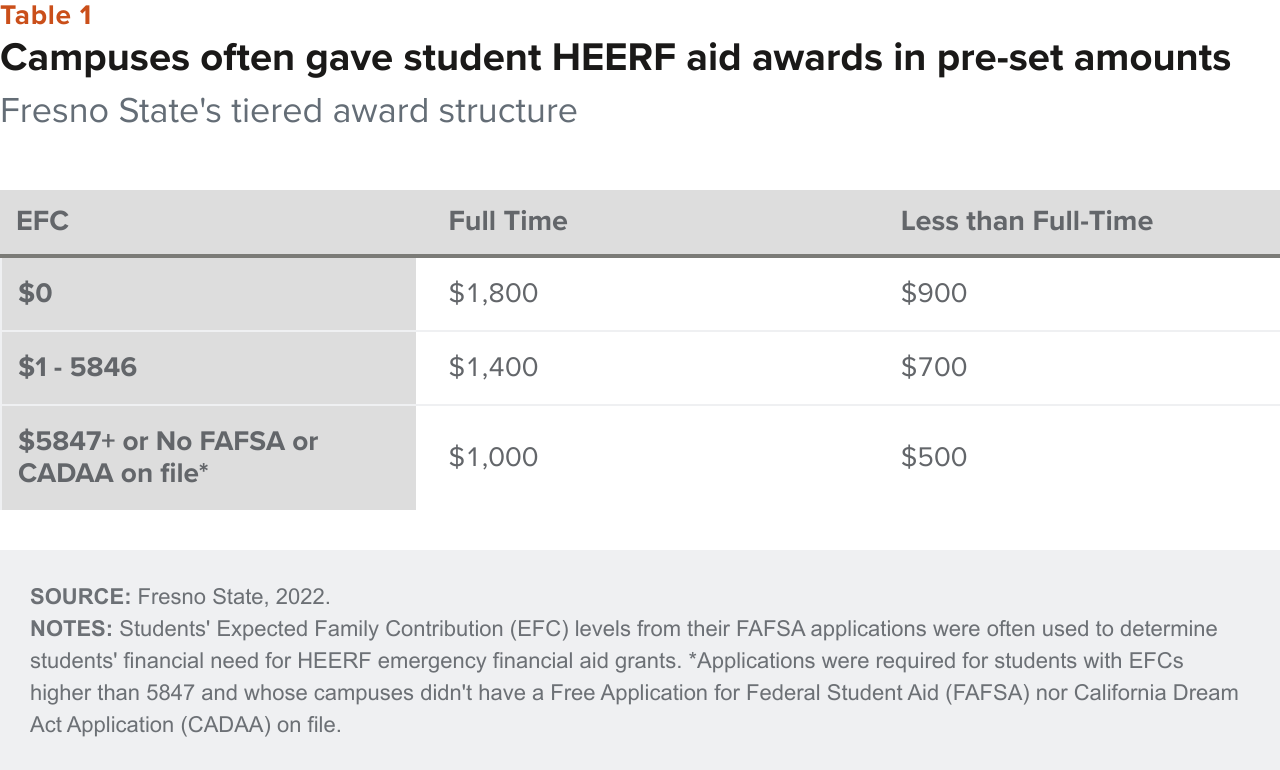
Institutions used the combination of students’ enrollment status and family financial characteristics to determine aid allocations and often published these preset amounts on their websites for students to view. For example, as illustrated in Table 1, Fresno State gave students with small EFCs between $700 and $1,800 in aid while those with higher EFCs received as little as $200 each. Campuses like Clovis Community College gave as little as $50 to students who were determined to have the lowest financial need.
Some institutions used supplemental applications if students expressed financial needs that exceeded their campus’s pre-set automatic disbursement amounts. These applications often required students to describe reasons why they needed additional financial aid, describe the expenses for which they were requesting additional aid, and attest to this additional financial need having arisen from unforeseen circumstances related to the pandemic. Campuses with fewer financial aid officers expressed in interviews that they did not have enough staff to process individual applications for each student in need, so the availability of individuals to process those applications also influenced decisions on how to determine the disbursal process.
Emergency student aid award patterns varied by institution type
As Figure 3 illustrates, different allocation amounts and dispersal rules led to variations in aid amounts even within the same educational sector. Yet there were important differences across sectors. Students at California Community College campuses had the widest range of grant amounts given to students out of all California public institutions. On average, California Community College students received a minimum of $200 in emergency financial aid grants—relatively close to the $272 average minimum to CSU students. UC students received an average minimum of $423—more than double that of community college students and one-and-a-half times that of CSU students. In turn, the largest average amounts that UC and CSU students received were similar—$1152 and $1325, respectively—while community colleges’ largest grants were double that—$2811 on average. The typical UC emergency financial aid recipient received about $280 more than the typical California Community College recipient. For context, full-time annual tuition and fees are about $14,000 at UCs, but only $1,270 at California Community Colleges. However, students attending UCs are much more likely to use student loans to cover their expenses and have higher post-graduation incomes to repay those loans, compared to less than 1 percent of community college students applying for federal student loans.

Campuses Faced Challenges Getting Aid to Students
Reaching students to inform them about their eligibility for aid was particularly difficult for some campuses, especially in the early stages of the pandemic, when students were quickly moving from campus addresses to new residences across the state, country, and globe. Many students did not update their contact addresses in the haste of these sudden moves, which forced campuses to strategize ways to reach their suddenly geographically dispersed student bodies. Furthermore, many students lacked consistent access to stable internet connections and devices to access their online school materials after they left campus.
In an effort to inform students about their eligibility for emergency financial aid, campuses contacted students through several communication channels, including:
- Letters sent via email and physical mail. These letters often included details about the federal government being the source of this funding, the criteria their campus was using to determine students’ eligibility for grant aid, any steps required from the student to receive the aid, the amount of aid that the student may receive, and an explanation of how the funding would be disbursed to students.
- Social media posts from official campus profiles. These posts were brief announcements that often included links to campus websites for more detailed explanations of the emergency aid.
- Campus radio stations. These campus media outlets broadcast information about emergency financial aid grants. This method bypassed the need for students to have an internet connection or a stable home address. Eliminating those two requirements to reaching students was particularly useful as there was often lag time before colleges distributed hotspots or set up COVID-safe study zones with internet to ensure all of their students were digitally connected, and many students moved home or elsewhere when campuses closed due to pandemic safety concerns.
- Phone calls from campus staff and volunteers. Due to the time-intensive nature of this method, campuses with fewer enrolled students were more likely to call each student who may have been in need and eligible for these grants. This person-to-person contact allowed students to receive information tailored to their circumstances and immediately hear answers to their questions.
Once campuses reached their students, they often also needed multiple methods of getting the aid into students’ hands. Depending on the money management methods their students already used and had available to them, campuses distributed funds to students via electronic transfer, debit cards, payment apps, and other methods. These differing methods reflect another challenge that some campuses had in ensuring that the funds reached their students—particularly those with the highest need.
Nearly all CSU (96%) and UC (100%) campuses reported distributing the funds exclusively through electronic transfers, such as direct deposits to students’ bank accounts (US Department of Education 2022). Meanwhile, 77 percent of community college students also received their aid in this way. The least-common distribution methods we found were debit cards and payment apps.
Institutional Aid and Spending Patterns
About $5.3 billion of the HEERF money was allocated for institutional needs. The spending rules changed and loosened throughout the pandemic, but in general, funds went to replace lost revenue, make campuses safer, implement online instruction, and provide student funding above and beyond the primary student allocation. In all, at least 71 percent of the federal funding was spent by March 2022, with the spending deadline extended to 2023. We gathered the most recent quarterly reports (as of March 2022) from each campus and analyzed the spending in six collapsed categories: additional student funding, auxiliary revenue replacement, enrollment revenue replacement, social distancing and health, online instruction, and other spending (see Technical Appendix Table A1 for the categories). Some institutions provided notes on spending for various categories, which we gathered and analyzed. Lastly, we supplemented those quarterly reports and notes with interviews of campus budget officials across California’s higher education segments to add context to how the funds were spent. In this section we describe how and when institutions spent their funding.
Institutions Replaced Revenue and Used Federal Funds for New Costs
As a federal requirement for use of the HEERF funds, institutions were responsible for recording spending in 16 predefined categories on a quarterly basis starting in fall 2020 (see Technical Appendix A). In all, we collected up to 6 quarters of expenditure data on all 9 undergraduate-serving UC campuses, 23 CSU campuses, 114 CCC campuses, and 51 private nonprofit institutions. We collapse the 16 categories into 6 categories for analysis (Figure 4).

Additional student funding
While half of the federal funds were earmarked to be passed directly to students for aid, institutions could also spend some of their institutional fund portion on students. Together, public institutions spent about $638 million (21% of total institutional expenditures) on extra funding for students (Figure 4). This additional student funding includes additional emergency aid; reimbursements for housing, room, and board; other fee refunds; and tuition discounts. Most of it (59%) went for tuition reimbursement, followed by additional financial aid (36%). One campus we interviewed funded students’ basic needs by funding the student pantry and providing gift cards for food. Multiple community colleges also forgave student debts for classes and services, which enabled student re-enrollment.
Auxiliary revenue replacement
Many non-academic sources of campus revenue were impacted by the pandemic. Public institutions spent about $552 million (20% of total expenditures) on replacing them. Campuses mentioned many different sources of lost revenue in the quarterly reports, but the most common were parking, food service, bookstores, athletics, and childcare facilities. Some less-common examples included the rental use of campus space by outside organizations, police operations, and museums.
Enrollment revenue replacement
Many institutions lost revenue due to a decline in enrollment, and while for some campuses it was brief, for others it still persists. Public institutions spent a total of $370 million (17% of total expenditures) on replacing revenue associated with reduced or delayed enrollment. These include lost revenue from tuition, fees, institutional charges, room and board, enrollment declines, supported research, summer terms, and summer camps. Many campuses noted lost tuition revenue due to enrollment declines in resident and nonresident students. The 2021 state budget reduced campus funding by 3–5 percent, which some campuses later claimed in this category. This enabled them to mitigate the impact of the temporary reduction until funding was restored and augmented the following year.
Social distancing and health
California institutions spent about $370 million (15% of total expenditures) on making their campuses and students safe during the pandemic. This included the costs of subsidizing off-campus housing or housing costs to isolate students or provide space to stop the spread of infections, adding class sections and subsidizing meal service to accommodate social distancing, general campus safety and operations including cleaning and personal protective equipment, and purchasing additional instructional equipment to limit sharing and provide time for disinfection. The largest portion of this money was spent on campus safety, which included personal protective equipment; testing; and upgrading heating, ventilation, and air conditioning systems. Campuses we interviewed mentioned using the funding to purchase supplies for lab classes and mail them to students, or to provide PPE kits for in-person instruction. Many also mentioned incentives to encourage their students to get vaccinated; for instance, one campus offered $100 gift cards that could be spent at their campus bookstore.
Online instruction
Most courses at most institutions moved online. California’s public colleges and universities spent about $344 million (14% of total expenditures) on the transition. This included providing additional technology hardware such as laptops or tablets to students, purchasing training for faculty and staff in online instruction or paying staff trainers extra, and purchasing equipment or software to enable distance learning. Multiple campuses found that reliable, high-speed internet connectivity was the largest barrier to participation in distance education. In quarterly reports, many campuses noted providing Wi-Fi hotspots to students and faculty and purchasing monthly data plans on their behalf. Others noted expanding wireless services to campus parking lots and other nearby outdoor spots to allow faculty and students without reliable internet a place to teach and learn.
Other costs
California’s public institutions also spent $352 million (13% of total costs) in other categories. The federal rules allowed institutions to use the “Other” category funds to defray expenses such as lost revenue, reimbursement for expenses already incurred, technology costs associated with a transition to distance education, faculty and staff trainings, and payroll. Not all campuses provided notes for these costs, but those that did mentioned indirect costs, state appropriation losses, outreach to students, staff wellness, and shipping supplies to students and faculty. Also, many of the notes indicate items that could fit within other categories—a point the state auditor made early in the pandemic (Auditor of the State of California 2021). For example, some campuses claimed student parking fee refunds, COVID tracking and tracing, loss of state appropriations revenue, and books and supplies as “other” spending, while others placed them in one of the 14 core spending categories. In addition, most “other” spending is not annotated, which makes analysis more difficult.
Spending Patterns Varied over Time
Interviews with campus officials revealed that under the CARES Act the rules for institutional spending were initially unclear. They noted using online information from the US Department of Education, federal webinars, conversations with other institutions, and guidance from system offices to determine appropriate uses for the funding. The second (CRRSA) and third (ARP) rounds included substantially more funding and came with more relaxed, clearer rules, which enabled campuses to address a wider range of needs and claim much more enrollment- and auxiliary-related lost revenue.
As a result of changes in rules and likely changes in need, campuses spent early funding differently than later rounds. While both periods saw significant investment in additional student funding, later spending was spread more evenly between categories (Figure 5). From fall 2020 to spring 2021, campuses spent 52 percent of the CARES Act dollars in the student funding category, while very little (10%) went to replacing revenue (Figure 5). In the subsequent four quarters, after rule changes, a much smaller portion went to student-related funding (15%), and a much higher proportion went to replacing revenue (45%), and social distancing and campus safety (14%).

As of March 2022—the initial spending deadline—schools in California had used almost two-thirds of their institutional funding. The quarterly reporting limits our data collection to March 2022, but more has likely been spent since then. In all, California institutions had over $2 billion left to spend as of March 31, 2022, with about $1.2 billion at the CCCs. Rule changes have extended the spending deadline to March 2023. Interviews with campus financial officials suggested that they had plans outlined for spending the rest of the money by then.
Spending Differed between—and within—Systems
There was considerable variation in spending patterns between different types of higher educational systems. What campuses spent—and did not spend—may paint a picture of differences in need, accounting, and plans for the future. For instance, as of March 2022, community colleges still had half of their institutional appropriations to spend, while UC and private nonprofit institutions had only one about one-fifth left (Figure 6). It is likely that different sectors had different needs, and the flexibility noted above allowed for campus expenditures to reflect unique needs. For example, the UCs operate dorms at their campuses and are more dependent on revenue generated from students, including those who pay extra nonresident fees. That might explain why a bigger portion (41%, compared to 30% at CSU) of their overall funding went toward enrollment and auxiliary revenue replacement. In contrast, CCCs spent a larger portion for online instruction, which might not be surprising given that by fall of 2021 most UC and CSU courses were conducted in person, while most community college courses remained online.

However, spending also varies considerably by campus within educational sectors, suggesting that there are likely other reasons for the variation between systems as well. For example, Figure 7 shows spending for University of California campuses. While all the UC campuses are residential and serve a diverse student body, no two campuses had similar expenditure profiles. Merced and Riverside had the largest amount of funding per pupil, likely due to their federal status as Minority Serving Institutions, and more than half of students at each campus received Pell Grants. Those two campuses spent a majority of their HEERF funds on enrollment revenue replacement and student funding, which can cover lost revenue from tuition, fees, institutional charges, room and board, additional emergency grant aid, and refunds to students. Most other UC campuses spent between 20 and 40 percent of their total expenditures on replacement of enrollment revenue.

The UC campuses show few similarities in other categories. For example, even though they had roughly the same timelines for distance learning and the return to in-person classes, over 40 percent of Santa Barbara’s total expenditures went to social distancing and health, compared to less than 2 percent for Berkeley and Los Angeles. Similarly, the amount for online education varies considerably, from near zero at Berkeley to over 10 percent at Santa Cruz and San Diego.
CSU spending also differed at the individual colleges. As Figure 8 illustrates, there was more auxiliary revenue replacement (per FTE) at CSU compared to UC and CCC. Maritime Academy, where all students must live on campus, spent two-thirds of their funds on auxiliary revenue replacement—the rest spent between 2 and 48 percent. Spending also varied considerably within the California Community Colleges, which we show in Technical Appendix Tables A3 and A4.
Why did spending vary so much for similar institutions? It is likely that differences in campus spending are due to a combination of factors that make drawing conclusions difficult. First, the pandemic did not affect all campuses in the same way and at the same time. Health and social distancing expenditures may have varied considerably based on the prevalence of COVID—and vaccine take-up rates—in the surrounding areas and how much support students received from the local community. Some campuses were quicker to return to in-person learning as well. The financial flexibility of the federal funds allowed them to spend differently. Second, it is likely that differences were due to interpretations about allowable spending and how to categorize federal spending versus other spending. The state auditor found that while University of California Office of the President and California State University Chancellor’s Office did not provide rules for campus expenditures, they did provide guidance (Auditor of the State of California 2021). Our interviews also suggested that in addition to federal guidance, campuses received some advice about spending and accounting from the state, their central offices, and advice from their colleagues at peer institutions. As noted above, 13 percent of costs are in the other category, and many of those costs could have been categorized differently (Auditor of the State of California 2021). Lastly, differences in spending could change as institutions spend their remaining funds.

Federal Funding Provided Online Education Growth
When the pandemic began, most colleges scrambled to put their courses online. About 14 percent of the total federal funding (about $464 million) went into making online education possible. Prior to the pandemic, online education had faced many roadblocks to cost-effectiveness, including costs for redesigning courses and training faculty and staff (Johnson, Cuellar Mejia, and Cook 2015). The move to online education during the pandemic may have forced some investment into those areas. About $100 million across California public and nonprofit institutions went to purchasing faculty or staff training in online instruction, as many course sections that had only been delivered face-to-face were forced to online or distance education.
However, a majority of the $464 million in federal funding (80%) went to providing or subsidizing the cost of high-speed internet for students and staff and purchasing or leasing additional equipment for distance learning. If institutions want to continue with online education, these costs would likely be recurring—computers, Wi-Fi hot spots, and internet plans would have to be maintained or replaced periodically, limiting the long-term value of these early investments in online learning.
Where does this leave online education after the federal funds run out? Total online course enrollment was already increasing at CCCs prior to the pandemic—from less than 10 percent in 2009 to 19 percent in 2018 (Berumen and Nguyen 2019). The pandemic-related switch to online learning may have convinced more students and faculty to consider it in the future as well. However, California institutions will have to find a way to bridge the digital divide for many students once HEERF funding runs out.
Conclusion
While financial crises at colleges and universities have happened before, the pandemic created a unique challenge for the state and federal government. The allocation of federal funding and how institutions spent it present some lessons for future financial crises.
Direct delivery of funding to campuses was quick, but unclear rules may have limited effectiveness. The HEERF funding was quickly disbursed, especially when compared to the speed of the federal funding during the Great Recession. However, there may have been a trade-off between speed and clarity. Many campuses we interviewed felt that rules for distributing the money to students and institutional needs were unclear. Those rules became clearer in successive acts, as policymakers likely responded to feedback. In the future if there is an urgent need to get money out to college students, policymakers should consider directly funding campuses, which were able to reach students quickly. However, they should also heed the lessons from the HEERF rollout, as funding effectiveness will depend at least partly on the clarity of rules and guidelines.
Funding allocation and distribution rules may have left select institutions—and their students—with less. The federal reliance on counts of Pell Grant recipients and full-time-equivalent (FTE) students over headcounts initially favored students in need at the UC and CSU. Students at community colleges are less likely to attend full time, and many Pell-eligible students do not receive the award due to under-application (Wheelhouse 2018). The desire to get funding out quickly using available measures may have left some students—particularly at community colleges— and their institutions in need with less money. The second and third installments of HEERF allowed for distributions more aligned with student need at community colleges, where the students with the most need are concentrated. Even so, total funding per student was still lower there. Similarly, individual campus rules may have excluded some students with significant need. Reliance on available financial aid data facilitated quick dispersals, but since the pandemic may have changed students’ employment, family, and health situations, it may also have underestimated need. Campuses that also made emergency aid available via application were more responsive to pandemic-related changes in student need.
Online education expanded, but more consistent investment will be necessary to continue growing online offerings. Technology and online education upgrades were a big expenditure during the pandemic. In addition, the pandemic exposed students and faculty to online education, and in some instances increased demand for online and distance courses even as students returned to in-person classrooms. Whether higher education will respond to that demand likely depends on the investments they made and how much more it will cost to keep offering online courses. While some of that investment will continue to have value—such as training faculty in online education and introducing students to learning in an online setting—many of those dollars spent represent subscriptions (hotspots, Wi-Fi, and video conferencing licenses, for example) or technology that will need to be maintained and/or replaced over time (laptops, tablets, and classroom infrastructure). While federal funding and the pandemic may have opened the door for online education, it will take more funding to maintain wide access to online courses for instructors and students. Lastly, colleges will need information on the impact of expanded online education on student outcomes.
Most colleges have a significant amount of money left to spend. As of March 31, 2022, California higher education institutions still had about a third (over $2.1 billion) of their institutional appropriations to spend. Those we interviewed suggested that the speed and amount of federal money was important in helping their institutions and their students recover during a time of great financial need. Given the massive amount of federal stimulus and investment in the economy during the pandemic (perhaps a result of having experienced the Great Recession’s length and depth), it may be fair to ask whether HEERF was too much. However, when the three acts were passed, the timing and shape of the economic recovery was still unclear. While it is true that state funding for postsecondary education rebounded quickly and most public four-year institutions were back to normal operation by spring 2022, the effects of COVID may have a long tail. California Community College enrollment is still down 17 percent since 2019, and some CSU campuses are also dealing with enrollment declines (Fairlie and Bulman 2022). While remaining funds can still be used to replace lost revenue, they can also be used to help remaining students persist and make it easier to reengage with students who left during the pandemic. For example, some community colleges have used the funds to forgive campus debt to encourage former students to re-enroll.
The amount of federal money flowing into colleges and universities was unprecedented and was intended to keep institutions and students afloat during a financial crisis stemming from a worldwide pandemic. While for the most part institutions filled gaps (some temporary—as state funding bounced back quickly) and addressed health and distance education needs with new spending, it will be important to determine whether any of the federal funding resulted in investments that will have an enduring impact. Future work should focus on evaluating reforms that started during the pandemic—such as the move to online student services and increases in access to online education—and their potential impacts on student success.
Topics
Access Affordability Equity Finance Higher Education