

Table of Contents
- Key Takeaways
- Introduction
- Statewide Trends and Projections for K–12 Enrollment
- Factors around Pandemic-Era Declines
- Long-term Factors Influencing Declines
- District Responses to Enrollment Declines
- Discussion and Policy Implications
- Notes and References
- Authors and Acknowledgments
- PPIC Board of Directors
- Copyright
Key Takeaways
Over the past five years, enrollment has declined at nearly three-quarters of California school districts, bringing added fiscal pressures and difficult downsizing decisions. These losses are expected to continue, with the state projecting a decline of over a half million students by 2031–32; federal projections suggest nearly a million. We examine past declines and future projections to provide context on the trends and challenges facing the system over the next decade.
- Enrollment is expected to decline in nearly all regions in the next decade. Many coastal regions and counties expect to see larger declines; the largest is forecast for greater Los Angeles (19%), which already fell 15 percent in the past decade. Only the Sierra and Northern Central Valley regions are projected to see growth. →
- Counties serving higher shares of English Learner (EL), Asian, Black, and Latino students expect larger declines. In recent years, declines have been significantly larger among former and current EL students than students who entered school initially English fluent or with English as the home language. Counties with the highest share of EL students expect declines of 10.6 percent, while counties with the smallest share expect gains of 2.2 percent. →
- Most districts that lose enrollment do not close schools—but when they do, they tend to close those that serve higher shares of low-income and EL students and have lower test scores. Among districts that saw 10 percent or greater enrollment losses from 2009 to 2019, only one-third closed schools. However, in declining districts with wide socioeconomic differences, schools that closed had 14 percentage points more low-income students, 6 percentage points more EL students, and had much lower test scores than the rest of the district. →
- The long-term trend of falling enrollment primarily reflects declining birth rates and net migration to other states. Birth rates have been falling for years even as greater numbers of families with school-aged children have moved to other states in recent years, exacerbating enrollment declines. →
Should declines materialize as projected, they would have significant implications on district finances, operations, staffing, and school facilities in nearly all reaches of the state. From the state perspective, the minimum funding guaranteed to public schools by Proposition 98 (1988) may bring a silver lining: higher per pupil funding for fewer students. But districts will face difficult downsizing decisions. Accelerating declines could also bring greater pressure to close schools, along with concerns over which students and neighborhoods may bear the costs of downsizing. Providing districts with adequate guidance and support to make efficient and equitable cuts will be key to ensuring any declines do not adversely affect student opportunities.
Introduction
Public school enrollment—including students in traditional public schools as well as public charter schools—peaked at just over 6.3 million students in 2004 and then held steady, dipping to just below 6.2 million students by 2019–20 at the onset of the pandemic. Since then, enrollment has fallen by 300,000 students, in part driven by pandemic-related forces.
Projections for the next decade indicate continued—and accelerating—enrollment declines. The California Department of Finance (DOF) projects enrollment of under 5.2 million by 2032; the federal government projects even steeper declines to under 5 million students in roughly the same time horizon. These declines are largely the product of long-running demographic changes—the state’s education system appears to be at the beginning of a period of downsizing and adjustment.
Statewide, enrollment factors into overall funding levels and budget allocations. In fact, the Proposition 98 guarantee may mean that enrollment declines benefit the system, allocating a similar share of the state budget to a smaller base of students. Proposition 98 guarantees a minimum funding level for schools based on specific formulas; the current formula ensures schools receive a minimum share of the state General Fund revenue (roughly 40 percent), even when attendance is falling. In other words, declining enrollment means more money per student for educators, student services, technology, facilities, and the like.
But at individual districts, declining enrollment means an eventual loss of funding, as schools are funded based on the number of students they serve. When forced to downsize due to declining enrollment, districts face difficult choices around reducing services, which may lead to fewer opportunities for students, financial inefficiencies, and even school closures.
Declines and associated downsizing may be particularly disruptive for high-need students receiving additional services, including the 19 percent of students in California public schools who are English Learners (ELs). With shrinking student populations, local and state policymakers will face the difficult task of ensuring that language support and other support services are maintained for remaining students even as budgets shrink.
A similar dynamic affects funding and services for students with disabilities (SWDs). Funding for SWDs is determined by attendance for the overall student population, meaning that enrollment declines may lead to funding declines that do not match actual changes in enrollment among this group. Though we present some statistics on changing SWD enrollment in this report, a full analysis of the implications of enrollment declines on the funding and services available for SWDs is beyond the scope of this report.
The state’s TK–12 funding formula—the Local Control Funding Formula (LCFF)—provides a temporary mechanism to lessen the immediate impact of declines. Before the pandemic, districts received funding for the greater of the current or prior year Average Daily Attendance (ADA)—a strategy that is sometimes referred to as a “hold harmless.”
During the pandemic, districts could use their pre-pandemic 2019–20 ADA for funding purposes, insulating districts from pandemic-era ADA declines. Since 2021–22, the state introduced an additional option, funding districts at the greater of the prior year, current year, or prior three-year moving average.
Prior research indicates these hold harmless provisions benefit districts by increasing per pupil funding amounts, but that declines tend to be ongoing and therefore districts eventually face downsizing decisions (Warren and Lafortune 2020). Expanding hold harmless provisions over a longer time horizon could benefit declining districts—but comes at a cost of reducing available funding for students elsewhere in the state. For this reason, given the long-term demographic forces facing the state’s TK–12 education system, ensuring an efficient—and equitable—downsizing will be a policy imperative in the coming decade.
Statewide Trends and Projections for K–12 Enrollment
Enrollment in California’s K–12 system grew rapidly year-to-year from 1980 to 2000, increasing by over 50 percent from 4 million to over 6 million students (Figure 1). Enrollment grew faster than most other states and regions. Little changed for California in the subsequent decades, with enrollment reaching a plateau of roughly 6.2 million to 6.3 million students for much of the 2000s and 2010s; many southern states began to grow faster in the 2000s and 2010s.
Starting in 2016–17, enrollment began to decline gradually in California schools, falling by roughly 60,000 students by 2019–20, prior to the pandemic. We discuss specific demographic factors contributing to these declines later in this report, but these declines were anticipated at the time, and projected to continue at a modest pace over the following decade (California Department of Finance 2022; Warren and Lafortune 2020).
The gradual pace was upended at the onset of the pandemic: over the following two years, California saw record year-over-year statewide enrollment declines, with drops of 160,000 in 2020–21 and 110,000 in 2021–22. The decline slowed in 2022–23, with a smaller decline of roughly 40,000 students.
Enrollment rose in California public schools for decades, plateaued, and began to drop in recent years, with projections indicating continued declines
Total enrollment

SOURCES: California Department of Education; California Department of Finance; National Center for Education Statistics; authors’ calculations.
NOTE: Data shown for 2023–24 onwards are projections. See Technical Appendix Figure A7 for projections beyond 2032–33.
Demographic projections suggest enrollment will continue to decline across the state over the coming decade. The California Department of Finance (DOF) projects that declines will persist at roughly 40,000 to 60,000 students per year, resulting in enrollment levels below 5.2 million by 2032. Without changes in underlying demographic trends like declining birth rates and an aging population, these declines may continue after 2032: DOF projects declines in every year through 2044–45, with enrollment falling below 5 million in the late 2030s (Technical Appendix Figure A7).
The National Center for Education Statistics (NCES) at the US Department of Education projects even steeper and faster declines: losses of roughly 100,000 students per year, reaching just under 5 million students by 2031. The NCES projections have varied significantly in the past, however, and we view them with more caution than the DOF projections.
For example, in 2021 the NCES projected significantly smaller declines, with enrollment at 5.4 million in 2030. In 2020, using pre-pandemic data, they projected essentially no decline, with an enrollment of 6.1 million by 2029. Nevertheless, under either scenario, California’s student enrollment may fall 15 to 20 percent relative to the peak reached before the pandemic.
Declines in California May Be Steeper than in Other States
California may see a larger enrollment loss than in other large states or regions in the United States, according to recent NCES projections (Figure 2).
- New York faces declines as steep as those in California (roughly 15% by 2031).
- Illinois faces declines that are slightly less steep than in California (8%).
- Pennsylvania and Georgia have modest declines (less than 5%, mostly in the latter half of the decade).
- Modest growth is projected for Florida and Texas, as enrollment has swelled in recent decades.
- Texas may surpass California as the state with the highest K–12 enrollment in 2026 (Technical Appendix Figure A1).
Regionally, western states are expected to have the largest decline (10%), in part a reflection of California’s projected decline and its outsized population relative to other western states (Figure 3). States in the Northeast may also see substantial declines (9%), while declines may be more modest in the Midwest (5%). In the South, enrollment levels are projected to remain roughly constant (less than 1% change). By 2031, California enrollment is projected to fall to 1990s levels—while the South may be 30 percent higher and the Northeast 5 percent lower (Technical Appendix Figure A2).
Enrollment declines in California are projected to be larger than in any other large state by 2030
Change in enrollment, relative to 2021–22 (%)

SOURCE: National Center for Education Statistics; authors’ calculations.
NOTE: Figure reports enrollment projection changes as a percentage of enrollment in 2021–22.
California is projected to have larger enrollment declines than those in any other US region
Change in enrollment, relative to 2021–22 (%)

SOURCE: National Center for Education Statistics; authors’ calculations.
NOTE: Figure reports enrollment projection changes as a percentage of enrollment in 2021–22.
Enrollment Has Declined in Most California Regions
When we examine enrollment changes by region, we find differences across regions from 2012–13 to 2022–23, with varying expectations for the future (Figure 4).
- Enrollment fell most in greater Los Angeles, by 14.7 percent. This trend of sharp decline will likely continue, with a projected loss of 19 percent between 2022–23 and 2032–33, making it the region with the largest decline by far.
- The Sierra region experienced a notable 10.1 percent decline, but projections suggest an increase of approximately 4 percent from 2022 to 2032 which is larger than any other region. This change is the most substantial swing in enrollment among all regions, with an expected difference of about 14 percentage points.
- The northern Central Valley was one of the few regions where enrollment increased, with growth of 3.1 percent; this upward trend is projected to continue with a slight increase of 1 percent.
- Similarly, the Sacramento metro region grew by 4.5 percent from 2012 to 2022, but projections indicate a slight decline of about 2.2 percent by 2032, a significant shift from the previous decade’s growth.
Enrollment declines are projected in all but two California regions over the next decade

SOURCE: California Department of Finance; authors’ calculations.
NOTE: Regional changes constructed using county-level data. See Technical Appendix Table A1 for regional definitions.
Across California, enrollment declines are expected to be widespread—41 counties are projected to decline, compared to 38 counties that saw declines over the prior decades. Declines are also expected to be steeper, at more than 10 percent on average across declining counties.
Sharper Declines Are Projected for Counties with Greater Shares of Underrepresented Students
Counties with higher shares of underrepresented groups may face steeper declines compared to others, leading to challenging decisions like cost-cutting and downsizing. As educational institutions vie for a diminishing pool of students, areas with fewer resources will face a notable disadvantage, as they may lack the funding to offer attractive programs that entice students to enroll in their district.
Among the hardest-hit counties are those with substantial populations of students with special needs, such as students with disabilities and ELs. This raises concerns around how declining enrollment and fiscal downsizing may affect the supplemental support services provided for these students. Consequently, addressing disparities in resources and support becomes crucial to ensuring equitable opportunities for all students across different counties and districts.
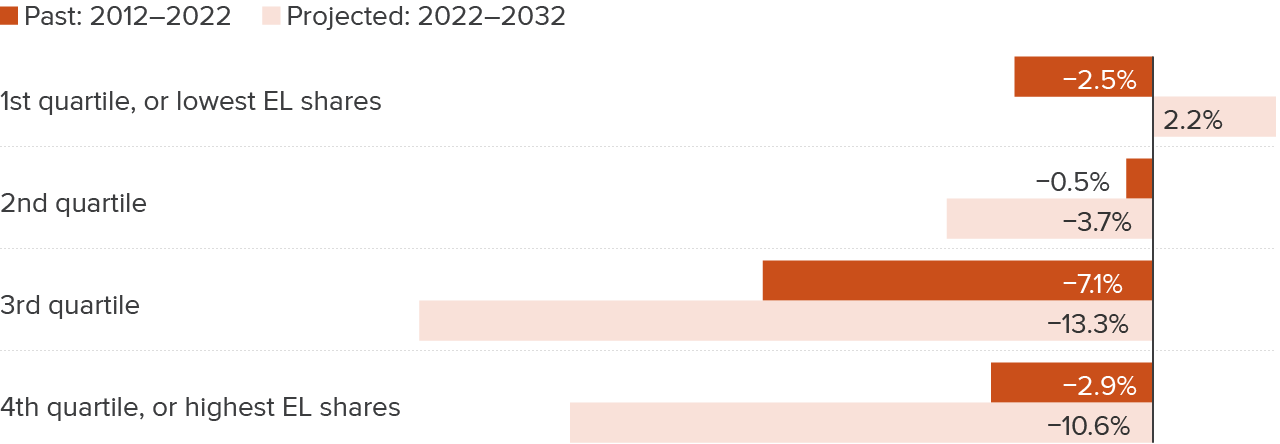
Counties with the highest share of EL enrollment are projected to see larger declines
The share of English Learners in a county is distinctly associated with county enrollment changes, which we can see when we split counties up into quartiles based on their share of EL enrollment (Figure 5). The lowest two quartiles—or those with fewer shares of EL students—had modest enrollment declines: the first quartile of counties saw a 3 percent decline and the second quartile saw a 1 percent decline. These changes are considerably less than the 7 percent decline in third-quartile counties serving larger EL populations.
Projections over the next 10 years suggest that enrollment will fall slightly in the second quartile of counties while rising for the first quartile. This stands in contrast to the median county, where enrollment is projected to decrease by 6 percent in the next 10 years. Thus, enrollment fell the least in counties with relatively low shares of EL students; in the next ten years, these counties are projected to have the smallest enrollment declines and even some increases.
Counties with higher English Learner shares project to see larger declines
Change in enrollment
SOURCES: California Department of Finance; California Department of Education; authors’ calculations.
NOTE: Quartiles defined at the county level and are based on county English Learner enrollment in 2021–22.
On the other hand, counties with relatively high shares of ELs had the biggest drop in enrollment over the past decade—and they are projected to see their future enrollment drop the most. In this third quartile—which includes some of the state’s largest districts like Los Angeles Unified and Fresno Unified—enrollment fell most in the past decade (7%) and is projected to see the largest decline in the next decade (13%).
For the group of counties with the highest share of ELs, the fourth quartile, enrollment declined at a similar rate to counties in the first quartile in the past 10 years—at about a 3 percent decline. However, unlike the first quartile, enrollment is projected to drop by more than three times the amount they witnessed in the past 10 years.
Counties with higher shares of Asian, Latino, and Black students had larger declines
The smallest declines in recent years occurred in counties with a high proportion of white students in their school population; these trends are projected to continue, with minimal declines (Figure 6). Among the largest counties falling into this category are Placer, Sonoma, El Dorado, and Sutter.
Conversely, the largest declines were in counties with high shares of Black, Latino, and Asian students; these counties are expected to continue facing significant enrollment challenges. Among the prominent counties in this group are large southern counties such as Los Angeles, Riverside, and San Bernardino. Interestingly, in counties with low shares of Asian students, enrollment has risen over the past decade, driven primarily by Kern County in the Central Valley.
Counties with high shares of Asian, Black, and Latino students project to see larger declines

SOURCES: California Department of Finance; California Department of Education; authors’ calculations.
NOTE: High (low) reports county-level enrollment changes for counties above (below) the median across counties statewide.
Over the past decade, whether enrollment declined in a county did not vary based on its proportion of low-income students. Projections suggest that these trends will continue, with similarly large declines in counties with higher and lower shares of low-income students. These trends reflect the complex interplay of demographics and economic factors shaping enrollment patterns across counties and regions.
Factors around Pandemic-Era Declines
Enrollment changes during the pandemic reflect long-running demographic trends—namely birth rates and migration, to be discussed in the following section—and changes in schooling choices among some families. However, the disruptions brought on by pandemic school closures in March 2020, the continuation of virtual schooling into the 2020–21 school year, and the continued public health impacts wrought by the COVID-19 pandemic led many parents to reassess their educational options. Chief among these considerations were whether and when to enroll a child in kindergarten or transitional kindergarten, or whether to choose private or homeschooling options in kindergarten or later grades.
Pandemic Enrollment Swings Were Largest for Kindergarten
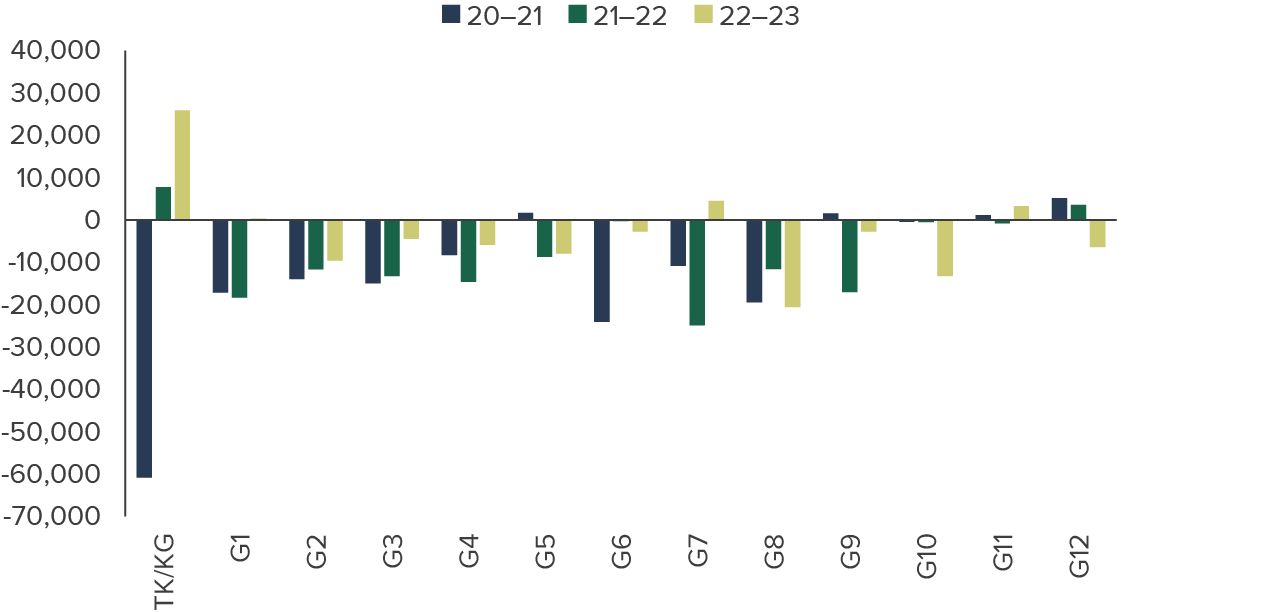
When we examine changes since 2019 by grade, we find that kindergarten drove declines in 2020—falling by over 60,000 students and comprising 38 percent of the total decline across all grades. However, over the next two years, kindergarten enrollment grew most of any grade (Figure 7).
Enrollment swings for kindergarten were much larger than for other grades during the pandemic
Enrollment change
SOURCES: California Department of Education; authors’ calculations.
Kindergarten bounced back slightly in 2021 and had more robust growth in 2022, while most other grades saw modest declines. This swift decline—and bounce back—also confounds transitional kindergarten (TK) enrollment. Because the California Department of Education counts TK students as kindergarteners in the first year of a two-year kindergarten program, baseline changes to kindergarten enrollment may mask differences between the grades.
When we separate out TK from regular kindergarten enrollment, we find that the rise in reported kindergarten enrollment in 2021 and 2022 was almost entirely driven by TK increases: over 90 percent of the 2021 increase and over 80 percent of the 2022 increase is explained by TK enrollment (Technical Appendix Figure A3). Notably, TK enrollment increased by nearly 30 percent in 2022, as TK eligibility expanded as a part of the gradual phase-in of universal TK for all four-year-olds by 2025–26. Declines in 2020 were also much larger for TK (23%) than for kindergarten (12%).
Declines are closer to projections in grades 2–12, exceeding them in early grades
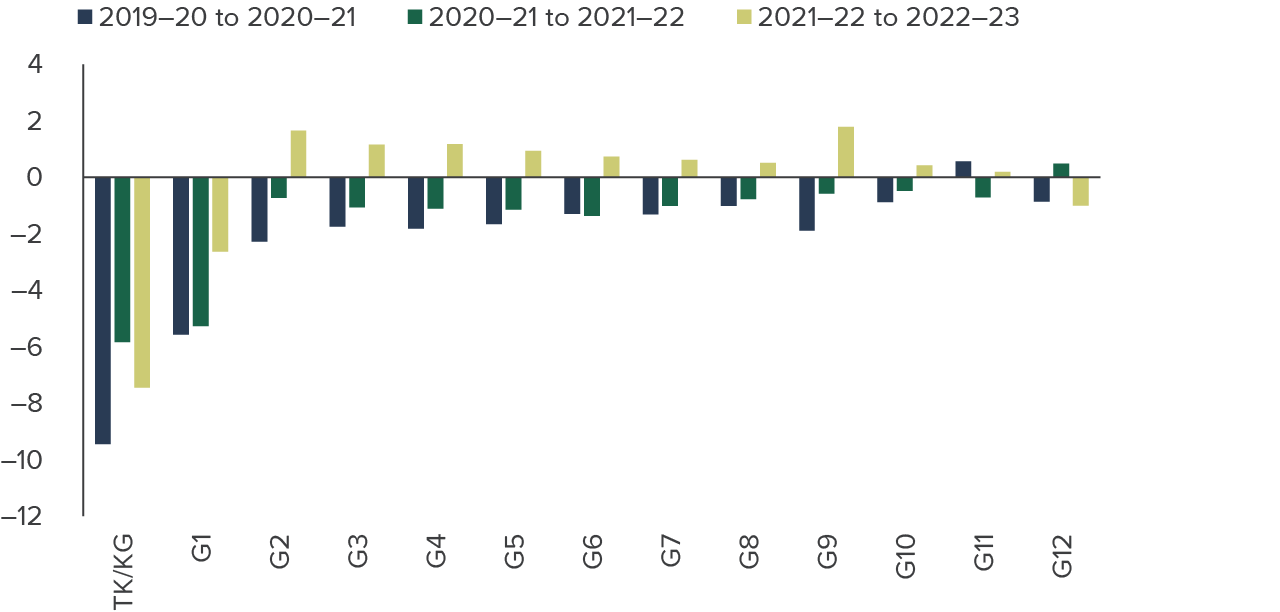
The outsized impact of the pandemic on kindergarten enrollment becomes even more stark when we compare grade-level changes to projections from the prior year. When we measure the “excess decline”—the difference between projected and actual declines—kindergarten and other early grades stand out in 2020, 2021, and 2022 (Figure 8).
In 2021, kindergarten gained only a quarter of expected enrollment. For first grade, the Department of Finance projected an increase of 1 percent compared to an actual decline of nearly 5 percent. Across other grades, enrollment trends were closer to what was expected.
Kindergarten and first grade had far greater differences between expected and actual enrollment declines
Difference between projected and actual enrollment change (%)
SOURCES: California Department of Finance (DOF); California Department of Education; authors’ calculations.
NOTE: Figure reports the difference between the projected change in enrollment and the actual change. Projected changes for 2019–20 to 2020–21 rely on DOF enrollment projections for both years, as DOF did not release a 2020 series report on K–12 enrollment. For 2019–20, enrollment projections were close to actual enrollment across grades.
In 2022, kindergarten and first grade still grew far less than expected—but every other grade saw better than projected enrollment, with the exception of grade 12. Taken together, the excess declines in kindergarten and first grade combined with the expected changes in later grades suggest that the unexpected enrollment decline was largely a story about enrollment decisions by parents of four-, five-, and six-year-olds; these changes go beyond what can be explained by demographic forces like fertility rates.
Some evidence of “excess” growth in enrollment does occur in 2022–23 in most grades, with the largest increase in grade 2. This may indicate that some families who enrolled in private or homeschool options (described in further detail in the next subsection) in lieu of public school for kindergarten and first grade “returned” to the public system. However, more detailed longitudinal information on student choices would be necessary to identify whether this was indeed the case.
Still, these increases are small relative to the excess declines experienced among the youngest students. While some of the excess declines seen in 2020 and 2021 may reflect students in California private and homeschools—or “missing” children not enrolled in any school (Dee 2023)—who will eventually return to the public K–12 system, they may also reflect more families with young children moving out of the state than was initially estimated during the pandemic.
Delayed kindergarten entry—“redshirting”—may explain some of the kindergarten decline
One notable enrollment decision facing parents during the pandemic was whether—and when—to enroll their child in kindergarten. Early in the pandemic, some parents questioned whether to start their children in virtual kindergarten, or “redshirt” them a year, beginning kindergarten at age six in the following year (Sohn 2020). This phenomenon may have happened in California: when we separately examine kindergarten enrollment by age, we see that enrollment among six-year-olds fell by nearly half as much (7%) as it did among five-year-olds (13%) (Technical Appendix Figure A3).
In 2021–22 and 2022–23, enrollment bounced back slightly among five-year-olds but continued to fall for six-year-olds. But by 2023, cumulative changes were roughly the same compared to before the pandemic (Technical Appendix Figure A4). These shifts by age may have been a temporary phenomenon at the beginning of the pandemic, reflecting parents’ preferences to avoid virtual learning for young children by keeping five-year-olds out of school in 2020–21 or enrolling them in a private or homeschool option.
Private School Enrollment Increased—but Explains Only a Small Share of Pandemic Changes
Substituting private school for public school also contributed to pandemic-era enrollment declines for public schools. After falling from a high of 8.9 percent to a low of 7.7 percent in the aftermath of the Great Recession, the share of students enrolled in private school statewide increased swiftly during the pandemic, to nearly 8.8 percent in 2022–23 (Technical Appendix Figure A5).
However, in absolute terms, the rise in private school enrollment is small relative to the drop in public school enrollment (Figure 9)—and small relative to the drop in private school enrollment since 2004 (Technical Appendix Figure A12). Assuming private school enrollment would have stayed constant without the pandemic, we can attribute roughly 12 percent of the total decline in public school enrollment from 2019–20 to 2022–23 to private school substitution.
As public school enrollment plummeted, private school enrollment rose slightly during the pandemic
Change since 2019–20

SOURCE: California Department of Education.
NOTE: Enrollment relative to 2019–20 levels shown for private (dark green) and public (teal) school enrollment. See Technical Appendix Figure A12 for analogous figure including years back to 2004.
Homeschooling surged in 2020 yet remains a small share of overall enrollment
Homeschooling, characterized as private schools enrolling fewer than six students, experienced a remarkable surge in enrollment during the initial year of remote learning, marking the highest figures observed in the last 20 years (Figure 10). Conversely, when we exclude homeschools from 2020 private school enrollment, private enrollment fell by roughly 17,000 students to under 472,000 students, marking the lowest enrollment for private non-homeschools in the past two decades (Technical Appendix Figure A5).
This trend serves as compelling evidence that a significant number of families opted to depart from both traditional public and private educational institutions, favoring homeschooling as an alternative amidst the pandemic. This phenomenon may reflect families seeking to avoid the experience of distance learning and/or mitigate exposure to COVID-19 during the pandemic.
Homeschool enrollment peaked during the pandemic

SOURCE: California Department of Education.
NOTE: Fall year reported in figure (e.g., 2022 is 2022–23).
The Demographic Makeup of the Student Population Changed in the Pandemic
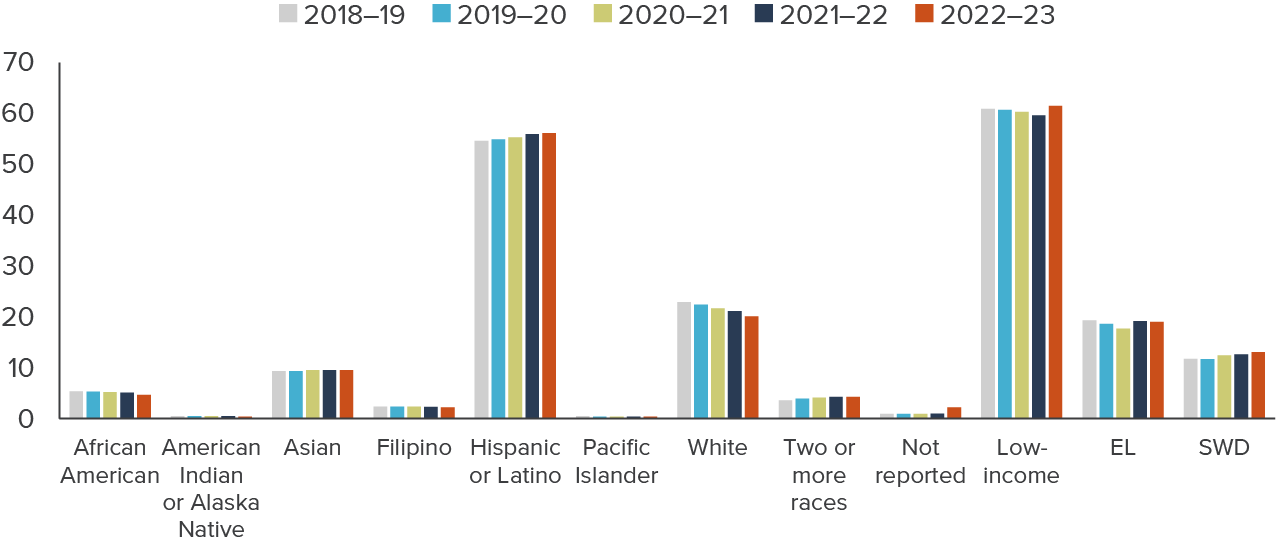
The demographic composition of California’s public schools has shifted in recent years (Figure 11). Most of the state’s students are Latino, and that share has risen, both before and after the pandemic. Conversely, the share of white students has been declining, a trend that also predates and continued through the pandemic. The share of Black students has also declined, going from 5.4 percent in 2018–19 to 4.7 percent in 2022–23.
Overall, statewide racial shares did not change very discretely during the first two years of the pandemic, despite the large enrollment swings. The most notable pandemic-era changes came with the share of low-income students and the share of EL students.
- EL rates fell modestly in the first year of the pandemic—from 18.6 to 17.7 percent—before increasing to slightly above the pre-pandemic levels in 2021 and 2022. This is likely the result of delayed identification of EL needs during remote schooling, rather than an underlying shift in the population of dual language learner students in the first year of the pandemic.
- The share of low-income students also declined slightly in 2021–22 but rose again in 2022–23.
- Notably, the share of students with disabilities (SWD) has also increased during this time, from 11.7 percent in 2018–19 to 13.1 percent in 2022–23. While the increase has been gradual, a higher share of SWD brings additional budgetary pressure during spells of declining enrollment, as funding is based on overall attendance and not the attendance of SWD.
California’s TK–12 student body is becoming more Latino, less white
Share of enrollment (%)
SOURCE: California Department of Education.
NOTES: Only the seven largest racial/ethnic groups in terms of student enrollment shown. Low-income refers to socioeconomically disadvantaged students under CDE’s definition. EL denotes English Learners. SWD denotes students with disabilities. Pacific Islander, “Two or more races”, and “not reported” categories not included on figure.
Declines are much greater among current and former ELs than English fluent or English only students
While EL student enrollment has increased slightly in recent years—to above pre-pandemic levels—a different trend emerges when we focus on the population of students that are either current or former ELs (“ever-ELs”). The total enrollment of current or former (reclassified) EL students has dropped by nearly 14 percent since 2017–18, from nearly 2.38 million students to just about 2 million students in 2022–23. While roughly 40 percent of this drop occurred during the pandemic, from 2019–20 to 2020–21, enrollment for these ever-EL students has declined by 25,000 to 50,000 per year in other years, a trend predating the pandemic by two years (Figure 12).
Enrollment has fallen notably among students who have ever been English Learners

SOURCE: California Department of Education.
NOTE: Current and former EL includes students currently identified as EL and reclassified former EL students. English Only and Initially Fluent includes students with only English as a home language or who were classified initially English fluent upon school entry.
Conversely, for students who were never ELs, enrollment declines have been slight. Combining students with English as a home language (“English only”) and students who enter initially proficient in English, we see a much smaller decline: only 45,000 students, or 1.2 percent. Data for LA County—the county serving the largest number of students and roughly one-quarter of the state’s ever-EL students—show a similar pattern, with very large declines among ever-EL students (21% since 2017–18) versus declines a quarter of the size for never-EL students (5.2%). These trends in part reflect changing patterns around birth rates and immigration, as roughly 80 percent of EL students are Spanish speakers and birthrate declines have been larger among Latina women in California (Johnson and McGhee 2021).
Long-term Factors Influencing Declines
Even before the pandemic, enrollment had just started to decline and was projected to fall through the 2020s (California Department of Finance 2019; Warren and Lafortune 2020). The pandemic initially accelerated these declines, but many of the excess changes happened in early grades and are likely related to remote schooling and other pandemic disruptions—reflecting temporary rather than permanent shocks to the state’s TK–12 enrollment. Over the longer term, two main demographic factors are influencing projections for future declines: declining births and net outmigration of residents outside of California.
Population Slowdown and Declining Birth Rates Continue to Put Downward Pressure on Enrollment
One of the most important factors driving public school enrollment—at the state and local levels—is the number of births. Births depend on the size of the population and birth rates. For decades, California’s population grew year over year, but recently California’s population growth rate has slowed and even declined in 2021 and 2022 (Johnson, McGhee, and Cuellar Mejia 2023).
Total fertility rates in California have fallen since 1990, from 2.5 births per woman to under 1.7. After a decade of stability (Figure 13), birth rates began falling again in 2007. Rates are projected to fall further, to around 1.5 by 2040—far below the “replacement rate” of about 2.1.
Fertility rates have steadily declined for much of the past 30 years, and are projected to decline further through 2040
Total fertility rate

SOURCE: California Department of Finance.
NOTE: Projections from DOF Vintage 2023 Release, based on baseline 2019 population projections. Total fertility rate (TFR) represents the average number of children per woman the current group of mothers would bear if they had children at the age-specific period rates.
As a result of slowing population growth and fewer births per woman, the number of births in California has gone from roughly 500,000 per year a decade ago to under 420,000 last year (Technical Appendix Figure A6). These numbers affect the size of the kindergarten cohort five years later. As successively smaller cohorts work their way up through the grades, enrollment eventually declines. This lag in part explains why total K–12 enrollment declines were only just beginning at the onset of the pandemic.
More School-Aged Children Moved to Other States than into California from Other States
Migration patterns are also a contributing factor in statewide enrollment declines. In recent years, more children have left for other states than have come in from other states; historically, this difference has been partially mitigated by a large number of children who come from outside the country.
After a decade of near constant net migration to other states, the rate roughly doubled its pre-pandemic average in 2021—about 35,000 more children left the state in 2021 than in 2019 (Figure 14).
Greater immigration from other countries has not balanced domestic migration to other states. For most of the 2000s and 2010s, the net flow of international immigrants moving into California exceeded or matched the net flow of California residents moving out to other states. International migration has declined somewhat and net migration to other states has accelerated at such a pace that total net migration from domestic and international moves has become negative (Technical Appendix Figure A8).
Moves to other states among school-aged children have long outnumbered moves into California; outmigration has accelerated since 2020
Net interstate migration, 5–17 year-olds

SOURCE: American Community Survey; Authors’ calculations.
NOTE: Figure reports net interstate migration to/from California for 5–17-year-olds.
District Responses to Enrollment Declines
The experiences of districts that have faced spells of declining enrollment can help us assess how future declines may affect districts—and their schools and students. Statewide enrollment peaked in 2004 but over one-third of districts saw enrollment fall over the five prior years; in 14 percent of districts, enrollment declined 10 percent or more over five years—the equivalent of a continued enrollment loss of 2 percent per year (Figure 15).
By 2019, over half of districts were in decline; in 2022–23, that rate has risen to 73 percent. More than a quarter of districts (28%) saw enrollment fall by 10 percent or higher within the past five years. This trend may continue, with roughly 73 percent of districts expected to see further declines in the next five years, according to DOF projections (Technical Appendix Figure A9).
The share of districts experiencing a five-year decline jumped from roughly 50 to above 70 percent since the pandemic
Percent of districts

SOURCE: California Department of Education; authors’ calculations.
NOTES: Enrollment change based on five-year lagged enrollment change. Small districts with fewer than 100 students excluded.
What impact do these enrollment declines have on districts? Hold-harmless provisions—like the one-year lag built into California’s formula pre-pandemic—provide temporary insulation and delay the full impact on district finances, leading to higher per student levels of funding even as overall funding levels fall. This provides a partial buffer to districts, allowing most to maintain class sizes even as new hiring may wane after several years of falling enrollment; the teachers who remain, however, can cost more because of their higher level of experience (Warren and Lafortune 2020).
These staffing changes may benefit students and offset other inefficiencies during downsizing (e.g., Gigliotti and Sorenson 2018), but they also reflect new constraints. Districts may face increasing per staff costs when downsizing—students gain more experienced educators, but staffing costs may crowd out resources for other student services.
School Closures Are Uncommon during Spells of Declining Enrollment
When declines occur in districts facing constraints around facility capacity, they may gain space that may benefit new programs or allow existing ones to expand—like TK, community schools, and after school programs. However, when declines become large and persistent, districts may need to do more than reduce staffing and services, and close or repurpose school sites.
The decision to close a school can be unpopular among students, parents, and the broader community; schools often hold significance in a community beyond their role of serving current students (e.g., McBride 2022). Furthermore, the short-run savings from closures are not always large, in part because savings gained by eliminating site-specific staff are limited—in many cases educators and administrative staff are transferred to new sites—and because districts must still spend to maintain closed facilities to avoid them falling into disrepair (Dowdall 2011).
Most declining districts did not close school sites in the decade before the pandemic, according to enrollment records. Among districts with 10 percent or greater enrollment losses from 2009 to 2019, only one-third reduced the number of schools they operated (Figure 16). A small share (10%) actually increased their number of schools, while most remained constant. Among districts facing more moderate enrollment declines, school closures were even less common.
Most districts with declining enrollment do not close schools
District enrollment change, 2009–2019

SOURCE: California Department of Education; authors’ calculations.
NOTE: Closed schools defined as district having fewer schools in operation; added schools defined as district having more schools in operation. School count and student enrollment changes based on the 10-year pre-pandemic change from the 2009–10 to the 2019–20 school year.
Closed Schools Often Served Higher Shares of Lower-Income Students and English Learners than Schools that Remained Open
While school closures have been uncommon in declining districts in recent years, they still occur. Statewide, students in closed schools in the last decade are more likely to be Black or low-income and less likely to be Latino or Asian American than the statewide average (Hahnel and Marchitello 2023). Moreover, continued and accelerating declines in most regions suggest that the fiscal pressure to reduce the number of school sites will grow. Equity is an important consideration when districts downsize and close schools: do the sites they choose to close reflect the districtwide student population? Or do districts more often choose to close schools serving lower-income and English Learner students?
To examine the equity of school closures, we look at the difference in demographics between schools that closed since 1996 and the districtwide average, for districts with 10 or more schools (Figure 17). Overall, in declining districts, the schools that close have higher shares of low-income students (by 6 percentage points) than the districtwide average, and slightly higher shares of English Learners (by 2 percentage points). However, the overall average combines districts with large socioeconomic differences across school sites—that is, with more socioeconomic stratification—and those with little to no difference where we would not expect any difference in demographics from closed schools.
When we restrict attention to only those schools that closed in districts with above-median socioeconomic segregation, we see a stark pattern of inequity. In these declining districts, schools that close are 14 percentage points more low-income, 14 percentage points more high-need, and 7 percentage points more EL than the rest of the district.
Conversely, differences between closed and remaining schools are minimal in districts with low levels of segregation. Thus, while school closures may not (yet) be a common choice among declining districts, the fact that socioeconomically stratified districts tend to close relatively higher-poverty and higher-EL schools implies that higher-need students may face disproportionately greater burdens from declining enrollment spells that lead to school closures. This finding is also consistent with other research in California showing disparities in school closure rates by race, even when holding constant other school-based demographic and outcome characteristics (Pearman et al. 2023).
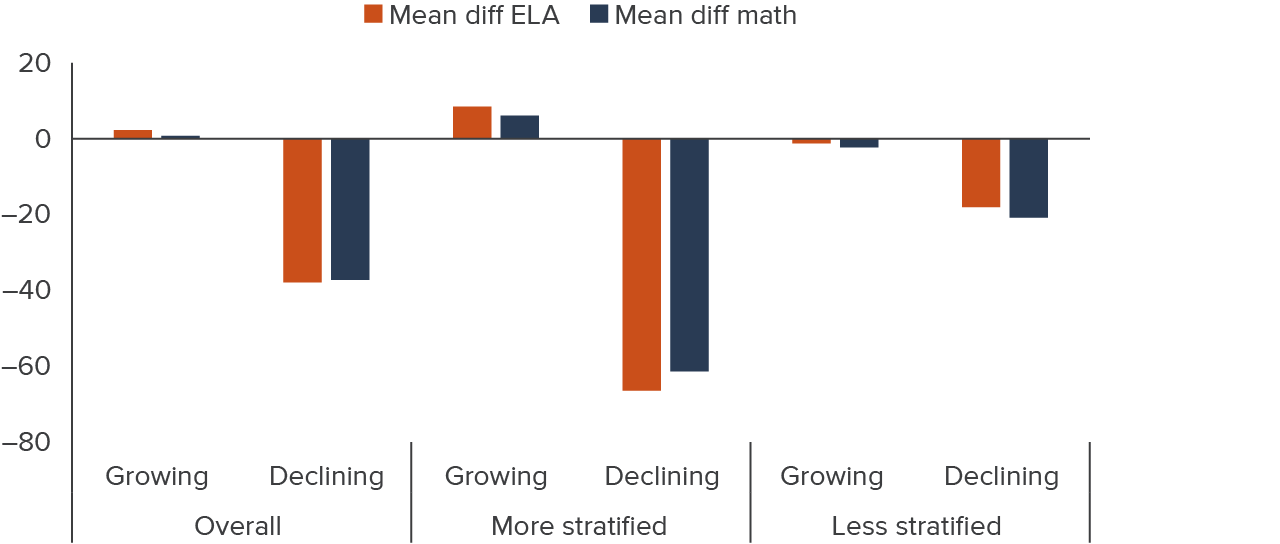
In districts with wider income segregation, closed schools have far more low-income students than the rest of the district
Closed school vs district average (%)

SOURCE: California Department of Education; authors’ calculations.
NOTES: More (less) stratified defined as being above (below) the median in the difference between the districtwide average school share low-income and the highest school share low-income in a district. Growing and declining districts defined using the lagged five-year enrollment change at the time of the school closure. Mean differences for each closed school calculated using leave-out means, which exclude that school from the districtwide average. Data span 2012–13 to 2022–23. Analogous chart spanning 1995–96 to 2022–23 reported in Technical Appendix Figure A10.
Districts with Falling Enrollment Close Schools with Lower Test Scores
We see stark differences between test scores for schools that close and schools that remain open in a district: closed schools score lower in math and English Language Arts (ELA) by 40 percent of a standard deviation on average than schools that remain open (Figure 18). This gap is even wider in districts with greater income segregation: 66 percent in ELA and 61 percent in math.
In declining districts, closed schools have lower test scores than schools that remain open
Closed schools vs district average test scores (% of SD)
SOURCE: California Department of Education; authors’ calculations.
NOTES: More (less) stratified defined as being above (below) the median in the difference between the districtwide average school share low-income and the highest school share low-income in a district. Growing and declining districts defined using the lagged five-year enrollment change at the time of the school closure. Mean differences for each closed school calculated using leave-out means, which exclude that school from the districtwide average. Data span 2012–13 to 2022–23. Analogous chart spanning 1995–96 to 2022–23 reported in Technical Appendix Figure A11.
We would expect that closing schools with higher shares of low-income students would also mean closing schools with lower average test scores and vice versa—given large disparities in test scores by income, EL status, and race. If districts close low-performing schools and students can switch to higher-performing schools, students may benefit—research suggests such moves have benefited students subject to school closures or downsizing (Kemple 2015; Carlson and Lavertu 2015).
However, students do not always move to higher-performing schools and immediate disruptions from switching schools can adversely affect their academic progress (Gordon et al. 2018; Larsen 2020; Steinberg and MacDonald 2019). Importantly, the initial academic losses suffered when students switch schools can be mitigated over time if students switch to higher-performing schools (de la Torre and Gwynne 2009; Engberg et al. 2012).
Discussion and Policy Implications
Enrollment fell by record numbers at California public schools amid the pandemic; current trends of falling birth rates and accelerating migration to other states underlie projections that declines will continue across the state over the coming decade. While projections come with some uncertainty, the state knows how many TK–12 students may enter the system in the next five years from birth records alone, meaning that there is less scope for enrollment trends to change considerably without large shifts in people migrating into the state.
Nevertheless, projections are not prophecy, and they reflect considerable uncertainty around demographic forces; some of these forces—like migration and private school enrollment—continue to evolve in the aftermath of the pandemic. Less reassuring is that past demographic projections by the state have tended to understate declines; federal projections for California show a more drastic decline, with the school system falling to under 5 million students by 2031.
Should declines of this extent materialize—an over 1 million student decline in enrollment in just over a decade—it would have significant implications on district finances, operations, staffing, and school facilities in nearly all reaches of the state. It could also have a silver lining: the Proposition 98 guarantee could mean much greater per pupil funding, so long as the state budget continues to grow at or about the rate of inflation. Statewide, this change would mean more resources for schools, as, per capita, taxpayers support fewer students and children.
Accelerating declines could bring added pressure to close schools. With these closures come concerns that some students will bear the costs of downsizing more than others. Indeed, the counties and regions with higher shares of low-income, English Learner, Black, and Latino students are projected to see even larger declines.
While the average district with declining enrollment tends not to close schools, our analysis reveals that districts have tended to close schools with higher shares of high-need and English Learner students in recent years, especially in districts with greater stratification by income. However, closed schools also had lower test scores. Moving students to higher-performing schools could improve learning, though past research studying school closures indicates switching schools is disruptive. Furthermore, declining enrollment may ease capacity constraints on facility space in some districts, allowing sites to expand program offerings such as TK, community schools, and after-school programs.
Enrollment declines may also create new competitive pressures between nearby districts, as they seek to maintain enrollment levels or mitigate declines. Attracting students and their families from nearby districts—either through interdistrict transfers or by motivating more families to move into the district—is an approach districts have at their disposal to mitigate declines.
On the one hand, increased pressure to attract students and families by providing higher-quality services and educational options provides a win-win for districts and their families—and has been a strategy touted by the California Department of Education in their guidance to districts around declining enrollment. On the other hand, declines due to demographic changes mean that some districts will “lose twice”: once from fewer children living in their boundaries and again from some of these students attending school elsewhere.
Policymakers may need to carefully balance parental desire for choice as districts compete for students with the fiscal pressures such competition could cause. We offer three general recommendations for state policy as we move further into a decade—or longer—of a decreasing student population:
Provide greater assistance and information to districts on effective and efficient downsizing. Some districts have the capacity and expertise to project enrollment and use budget projections to guide current fiscal actions, but many do not. Additional guidance from state education officials, specific assistance from county offices, and professional training for school budget officers to understand how to effectively and efficiently manage declines will be key to ensuring that student services and educational opportunities do not diminish as the system downsizes. Such guidance could include demographic projections to aid districts to build multi-year projections, or guidance on when and how to reduce services—such as reducing staffing, consolidating classes, or closing school sites. However, downsizing may also present opportunities to retrain staff to fill critical staffing needs, for example, by incentivizing or creating new pathways for teachers to receive additional training and an added credential in special education teaching, where needs are ongoing and widespread.
The state may also consider requiring districts, in particular ones with large enrollment declines, to develop and submit budget projections for longer time horizons—five, instead of three years—as a part of county office fiscal oversight.
Prioritize equity in decisions on school closures so that they do not disproportionately affect high-need students and neighborhoods within a district. Where declines require the district to make decisions around closing schools, those decisions should avoid exacerbating longstanding educational inequities. Closing low-performing schools may eventually benefit students who switch to higher-performing schools—but research also identifies immediate disruption costs to students from closures. State and local officials must ensure equity is a priority in closure decisions and that community stakeholders participate and shape these decisions. Moreover, school closures may also offer an opportunity to draw more equitable school boundaries and counteract residential segregation in some districts (e.g., Monarrez 2023).
Districts statewide could also benefit from additional guidance and assistance on alternatives to school closures, which may involve repurposing school sites for other program needs, or leasing and/or selling facility space as a method to generate revenue. As enrollment declines accumulate over the coming decade(s), school facility footprints will need to evolve to better serve the needs—and number—of current students.
Avoid insulating districts from enrollment declines through additional funding. The projected declines facing the state will likely persist for several years, and absent future birth rate increases or drastic changes in migration, California’s K–12 system may be considerably smaller in the coming decades. Additional funding for hold harmless only delays what may eventually be necessary downsizing and does not effectively distribute funds based on where current students attend school, nor where the students with the greatest needs are.
Instead, the state should consider alternative uses of any additional per-student dollars to improve and increase services, particularly for students with the greatest needs and where academic and outcome disparities are the most prominent.
Topics
K–12 EducationLearn More

Enrollment Is Falling across California’s School Districts

California’s K–12 Students

California’s Changing School Demographics

California’s Transitional Kindergarten Expansion

Private Schooling Played a Small Role in Declining Public School Enrollment

Kindergarten Enrollment Declines Mask Differences by Age

Public School Enrollment across California’s Regions, Past and Future

Public School Enrollment Declines Vary across Grade Levels
