

Table of Contents
- Key Findings
- Approval Ratings and K–12 Policy Direction
- COVID-19 and K–12 Schools
- Local Public Schools
- School Teachers
- Funding for Public Schools
- Early Childhood Education
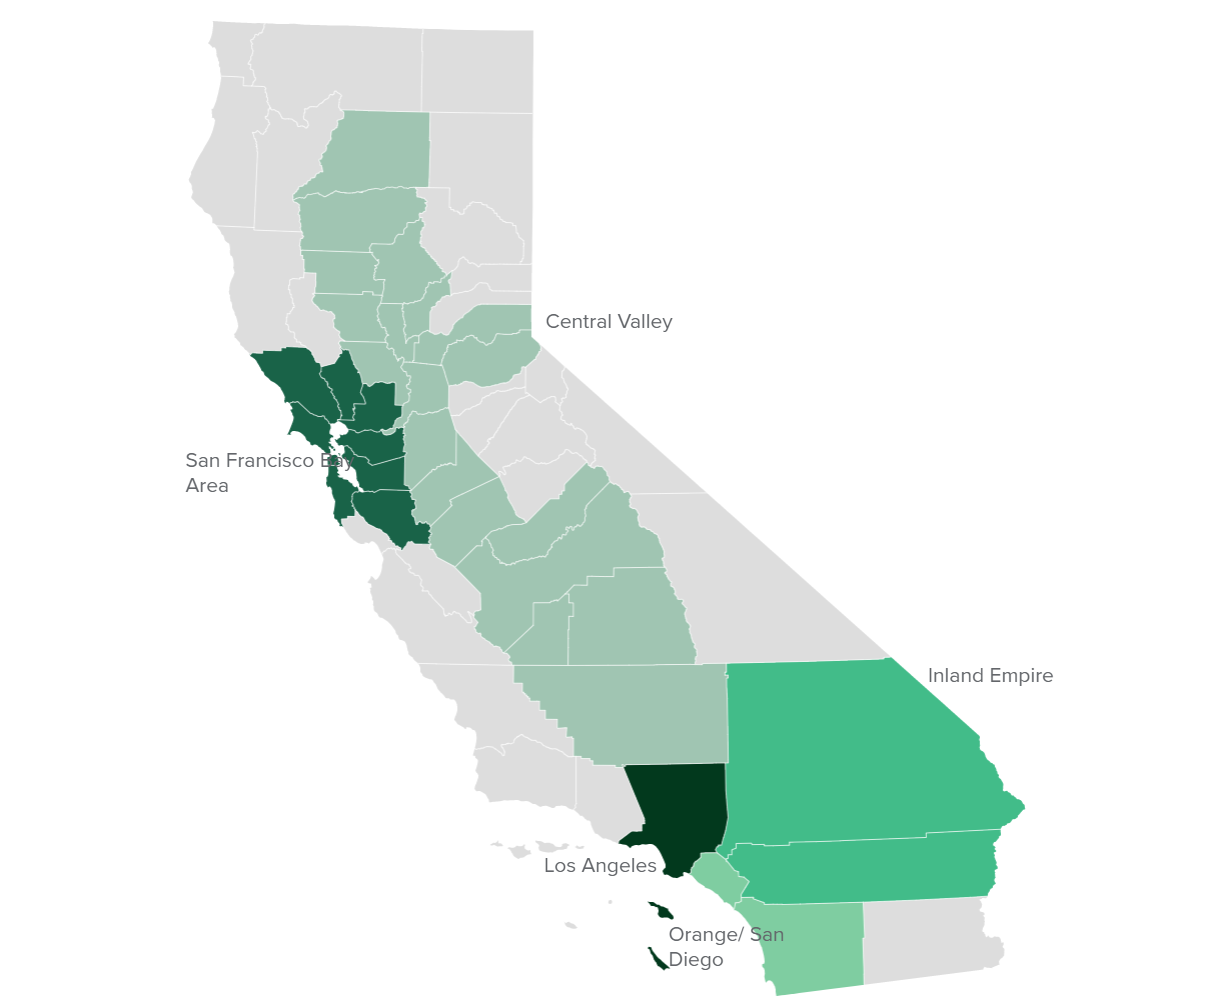
- Regional Map
- Methodology
- Questions and Responses
- Authors and Acknowledgments
- PPIC Statewide Advisory Committee
- PPIC Board of Directors
- Copyright
Key Findings
California’s K–12 public schools returned to more normal conditions this spring for students, teachers, and parents as COVID rates declined and mask mandates were lifted. Still, there are lingering questions about state mandates for COVID vaccinations in local public schools, and concerns about how to best address the educational inequities clearly in evidence during the pandemic. Strong revenue growth at the state level is providing a positive fiscal outlook for local school districts this year; however, declining enrollment raises questions about future finances.
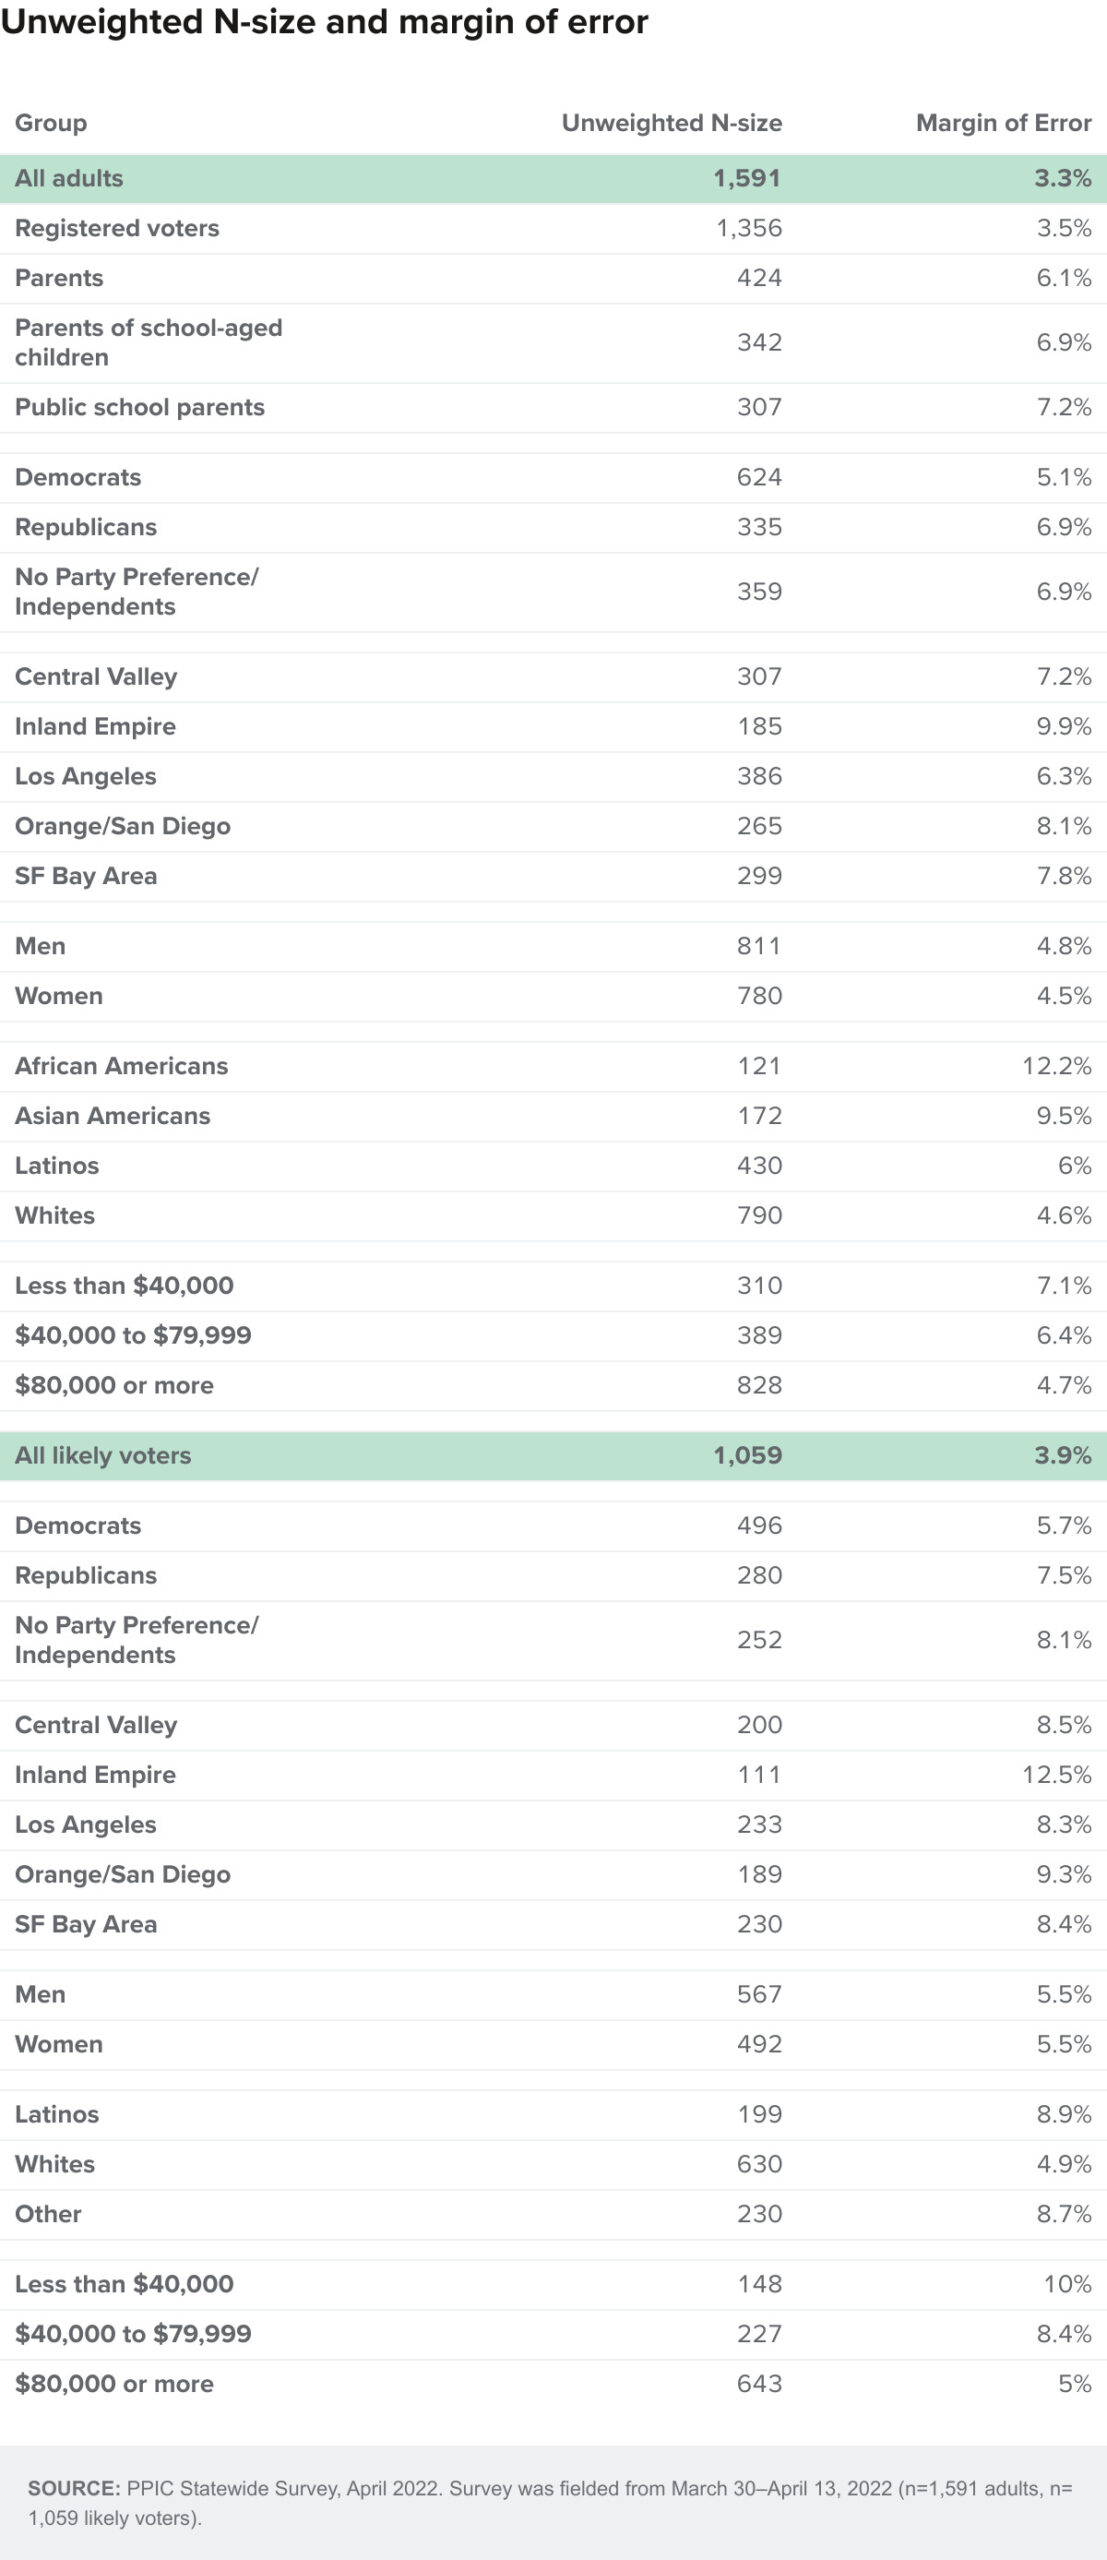
These are the key findings of a statewide survey on K–12 education conducted by the Public Policy Institute of California from March 30 to April 13, 2022:
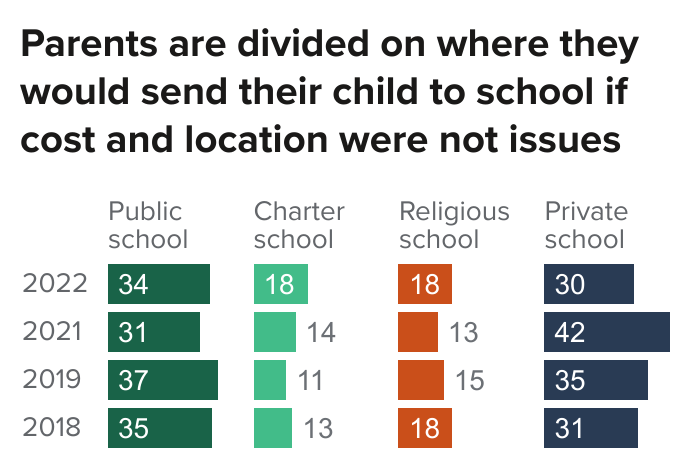
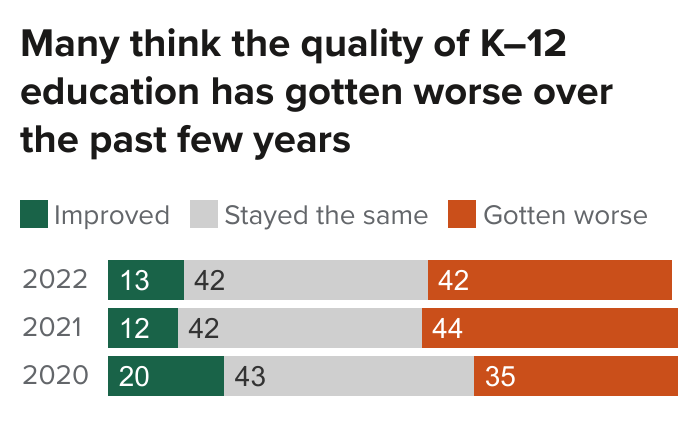 About four in ten Californians think the quality of education in the state’s K–12 public schools has gotten worse over the past few years. Almost half of parents say they would send their child to a private school or a religious school if cost and location were not an issue.
- Solid majorities of adults and public school parents approve of Governor Newsom’s handling of the K–12 public education system. Majorities also say the K–12 public education system today is generally going in the right direction, with partisans deeply divided. →
- More than four in ten parents say their child has fallen behind academically during the pandemic. They are divided on whether the biggest challenge for students is catching up academically or dealing with the pandemic’s social-emotional impacts. Most approve of no longer requiring masks in schools and support requiring COVID vaccines for teachers and students. →
- Half of adults and about six in ten public school parents give A or B grades for the quality of public schools in their neighborhood today. Majorities say that their local public schools are doing an excellent or good job in preparing students for college and the workforce. →
 About six in ten adults and public school parents think that salaries for teachers are too low in their community. A strong majority also say that schools in lower-income areas should pay higher salaries to attract and retain teachers, even if it costs the state more money. →
- Half of Californians say the level of state funding for their local public schools is not enough. Majorities of likely voters would vote yes on state and local bond measures for school construction projects while a majority would vote no on a local parcel tax for school funding. →
- Most Californians believe that preschool is important for student success in K–12 schools and think the affordability of preschool education is a problem in California today. Overwhelming majorities say the state should fund voluntary preschool for all four-year-olds in California. →
 About six in ten adults and public school parents think that salaries for teachers are too low in their community. A strong majority also say that schools in lower-income areas should pay higher salaries to attract and retain teachers, even if it costs the state more money.
 Approval Ratings and K–12 Policy Direction
Solid majorities of adults (60%) and public school parents (73%) approve of the way that Governor Newsom is handling the state’s K–12 public education system. Similar shares of adults approved last April, while public school parents were somewhat less likely to approve. Majorities have approved of the governor’s handling of education since 2019. Today, majorities of Democrats (83%) and independents (53%) approve, while 78 percent of Republicans disapprove. Regionally, approval of the governor’s handling of K–12 education is higher in coastal areas (66% Los Angeles, 63% San Francisco Bay Area, 61% Orange/San Diego) than in inland areas (53% Inland Empire, 51% Central Valley). At least half across demographic groups approve of Governor Newsom’s handling of K–12 education. Fifty-six percent of adults and 71 percent of public school parents approve of the state legislature’s handling of K–12 education; last April, views were similar among adults (54%), but public school parents were much less likely to approve (52%).

Majorities of adults (57%) and public school parents (70%) also believe the state’s K–12 public education system is going in the right direction. Public school parents were somewhat less likely to hold this view last year (61%). Today, an overwhelming majority of Democrats say K–12 education is going in the right direction, while most Republicans and half of independents think it is going in the wrong direction. Majorities in Los Angeles (63%), the San Francisco Bay Area (58%), and Orange/San Diego (57%) say right direction, while Central Valley (51% right direction, 46% wrong direction) and Inland Empire residents (49% right direction, 48% wrong direction) are divided. Across racial/ethnic groups, solid majorities of Latinos (66%), African Americans (65%), and Asian Americans (61%) believe the state’s K–12 public education system is going in the right direction, while whites are divided (46% right direction, 49% wrong direction).

While most adults and public school parents say the quality of K–12 public education is a problem, a majority think it is somewhat of a problem (52% adults, 54% public school parents) rather than a big problem (32% adults, 22% public school parents). Fourteen percent of adults and 23% of public school parents say it is not much of a problem. The perception that quality is a problem was similar among adults last April but more prevalent among public school parents (24% big, 61% somewhat). Today, most Republicans say education quality is a big problem, while a majority of Democrats and independents think it is somewhat of a problem. Overwhelming majorities across the state’s regions and demographic groups believe the quality of public education is a problem; more see it as somewhat of a problem than as a big problem.

COVID-19 and K–12 Schools
As the end of the 2021–22 school year approaches, majorities of both parents of school-age children and public school parents say their youngest school-age child has not fallen behind academically during the pandemic (54% parents of school-age children, 53% public school parents). More than four in ten say their youngest child has fallen behind academically, but these parents are more likely to say their youngest has fallen behind a little (25% parents of school-age children, 26% public school parents) than a lot (19% parents of school-age children, 20% public school parents). Across racial/ethnic groups, whites (38%) are much less likely to say their child has fallen behind than are Latinos (52%). (Sample sizes for Asian American and African American parents of school-age children are too small for separate analysis.) Parents in households with higher educational attainment and higher incomes are also much less likely to say their child has fallen behind academically than parents who are not college graduates and have lower incomes.

Forty-seven percent of adults say catching up academically will be the biggest challenge for public school students in their community in the next school year; fewer say dealing with the social-emotional impacts of the pandemic (33%) or readjusting to regular school schedules and routines (18%) will be the biggest challenge. Public school parents are more divided on this question (45% catching up, 40% social/emotional impacts, 14% schedules). A majority of Republicans and a plurality of independents think catching up academically will be the biggest challenge, while Democrats are divided between academics and social-emotional impacts. Four in ten or more across the state’s major regions and demographic groups say catching up academically will be the biggest challenge. The share saying catching up academically will be the biggest challenge is much higher among homeowners (53%) than among renters (40%).

As of March 11, students in California’s schools are no longer required to wear masks, although the state strongly recommends masking. Solid majorities of adults (32% strongly, 29% somewhat) and public school parents (43% strongly, 31% somewhat) support the state’s decision to no longer require masks in schools; fewer than four in ten oppose the decision. There is partisan agreement on this question, with a majority of Republicans, independents, and Democrats supporting the state’s decision, although Republicans are far more likely to be strongly supportive. Across racial/ ethnic groups, most African Americans, Latinos, and whites support the decision, while a majority of Asian Americans oppose it. Majorities across regions as well as age, education, gender, homeownership, and income groups support the decision to no longer require masks in schools. Most Californians also agree that COVID vaccines should be required for teachers (71% adults, 68% public school parents) and for students in California schools if they are approved by the US Food and Drug Administration (68% adults, 66% public school parents).

Local Public Schools
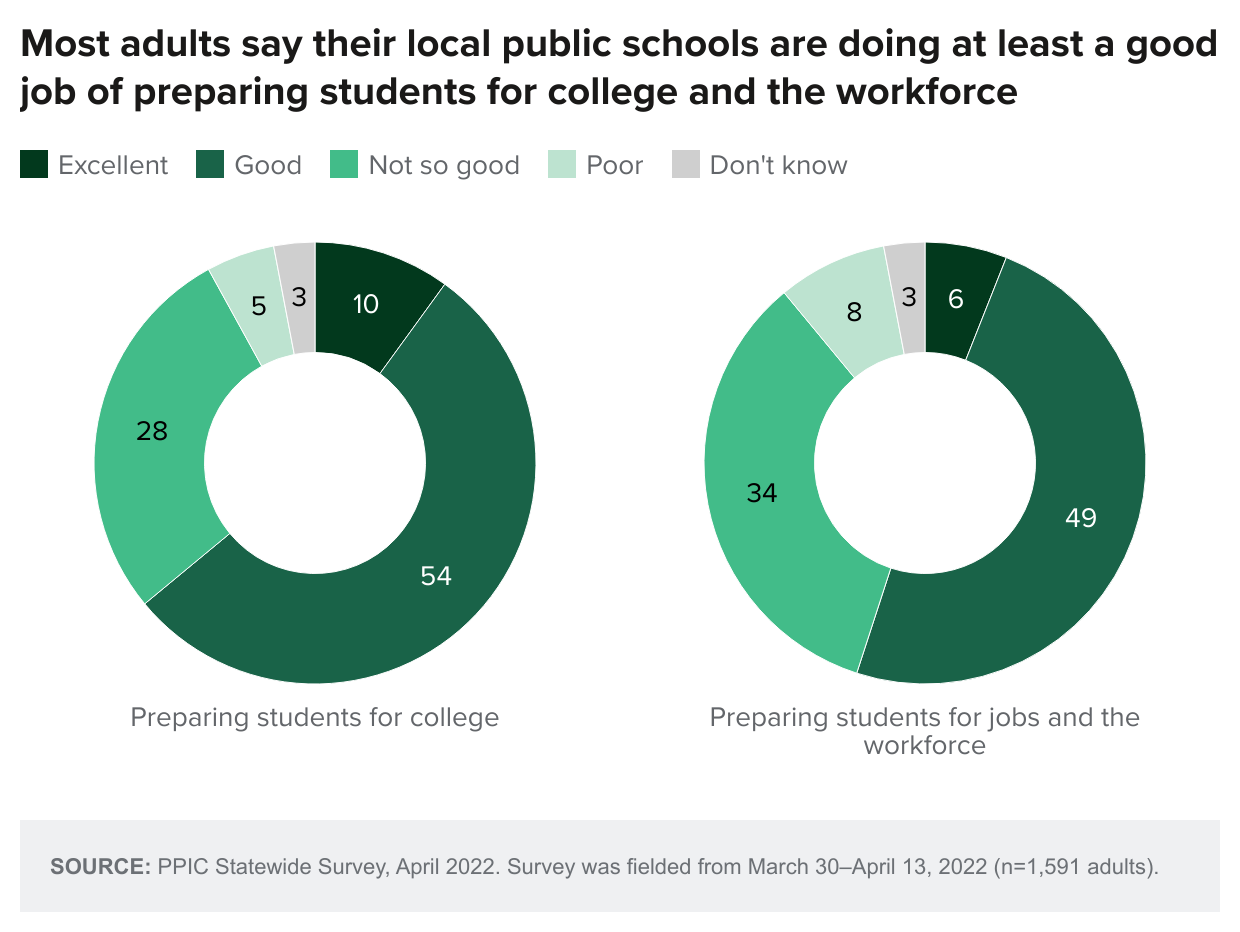
Majorities of adults and public school parents say their local public schools are doing an excellent or good job preparing students for college (adults: 10% excellent, 54% good; public school parents: 14% excellent, 63% good). Responses for adults were similar last April (7% excellent, 55% good) but positive views were somewhat lower among public school parents a year ago (7% excellent, 64% good). Today, majorities across demographic groups and regions hold a positive view. When asked how local public schools are doing in preparing students for jobs and the workforce, a majority of adults (6% excellent, 49% good) and public school parents (10% excellent, 56% good) express positive opinions. The shares with this view are similar to a year ago (adults: 6% excellent, 48% good; public school parents: 5% excellent, 59% good). About half or more across demographic groups and regions hold positive views.
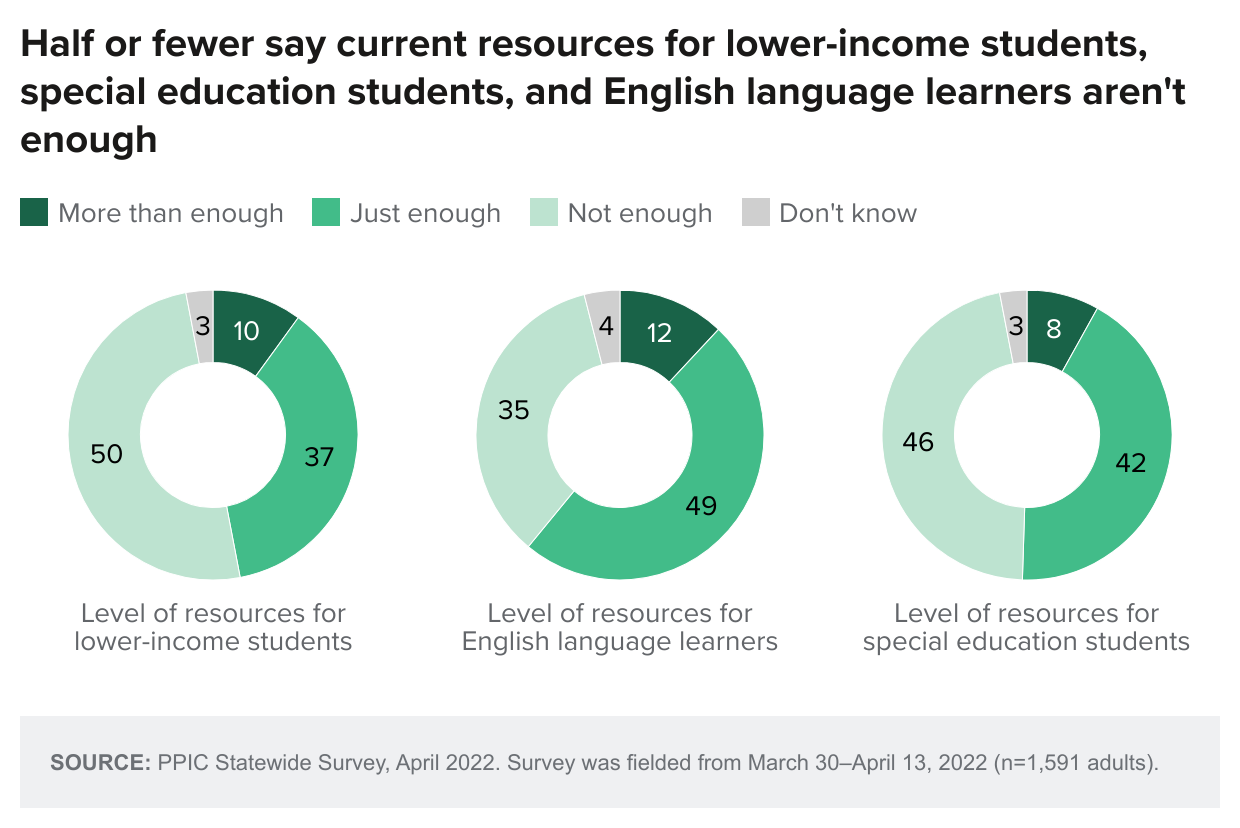
About half of adults (50%) and public school parents (49%) say the current level of resources for lower-income students is not enough, and similar shares said this last April. Today, 65 percent of African Americans say these resources are inadequate, compared to fewer in other racial/ethnic groups. The share saying resources are not enough decreases with rising age. When asked about the current level of resources for English language learners, 35 percent of adults and 31 percent of public school parents say it is not enough. Similar shares said this a year ago. Today, African Americans are most likely among racial/ethnic groups to say current resources are not enough. Views vary across regions: 29 percent in Orange/San Diego say English language learner funding is not enough, compared to 42 percent in the Inland Empire. Views are mixed when it comes to resources for special education students: 46 percent of adults and 45 percent of public school parents say the current level is not enough. African Americans (58%) are again most likely across racial/ethnic groups to say this. The share saying these resources are inadequate decreases with rising age. Nearly half or more across regions hold this view, with the exception of Orange/San Diego residents (36%).
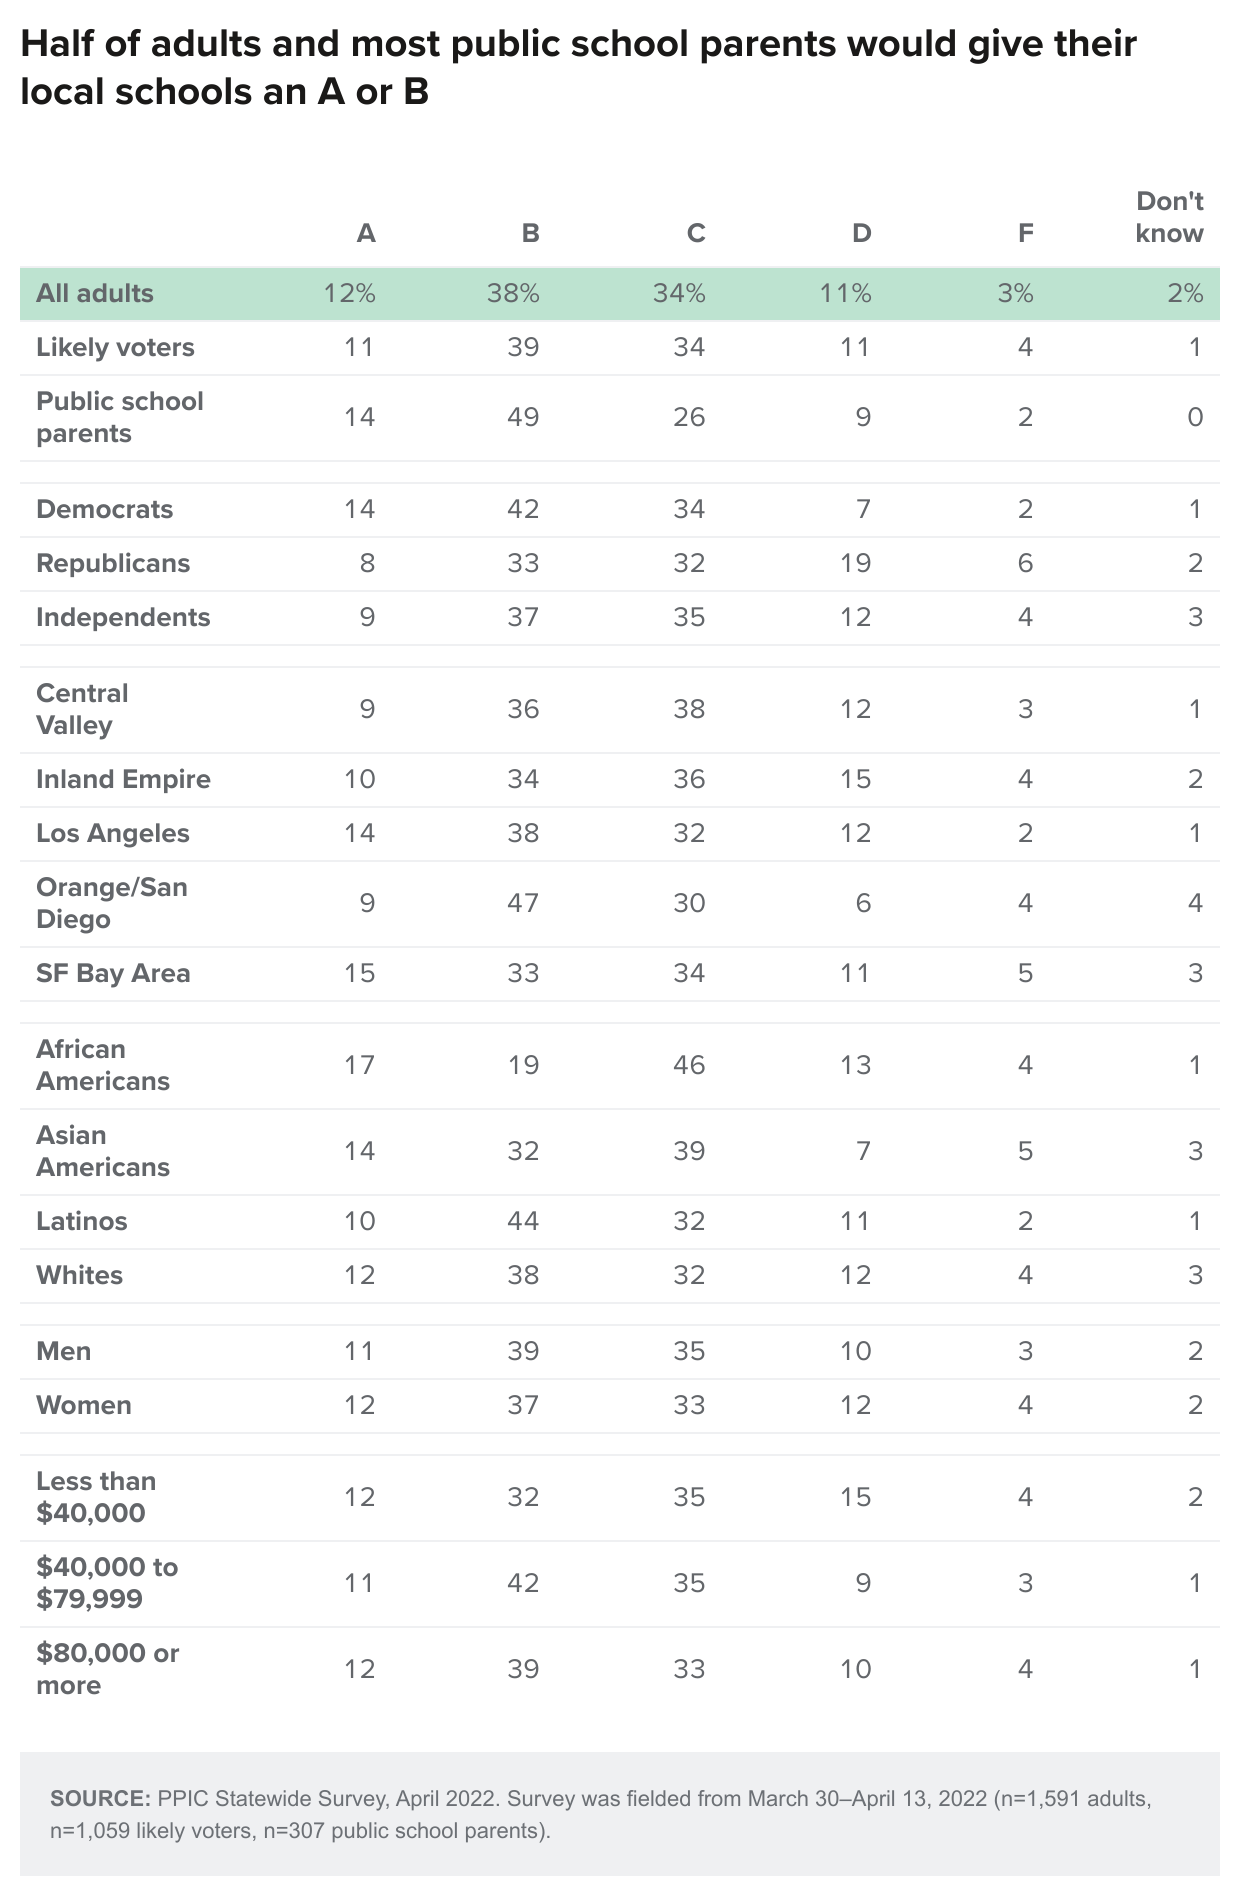
Asked to rate the quality of public schools in their neighborhood with a letter grade, half of adults and about six in ten public school parents would give an A or B (adults: 12% A, 38% B; public school parents: 14% A, 49% B). Shares among all adults were somewhat similar a year ago (adults: 9% A, 32% B), but public school parents were less likely to give an A in April 2021 (6% A, 44% B). Across racial/ethnic groups today, half or more Latinos (54%) and whites (50%) would give an A or B, compared to fewer Asian Americans (46%) and far fewer African Americans (36%). This share varies across age, education, and income groups. Positive views of local schools are higher in Los Angeles and Orange/San Diego than elsewhere.
School Teachers
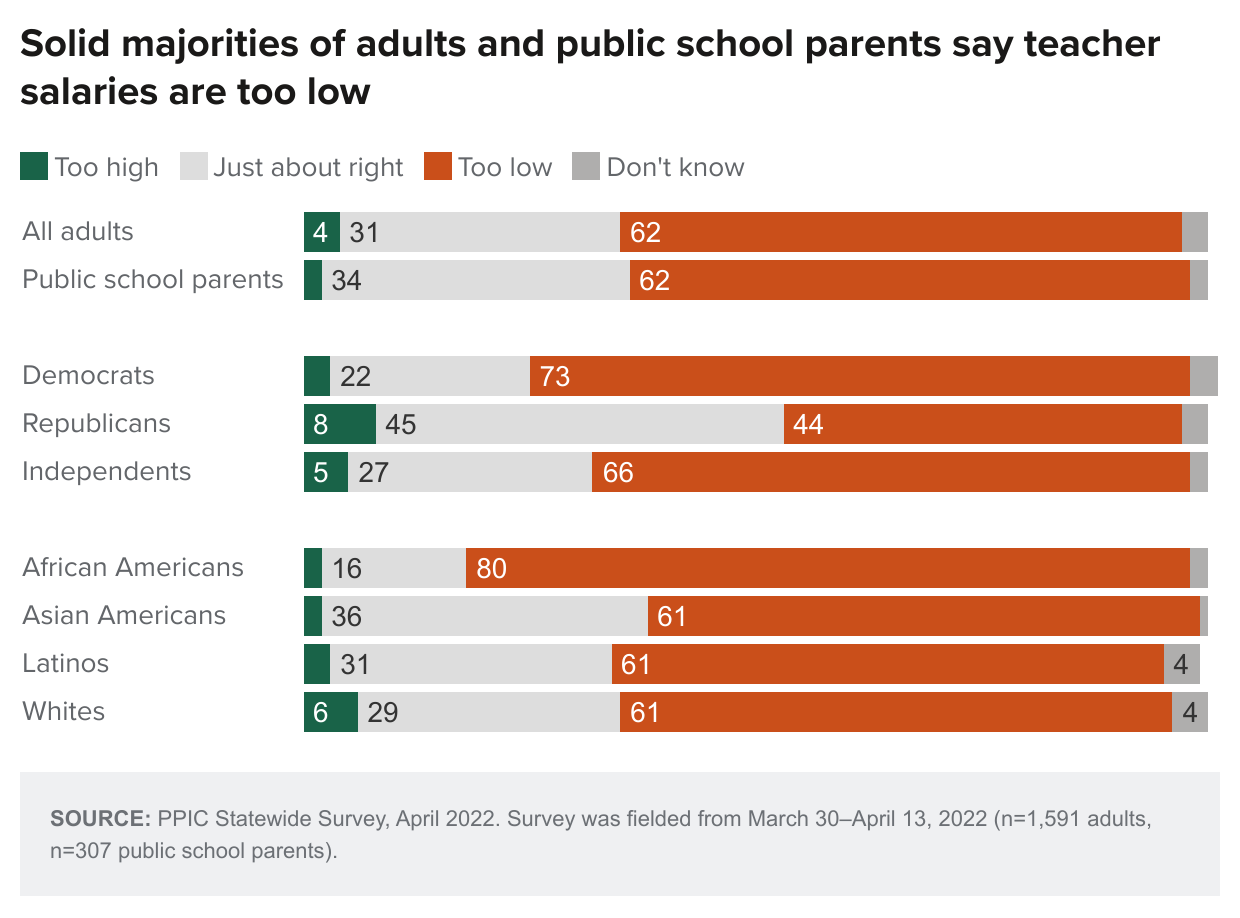
About six in ten adults (62%) and public school parents (62%) say teacher salaries in their communities are too low. The share saying pay is too low has remained similar since 2019. Today, nearly three in four Democrats (73%) and two in three independents (66%) say teacher salaries are too low, compared to fewer Republicans (44%). African Americans are much more likely than other racial/ethnic groups to say this. Majorities across regions say teacher pay is too low, ranging from 56 percent in the Inland Empire to 69 percent in the San Francisco Bay Area.
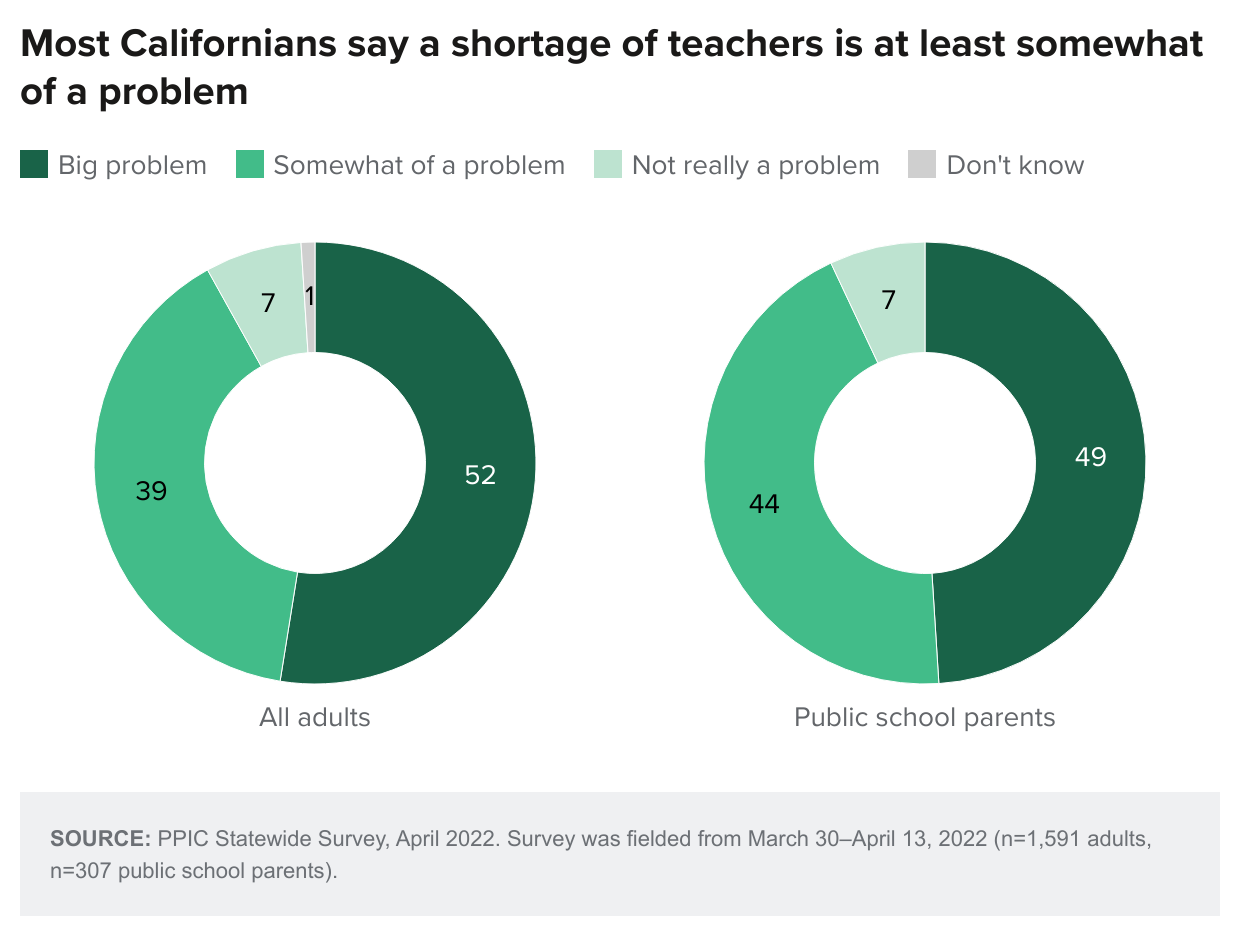
When asked how big of a problem a shortage of teachers is, nearly all adults and public school parents say it is at least somewhat of a problem (adults: 52% big, 39% somewhat; public school parents: 49% big, 44% somewhat). The share saying it is a big problem has been on an upward trend since 2020. Half or more across racial/ethnic and income groups say it is a big problem. The share saying it is a big problem increases with educational attainment and declines with increasing age. Majorities across regions say shortages are a big problem, with the exception of 44% in Orange/San Diego. By comparison, far fewer say that teacher quality is a big problem (28% adults, 27% public school parents), with majorities saying it is somewhat of a problem (54% adults, 54% public school parents).
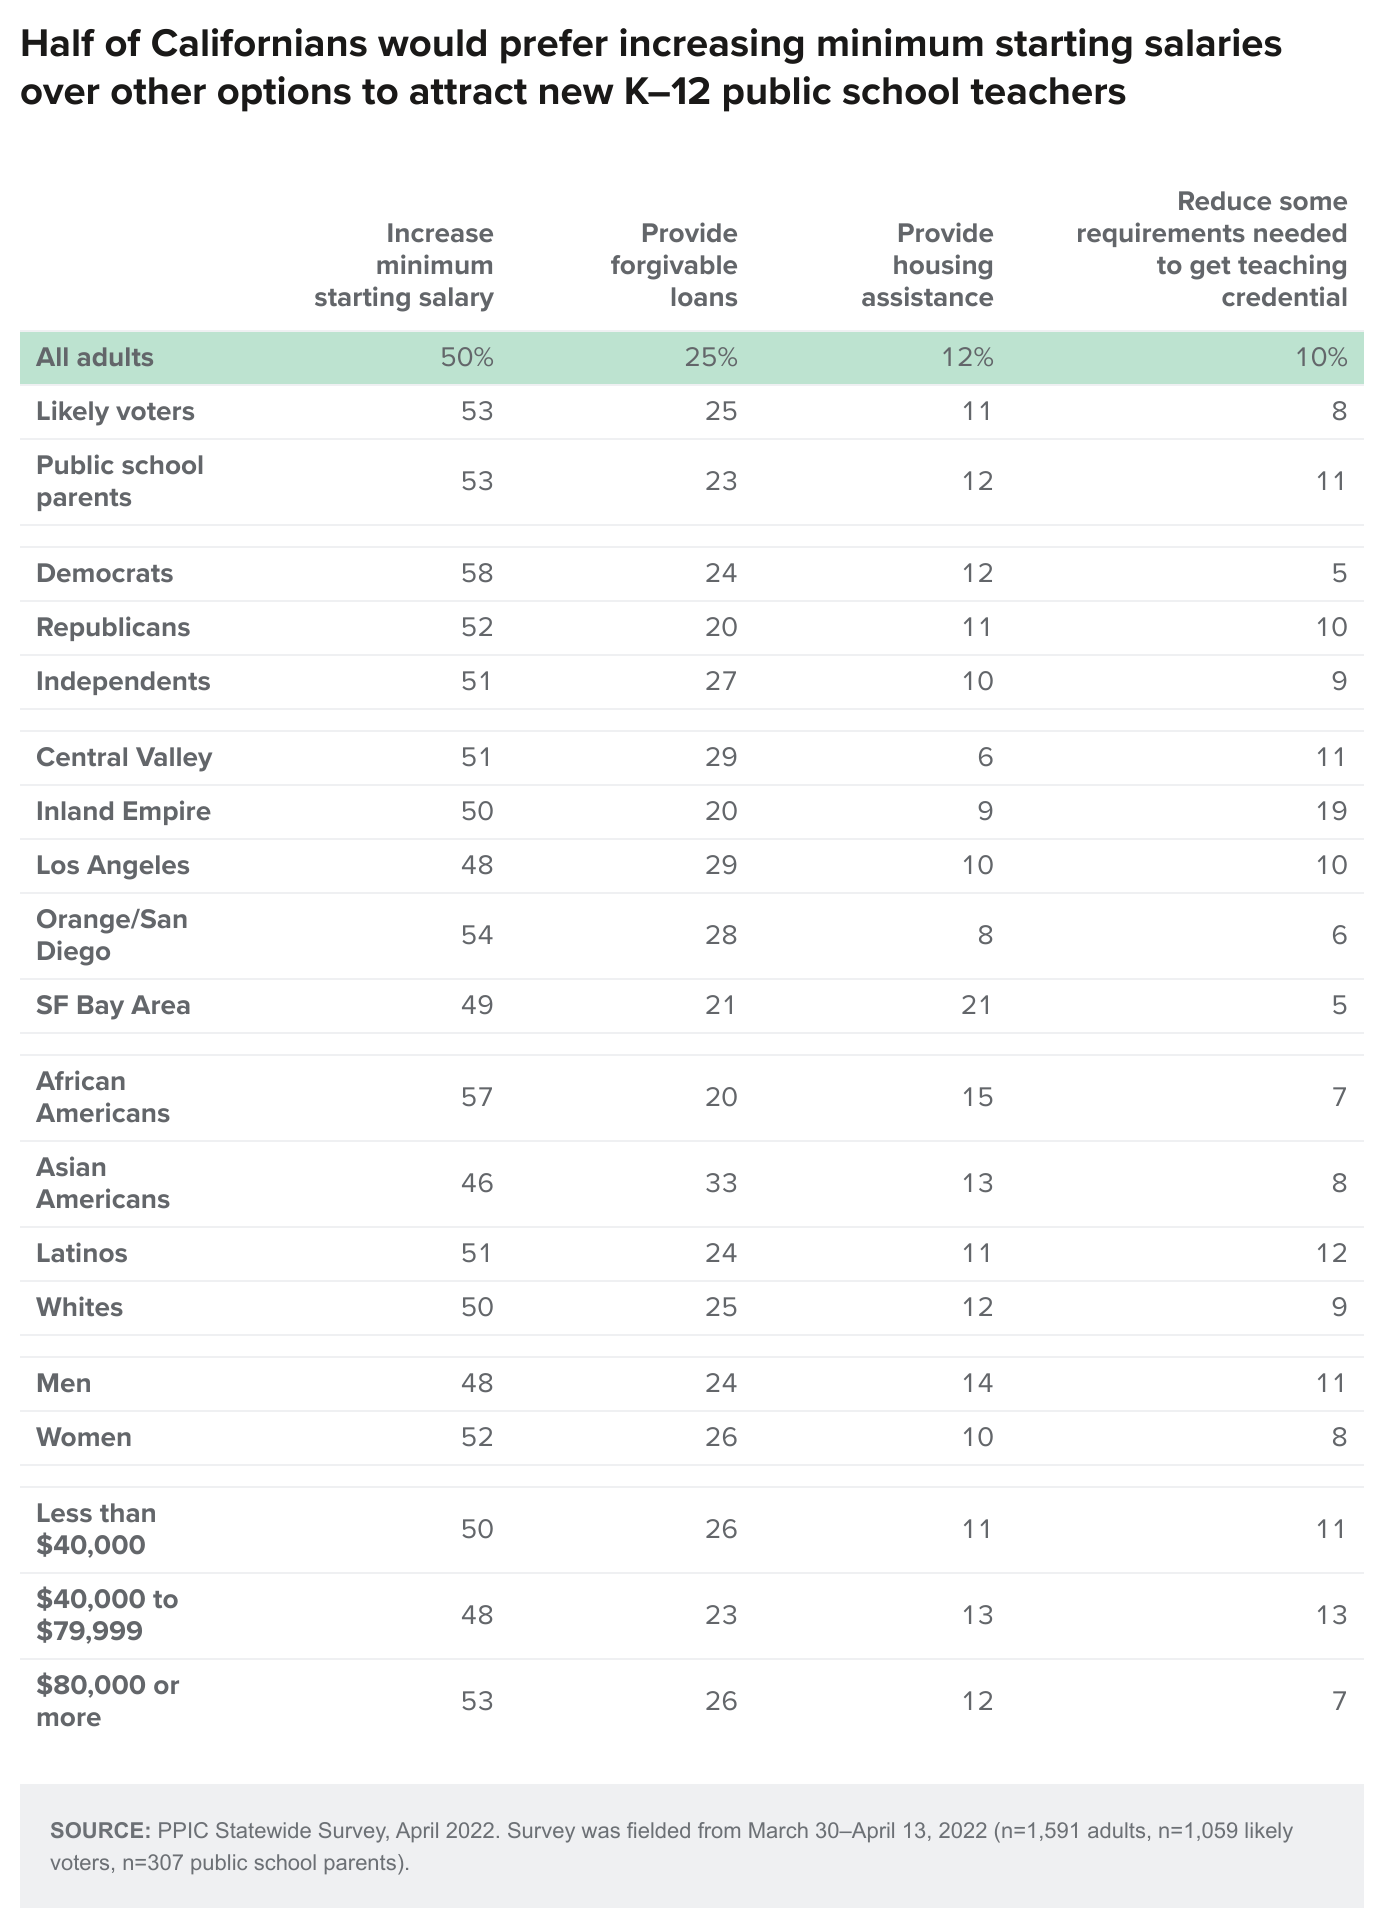
When asked about how state and local governments should attract new K–12 public school teachers, half of Californians would prefer increasing the minimum starting salary, a quarter would prefer providing forgivable loans for teacher education, and fewer would prefer providing housing assistance (12%) or reducing the requirements needed to get teaching credentials (10%). Among racial/ethnic groups, African Americans are the most likely—and Asian Americans are the least likely—to favor increasing starting salaries. About half or more across age, gender, education, and income groups and across the state’s regions say this.
About two in three adults and public school parents say local schools in lower-income areas should pay higher salaries to attract and retain teachers (66% adults, 64% public school parents), and three in four say schools should provide additional training and professional development (75% adults, 77% public school parents) even if it costs the state more money. Solid majorities across demographic groups and regions express support for both of these actions.
Funding for Public Schools
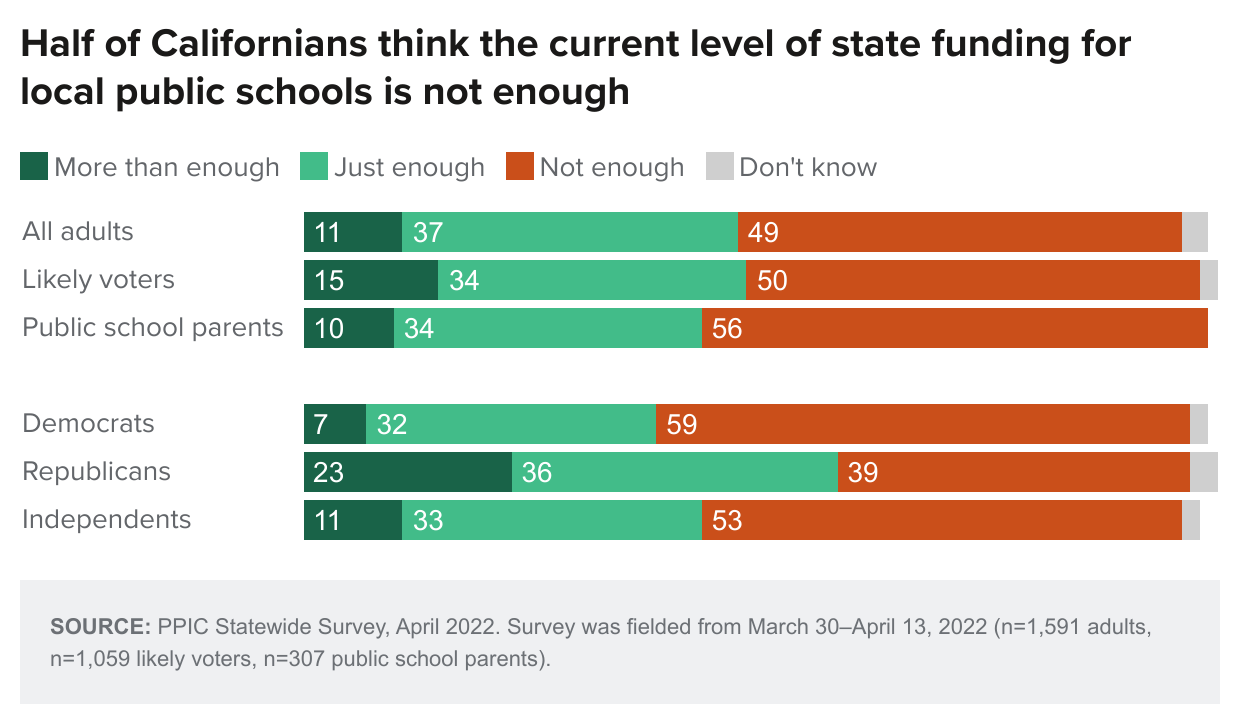
As state policymakers work on the budget for fiscal year 2023 and make decisions regarding the state budget surplus, about half of Californians and nearly six in ten public school parents say state funding for local public schools is not enough. Nearly four in ten Californians and one in three of both parents with school-age children and public school parents say there is just enough funding. Findings have been similar throughout the pandemic. Partisans are divided, with six in ten Democrats and about half of independents saying not enough, compared to about four in ten Republicans. More than four in ten across regions say there is not enough funding; women (54%) are more likely than men (44%) to hold this view. Six in ten African Americans (60%) say state funding for local public schools is not enough, compared to fewer Latinos (52%), whites (49%), and Asian Americans (40%).
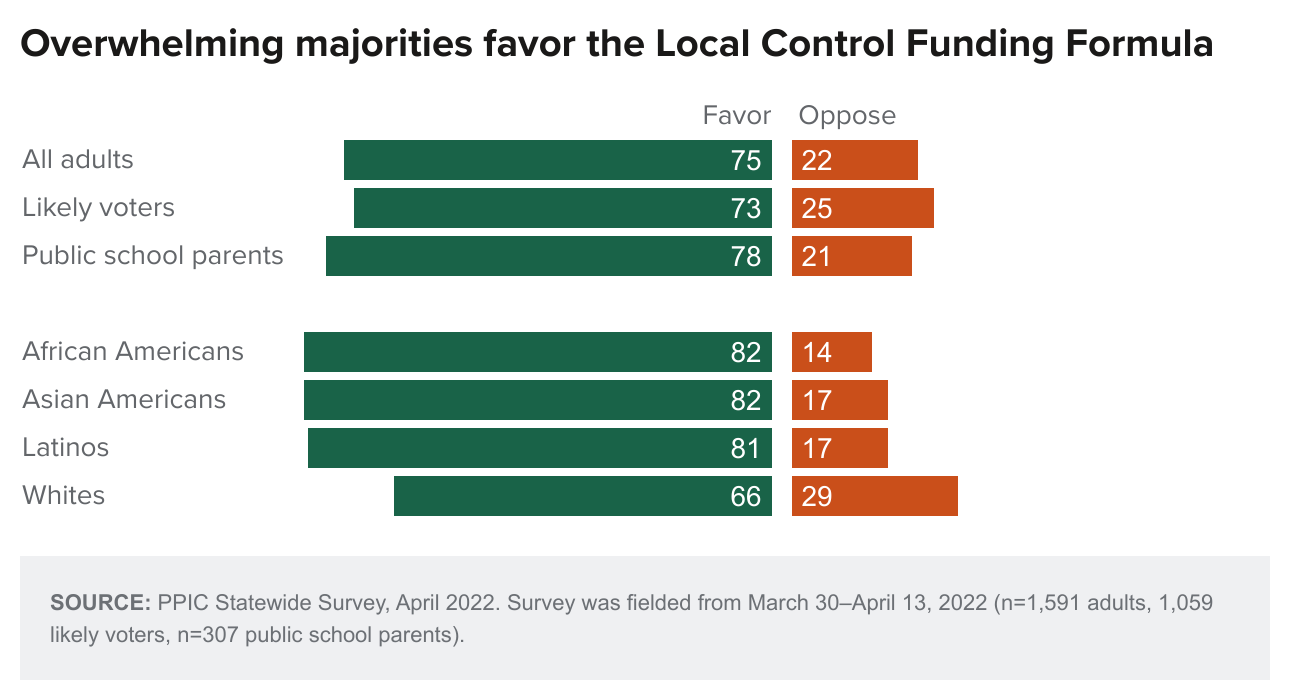
The Local Control Funding Formula (LCFF) allows local school districts increased spending flexibility and provides additional funding to districts with more English language learners and lower-income students. However, nine years after it was enacted, relatively few Californians say they have heard a lot (4%) or a little (19%) about the policy. Despite limited knowledge of the LCFF, overwhelming shares of Californians and public school parents support the policy after reading a brief description. Since we first asked about this policy in 2014, at least 65 percent have favored the policy. Today, strong majorities across regions and demographic groups favor the LCFF. While there is majority support across parties, Democrats (88%) and independents (73%) are far more likely than Republicans (51%) to support the policy.
When asked about their views on funding sources for schools, Californians express higher support for construction bonds than local parcel taxes. A hypothetical state bond measure to pay for school construction projects would garner the support of more than six in ten Californians, three in four public school parents, and a majority of likely voters. Support is similar for local bond measures to pay for school construction projects, which require 55 percent support to pass. About half or more across regions and demographic groups support both of these hypothetical bond measures. However, there are partisan differences: about three in four Democrats and majorities of independents express support, compared to fewer than four in ten Republicans. Among adults and likely voters, support for increasing local parcel taxes falls short of the two-thirds majority needed to pass.

Early Childhood Education
As Governor Newsom seeks to build upon the Master Plan for Early Learning and Care and expand the state’s Transitional Kindergarten program to include more children, most Californians and public school parents think attending preschool is at least somewhat important for success in kindergarten through grade 12. Views on attending preschool have been similar in recent years among Californians and public school parents. Today, solid majorities across parties say attending preschool is important, although Democrats (57%) are much more likely than independents (41%) and Republicans (34%) to say it is very important. Overwhelming majorities across regions and demographic groups think preschool is at least somewhat important. It is noteworthy that the share saying it is very important is much higher among African Americans and Latinos than among Asian American and whites.

Kindergarten readiness—especially among certain student groups—has been a concern among policymakers in recent years. When asked about the readiness of lower-income students, Californians (25% very, 48% somewhat) and public school parents (26% very, 49% somewhat) are concerned. Majorities across parties and two in three or more across regions and demographic groups are concerned about the readiness of lower-income students for kindergarten. When asked about the readiness of students who speak English as a second language, strong majorities of Californians (20% very, 48% somewhat) and public school parents (24% very, 48% somewhat) are concerned. Majorities across parties and six in ten or more across regions and demographic groups are concerned about the readiness of English language learners. On both questions, findings today are similar to those in recent years.

About eight in ten Californians say that the affordability of preschool education is at least somewhat of problem in California today (37% big, 42% somewhat). By comparison, about two in three perceive the quality of preschool education as a problem (15% big, 49% somewhat).
Given the share of Californians who view attending preschool as important and concerns about readiness and affordability, do Californians think that the state government should fund voluntary preschool programs—such as Transitional Kindergarten—for all four-year olds in California? An overwhelming majority of Californians (72%) and public school parents (76%) support this policy. Last April, 68 percent of Californians and 82 percent of public school parents supported this policy. Today, at least six in ten adults across regions and demographic groups express support. There is a partisan divide in support for this policy (84% Democrats, 70% independents, 48% Republicans).

Topics
Access Affordability Equity Higher Education K–12 Education Political Landscape Population Statewide SurveyLearn More
A Broad Range of Californians Oppose Overturning Roe v. Wade

Concerned about Costs, Most Californians Support Universal Preschool

Likely Voters Are Uneasy as California Shifts from Pandemic to Endemic
Most Parents Hope Their Kids Will Go to College, but Costs Are a Concern
Reengaging Citizens in the Initiative Process
Video: Californians and Education
