Key Findings
Californians have had an eventful summer. Since the state’s COVID restrictions were lifted on June 15, Californians have experienced an improving job market, the return of drought and serious wildfires, and a COVID surge as schools and colleges are reopening for the fall semester. Through all of this, Californians have mixed reviews about the state of the state. In the days after receiving mail ballots for the recall election, support from likely voters to remove Governor Newsom still falls short of a majority.
These are among the key findings of a statewide survey on state and national issues that was conducted from August 20 to August 29 by the Public Policy Institute of California.
Among California likely voters, 39 percent would vote yes to remove Newsom, with Republicans far more likely to vote yes. About half of likely voters (49%) say they either have not decided or would not vote for any of the replacement candidates on the recall ballot. →- Seven in ten California likely voters say that the outcome of the recall election is very important to them, including solid majorities across partisan groups. When thinking about the September 14 recall election, 47 percent say they are more enthusiastic about voting than usual. →
Californians name COVID as the top issue facing the state today. Forty-seven percent say things in California are generally going in the right direction, with partisans deeply divided; 49 percent say that California is in an economic recession, and this view declines with rising income. →- Fifty-three percent of Californians approve of the way that Governor Newsom is handling his job overall, and 50 percent approve of the California Legislature. Fifty-eight percent approve of the way that President Biden is handling his job, and 41 percent approve of the US Congress. →
- Forty-six percent of Californians say things in the United States are going in the right direction. Forty-four percent think the US will have good times financially in the next 12 months. →
- Sixty-one percent of Californians favor requiring proof of COVID vaccination for large outdoor gatherings or certain indoor spaces. More than three in four Californians—including strong majorities across regions—think the state government is doing an excellent or good job distributing COVID vaccines. →
Recall Ballot Items
If the recall election—scheduled for September 14, 2021—were held today, 39 percent of California likely voters say they would vote yes to remove Governor Newsom from office, while 58 percent say they would vote no on removing Newsom. There is partisan disagreement, with most Democratic likely voters (90%) and about half of independent likely voters (49%) saying they would vote no on removing Newsom, while most Republican likely voters (82%) say they would vote yes to remove him.
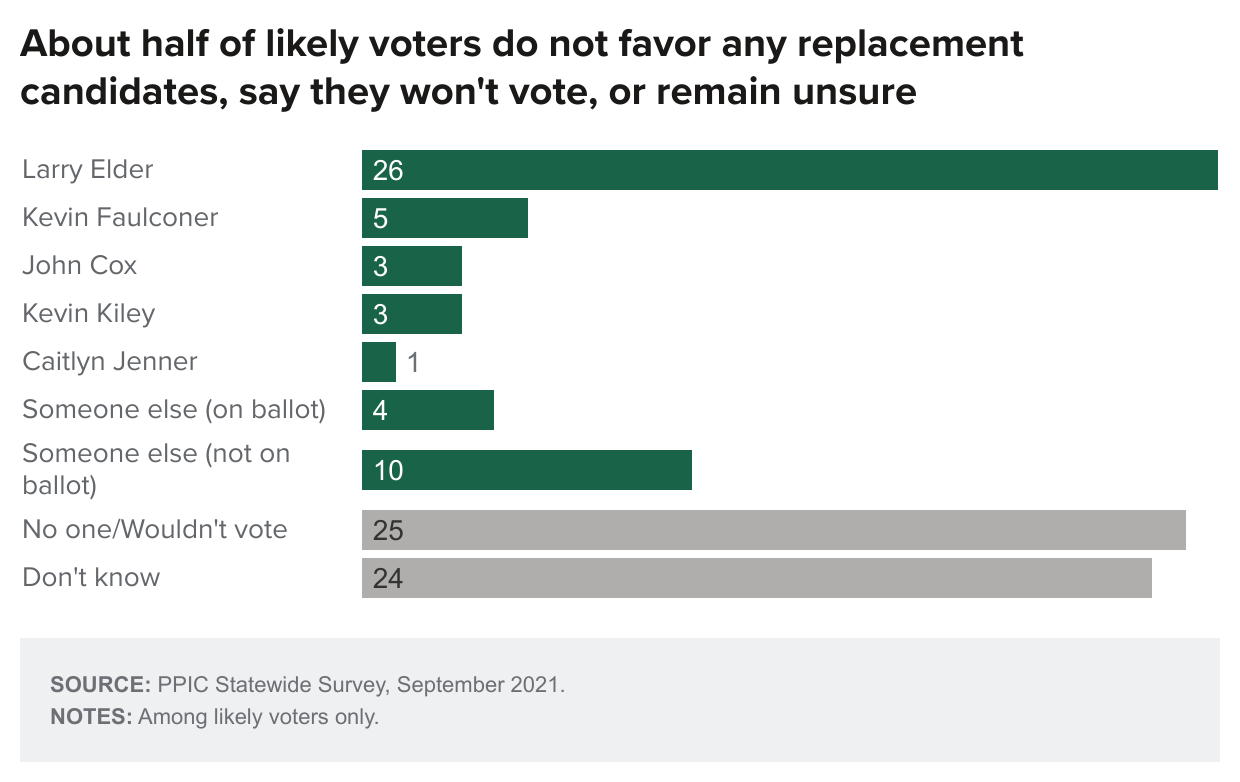
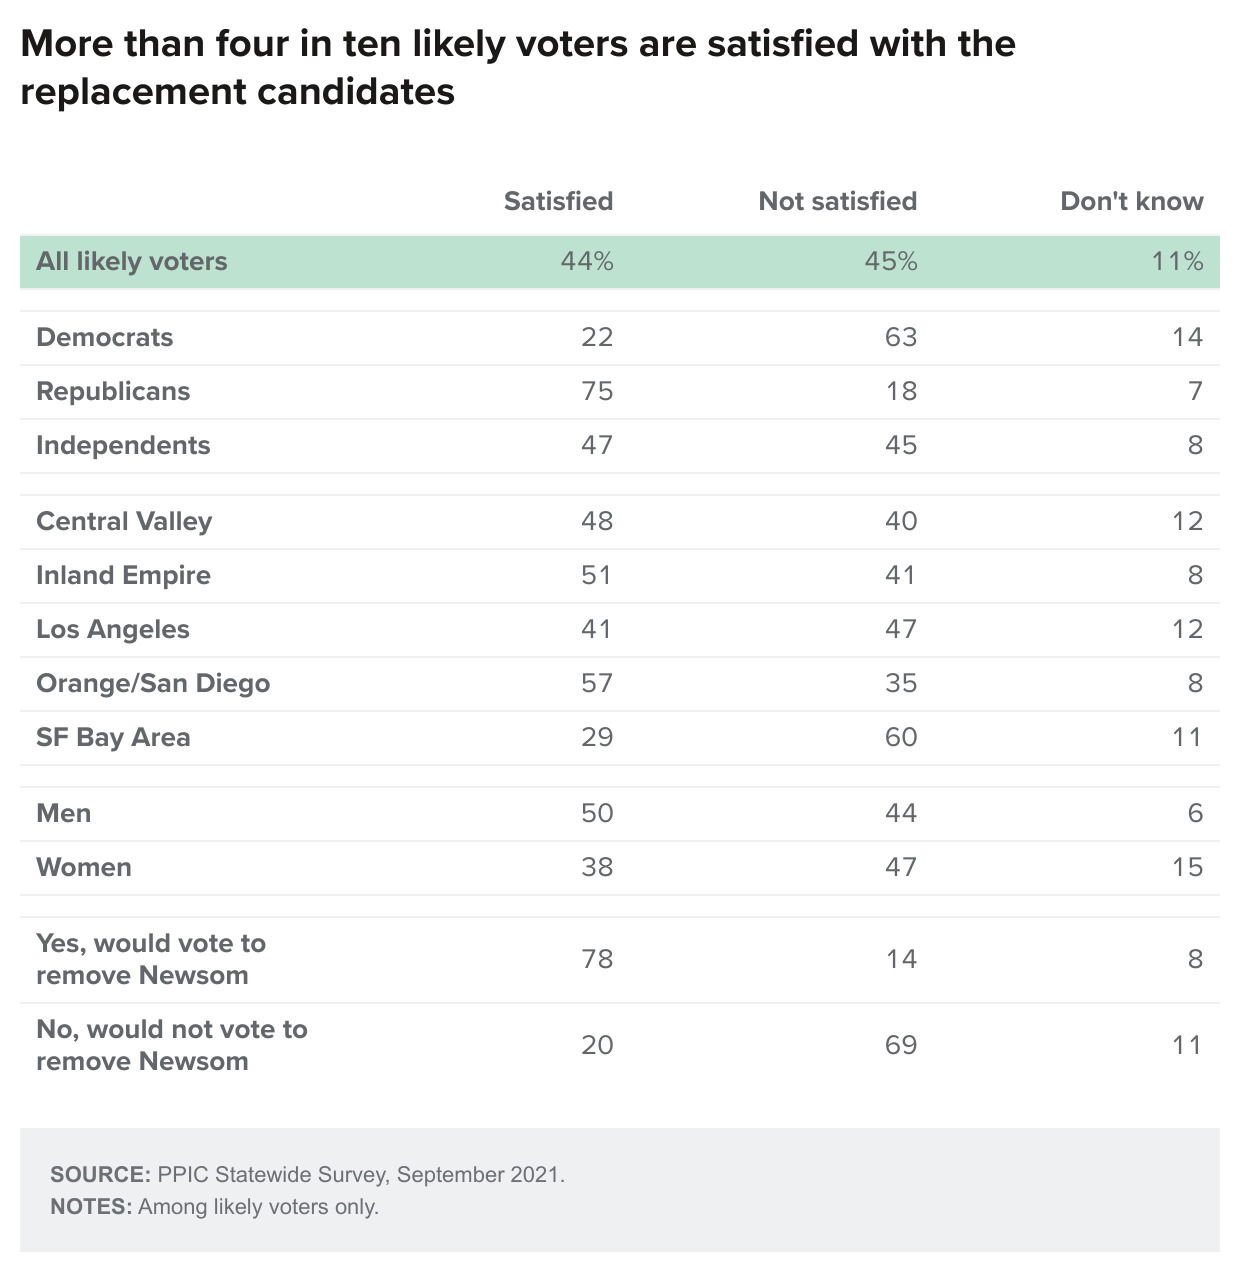
About half of likely voters express a preference for a replacement candidate. Republican Larry Elder (26%) is in the lead, while fewer than one in ten say they prefer either Kevin Faulconer (5%), John Cox (3%), Kevin Kiley (3%), or Caitlyn Jenner (1%). Fourteen percent name other candidates. (Only candidates with both significant media attention and sufficient resources for statewide campaigning were included in our survey question; five candidates met this criteria.) One in four voters say they favor no one or wouldn’t vote (25%), and a similar share say they are still unsure (24%). Two in three Democrats say they favor no one or wouldn’t vote (37%) or remain unsure (30%). Republicans prefer Elder (57%), and independents somewhat favor Elder (23%), though a similar share say they prefer no one or wouldn’t vote (21%). Two in three who say they would vote no on removing Newsom say they prefer no one or wouldn’t vote (40%) or remain unsure (26%) regarding a replacement. Forty-four percent are satisfied with the replacement candidate choices, with Democrats and Republicans deeply divided.
Recall Election Context
Seventy percent of likely voters say the outcome of the vote on the recall election is very important to them; an additional 21 percent say it is somewhat important. Solid majorities of Democrats (75%), Republicans (67%), and independents (62%) say the outcome is very important. Solid majorities of Californians across racial/ethnic groups (66% Latinos, 73% whites, 63% other racial/ethnic groups), other demographic groups, and regions agree that the outcome of the recall election is very important.
In what is sure to be a consequential recall election, 47 percent of likely voters are more enthusiastic than usual about voting. Republicans (54%) and independents (53%) are more likely than Democrats (40%) to say they are more enthusiastic than usual. Amid the ongoing COVID-19 pandemic, California has decided to employ an extensive vote-by-mail system for the recall. With voters set to receive a mail ballot, how much confidence do California’s likely voters have in their voting system? Fifty-six percent have a great deal (37%) or quite a lot of confidence (19%). Democrats (58%) are far more likely than Republicans (13%) or independents (30%) to have a great deal of confidence. More likely voters had confidence in California elections last September (56% today, 60% last September).
State of the State
When asked to name the most important issue facing people in California today, Californians most often name COVID-19. Additionally, about one in ten Californians name jobs and the economy or homelessness, while fewer mention housing costs and availability or problems with elected officials. Across partisan groups, Republicans are most likely to mention problems with elected officials and the economy, while Democrats are most likely to mention COVID-19. Nearly half of Californians think that the state is headed in the right direction, with Democrats far more likely than independents and Republicans to say this. Just over half of those in the San Francisco Bay Area say things are going in the right direction, compared to fewer than half elsewhere. Six in ten Asian Americans think things in California are generally going in the right direction, compared to about half of Latinos and four in ten African Americans and whites. The mood today is decidedly better than when Governor Davis was facing a recall in 2003 (24% right direction in September 2003).
About half of Californians believe that California is in an economic recession, with more saying it is a serious or moderate recession rather than a mild recession. The share saying the state is in a recession decreases with rising household income. Republicans are far more likely than Democrats and much more likely than independents to hold this view. In May, 53 percent said the state was in a recession.
Approval Ratings
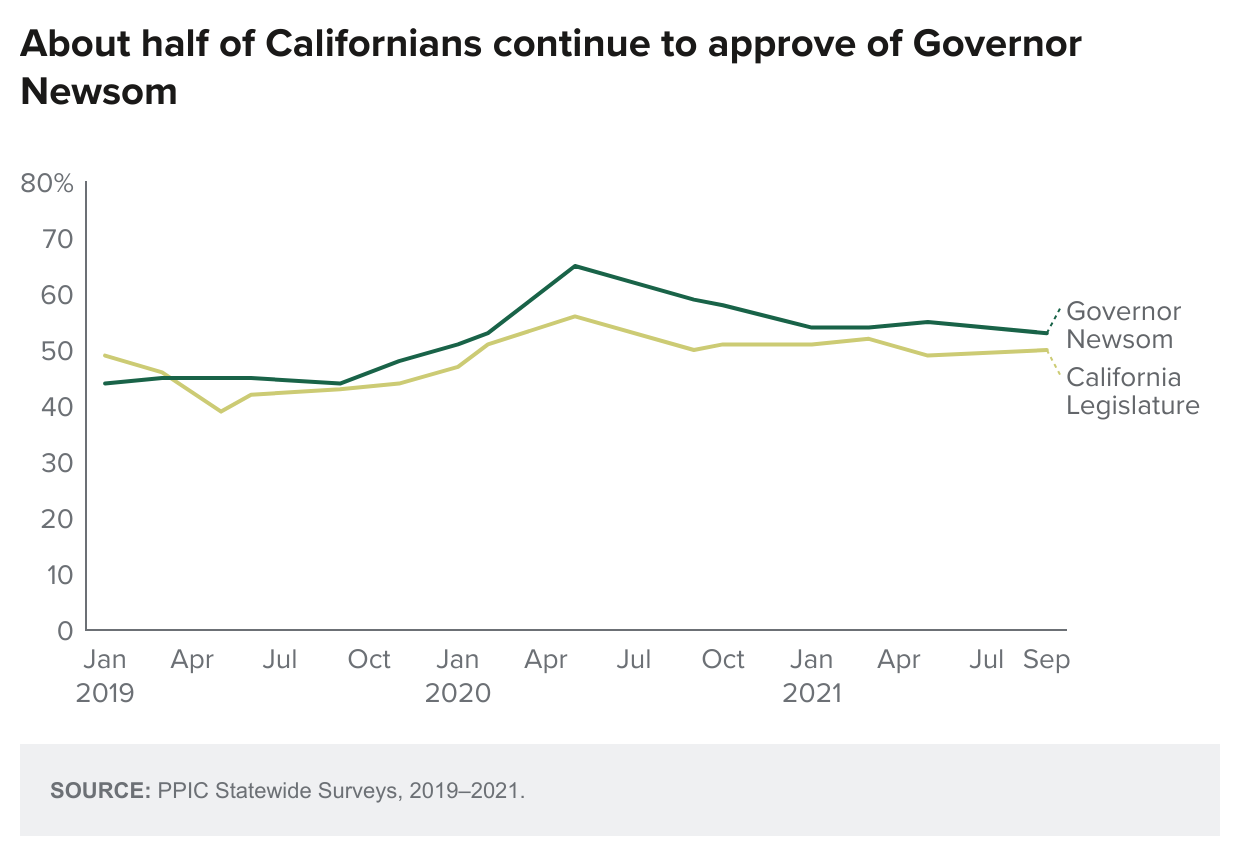
Fifty-three percent of adults and likely voters approve of Gavin Newsom’s job performance as governor, similar to levels throughout 2021 so far. Three in four Democrats approve of Governor Newsom, while more than eight in ten Republicans disapprove. Women are much more likely than men to approve, and residents in Los Angeles and the San Francisco Bay Area are much more likely than those elsewhere to approve of his performance. Half of Californians approve of the state legislature.
President Biden has the approval of about six in ten Californians, including at least half across regions. Far more Democrats than independents and Republicans approve of President Biden. While about half or more across demographic groups approve of President Biden, women are much more likely than men to approve, and people of color are much more likely than whites to approve. In contrast, fewer than half of Californians across parties and regions approving of Congress’s job performance. Six in ten Latinos approve of Congress, compared to fewer than half among other racial/ethnic groups.
About six in ten or more Californians and likely voters approve of the way that Governor Newsom and President Biden are handling the COVID-19 crisis, which is most often named as the state’s top issue.
State of the Nation
Fifty percent of adults and 56 percent of likely voters think things in the US are going in the wrong direction (right direction: 46% adults, 39% likely voters). In May, fewer adults (43%) and likely voters (52%) held this negative perception. Today, solid majorities of Republicans and independents hold this view, while most Democrats think the country is going in the right direction. Majorities of residents in the Inland Empire, the Central Valley, and Orange/San Diego think the country is going in the wrong direction, compared to 48 percent in Los Angeles and 42 percent in the San Francisco Bay Area. A majority of whites and African Americans believe the US is going in the wrong direction, while most Latinos and Asian Americans think it is going in the right direction.
Californians are divided (44% good times, 47% bad times) on whether the US will experience good financial times in the next 12 months. In May, the economic outlook for the nation was more upbeat (55% good times, 39% bad times). Today, Democrats are far more likely to think there will be good times than are Republicans and independents. Regionally, half in Los Angeles say there will be good times, while most in the Inland Empire and Central Valley think there will be bad times; San Francisco Bay Area and Orange/San Diego residents are split on the question. Across racial/ethnic groups, majorities of Latinos expect good financial times, most whites and African Americans say there will be bad times, and Asian Americans are divided. Fewer than half across age, education, gender, and homeownership groups believe the US will have good economic times ahead.
COVID-19 Pandemic
More than three in four California adults report already having gotten the COVID-19 vaccine, and another 7 percent say they definitely or probably will get it. Solid majorities across regions as well as partisan and demographic groups have already gotten the vaccine, but uptake is lower among Republicans, Inland Empire residents, and African Americans.
About eight in ten adults believe the state government has done an excellent or good job of distributing COVID-19 vaccines to people in California. Most across partisan groups think the state has done at least a good job, but Democrats and independents are much more likely than Republicans to hold this view. Majorities across regions and all demographic groups say the state has done an excellent or good job distributing COVID-19 vaccines. Sixty-one percent of adults and 62 percent of likely voters favor requiring proof of the COVID-19 vaccination to be able to enter large outdoor gatherings or certain indoor spaces. Eight in ten Democrats and half of independents are in favor, compared to three in ten Republicans. Majorities across regions, with the exception of the Inland Empire (45%), are in favor. Majorities across age, education, gender, income, and racial/ethnic groups favor proof of vaccination.
Regional Map
This map highlights the five geographic regions for which we present results; these regions account for approximately 90 percent of the state population. Residents of other geographic areas (in gray) are included in the results reported for all adults, registered voters, and likely voters, but sample sizes for these less-populous areas are not large enough to report separately.
Methodology
The PPIC Statewide Survey is directed by Mark Baldassare, president and CEO and survey director at the Public Policy Institute of California. Coauthors of this report include survey analyst Deja Thomas, who was the project manager for this survey; associate survey director and research fellow Dean Bonner; and survey analyst Rachel Lawler. The Californians and Their Government survey is supported with funding from the Arjay and Frances F. Miller Foundation, the James Irvine Foundation, and the PPIC Donor Circle. The PPIC Statewide Survey invites input, comments, and suggestions from policy and public opinion experts and from its own advisory committee, but survey methods, questions, and content are determined solely by PPIC’s survey team.
Findings in this report are based on a survey of 1,706 California adult residents, including 1,254 interviewed on cell phones and 452 interviewed on landline telephones. The sample included 510 respondents reached by calling back respondents who had previously completed an interview in PPIC Statewide Surveys in the last six months. Interviews took an average of 18 minutes to complete. Interviewing took place on weekend days and weekday nights from August 20–29, 2021.
Cell phone interviews were conducted using a computer-generated random sample of cell phone numbers. All cell phone numbers with California area codes were eligible for selection. After a cell phone user was reached, the interviewer verified that this person was age 18 or older, a resident of California, and in a safe place to continue the survey (e.g., not driving). Cell phone respondents were offered a small reimbursement to help defray the cost of the call. Cell phone interviews were conducted with adults who have cell phone service only and with those who have both cell phone and landline service in the household.
Landline interviews were conducted using a computer-generated random sample of telephone numbers that ensured that both listed and unlisted numbers were called. All landline telephone exchanges in California were eligible for selection. After a household was reached, an adult respondent (age 18 or older) was randomly chosen for interviewing using the “last birthday method” to avoid biases in age and gender.
For both cell phones and landlines, telephone numbers were called as many as eight times. When no contact with an individual was made, calls to a number were limited to six. Also, to increase our ability to interview Asian American adults, we made up to three additional calls to phone numbers estimated by Survey Sampling International as likely to be associated with Asian American individuals.
Live landline and cell phone interviews were conducted by Abt Associates in English and Spanish, according to respondents’ preferences. Accent on Languages, Inc., translated new survey questions into Spanish, with assistance from Renatta DeFever.
Abt Associates uses the US Census Bureau’s 2015–2019 American Community Survey’s (ACS) Public Use Microdata Series for California (with regional coding information from the University of Minnesota’s Integrated Public Use Microdata Series for California) to compare certain demographic characteristics of the survey sample—region, age, gender, race/ethnicity, and education—with the characteristics of California’s adult population. The survey sample was closely comparable to the ACS figures. To estimate landline and cell phone service in California, Abt Associates used 2019 state-level estimates released by the National Center for Health Statistics—which used data from the National Health Interview Survey (NHIS) and the ACS. The estimates for California were then compared against landline and cell phone service reported in this survey. We also used voter registration data from the California Secretary of State to compare the party registration of registered voters in our sample to party registration statewide. The landline and cell phone samples were then integrated using a frame integration weight, while sample balancing adjusted for differences across regional, age, gender, race/ethnicity, education, telephone service, and party registration groups.
The sampling error, taking design effects from weighting into consideration, is ±3.4 percent at the 95-percent confidence level for the total unweighted sample of 1,706 adults. This means that 95 times out of 100, the results will be within 3.4 percentage points of what they would be if all adults in California were interviewed. The sampling error for unweighted subgroups is larger: for the 1,468 registered voters the sampling error is ±3.8 percent; for the 1,080 likely voters it is ±4.5. For the sampling errors of additional subgroups, please see the table at the end of this section. Sampling error is only one type of error to which surveys are subject. Results may also be affected by factors such as question wording, question order, and survey timing.
We present results for five geographic regions, accounting for approximately 90 percent of the state population. “Central Valley” includes Butte, Colusa, El Dorado, Fresno, Glenn, Kern, Kings, Madera, Merced, Placer, Sacramento, San Joaquin, Shasta, Stanislaus, Sutter, Tehama, Tulare, Yolo, and Yuba Counties. “San Francisco Bay Area” includes Alameda, Contra Costa, Marin, Napa, San Francisco, San Mateo, Santa Clara, Solano, and Sonoma Counties. “Los Angeles” refers to Los Angeles County, “Inland Empire” refers to Riverside and San Bernardino Counties, and “Orange/San Diego” refers to Orange and San Diego Counties. Residents of other geographic areas are included in the results reported for all adults, registered voters, and likely voters, but sample sizes for these less populous areas are not large enough to report separately.
We present results for non-Hispanic whites, who account for 41 percent of the state’s adult population, and also for Latinos, who account for about a third of the state’s adult population and constitute one of the fastest-growing voter groups. We also present results for non-Hispanic Asian Americans, who make up about 16 percent of the state’s adult population, and non-Hispanic African Americans, who comprise about 6 percent. Results for other racial/ethnic groups—such as Native Americans—are included in the results reported for all adults, registered voters, and likely voters, but sample sizes are not large enough for separate analysis. Results for African American and Asian American likely voters are combined with those of other racial/ethnic groups because sample sizes for African American and Asian American likely voters are too small for separate analysis. We compare the opinions of those who report they are registered Democrats, registered Republicans, and decline-to-state or independent voters; the results for those who say they are registered to vote in other parties are not large enough for separate analysis. We also analyze the responses of likely voters—so designated per their responses to survey questions about voter registration, previous election participation, intentions to vote this year, attention to election news, and current interest in politics. For question 6 (replacement candidates), only candidates with both significant media attention and sufficient resources for statewide campaigning were included; five of the candidates met this criteria. Respondents could also name someone else and specify a candidate if their preferred choice was not mentioned.
The percentages presented in the report tables and in the questionnaire may not add to 100 due to rounding.
Numerous questions were adapted from national surveys by Gallup, ABC News/Washington Post, and the Pew Research Center. Additional details about our methodology can be found at www.ppic.org/wp-content/uploads/SurveyMethodology.pdf and are available upon request through surveys@ppic.org.

Questions and Responses
August 20–29, 2021
1,706 California adult residents; 1,080 California likely voters:
English, Spanish
Margin of error ±3.4% at 95% confidence level for total sample and ±4.5% for likely voters
Percentages may not add to 100 due to rounding
1. First, thinking about the state as a whole, what do you think is the most important issue facing people in California today? [code, don’t read]
21% COVID-19, coronavirus
12% jobs, economy
11% homelessness
7% government in general, problems with elected officials, political parties
7% housing costs, availability
5% state budget, deficit, state spending
5% wildfires, fires
4% environment, pollution, global warming
4% water, water availability, drought
3% health care, health insurance
3% immigration, illegal immigration
2% education, schools, teachers
2% infrastructure
10% other (specify)
4% don’t know
2. Do you think things in California are generally going in the right direction or the wrong direction?
47% right direction
43% wrong direction
10% don’t know
3. Would you say that California is in an economic recession, or not? (If yes, ask: “Do you think it is in a serious, a moderate, or a mild recession?”)
17% yes, serious recession
20% yes, moderate recession
9% yes, mild recession
3% yes, don’t know (volunteered)
45% no, not in an economic recession
6% don’t know
Changing topics,
4. [likely voters only] How closely are you following the news about the effort to recall Governor Newsom from office—very closely, fairly closely, not too closely, or not at all closely?
40% very closely
41% fairly closely
12% not too closely
7% not at all closely
— don’t know
5. [likely voters only] On September 14, there will be a special election on whether to recall Governor Newsom from office. On this ballot, voters will be asked two questions: first, whether Gavin Newsom should or should not be removed as governor, and second, who from a list of 46 candidates should succeed Gavin Newsom as governor if he is recalled.
If the election were held today, would you vote yes to recall or remove Gavin Newsom as governor, or no?
39% yes, recall or remove Newsom
58% no
3% don’t know
6. [likely voters only] Regardless of how you would vote on the first part of the recall, how would you vote on the second part of the recall ballot? If the election were held today, would you vote for? [rotate names and then ask “or someone else?”]
26% Larry Elder, a Republican, broadcaster/author
5% Kevin Faulconer, a Republican, businessman/educator
3% John Cox, a Republican, businessman/accountant/father
3% Kevin Kiley, a Republican, California legislator
1% Caitlyn Jenner, a Republican, businessperson/entrepreneur
4% someone else (on ballot) (specify)
10% someone else (not on ballot) (specify)
25% no one/wouldn’t vote (volunteered)
24% don’t know
7. [likely voters only] Would you say you are satisfied or not satisfied with the choices of replacement candidates in the recall election on September 14?
44% satisfied
45% not satisfied
11% don’t know
8. [likely voters only] If Governor Newsom is recalled from office, do you think that things in California would get better, would get worse, or would it make no difference?
33% would get better
41% would get worse
20% would make no difference
6% don’t know
9. [likely voters only] Do you think the current effort to recall the governor is an appropriate use of the recall process, or not?
44% yes
53% no
3% don’t know
10. [likely voters only] Thinking about the recall election that will be held this September, are you more enthusiastic about voting than usual, or less enthusiastic?
47% more enthusiastic
30% less enthusiastic
21% same/neither (volunteered)
2% don’t know
11. [likely voters only] And has the recall election made you feel better, worse, or no different about California politics?
24% better
40% worse
35% no different
2% don’t know
12. [likely voters only] How important to you is the outcome of the vote on the recall election—is it very important, somewhat important, not too important, or not at all important?
70% very important
21% somewhat important
6% not too important
3% not at all important
— don’t know
Next,
13. [likely voters only] How much confidence do you have in the system in which votes are cast and counted in California elections—a great deal, quite a lot, some, or very little?
37% great deal
19% quite a lot
18% some
21% very little
3% none (volunteered)
1% don’t know
[rotate questions 14 and 15]
14. [likely voters only] How concerned are you that it is too hard for eligible people to vote in California elections? Are you very concerned, somewhat concerned, not too concerned, or not at all concerned?
15% very concerned
23% somewhat concerned
23% not too concerned
38% not at all concerned
1% don’t know
15. [likely voters only] How concerned are you that it is too easy for people who are not eligible to vote in California elections? Are you very concerned, somewhat concerned, not too concerned, or not at all concerned?
34% very concerned
18% somewhat concerned
15% not too concerned
31% not at all concerned
2% don’t know
On another topic,
16. Overall, do you approve or disapprove of the way that Gavin Newsom is handling his job as governor of California?
53% approve
39% disapprove
8% don’t know
17. Overall, do you approve or disapprove of the way that Governor Newsom is handling the coronavirus outbreak?
60% approve
36% disapprove
4% don’t know
18. Overall, do you approve or disapprove of the way that the California Legislature is handling its job?
50% approve
40% disapprove
10% don’t know
Changing topics,
19. Overall, do you approve or disapprove of the way that Joe Biden is handling his job as president?
58% approve
38% disapprove
4% don’t know
20. Overall, do you approve or disapprove of the way that President Biden is handling the coronavirus outbreak?
66% approve
32% disapprove
2% don’t know
21. Overall, do you approve or disapprove of the way the US Congress is handling its job?
41% approve
52% disapprove
7% don’t know
Next,
22. Do you think things in the United States are generally going in the right direction or the wrong direction?
46% right direction
50% wrong direction
5% don’t know
23. Turning to economic conditions, do you think that during the next 12 months the United States will have good times financially or bad times?
44% good times
47% bad times
9% don’t know
On another topic,
24. How much of a problem is homelessness in your part of California? Is it a big problem, somewhat of a problem, or not much of a problem?
68% big problem
22% somewhat of a problem
9% not much of a problem
1% don’t know
25. How concerned are you about the presence of homeless people in your local community today? Are you very concerned, somewhat concerned, not too concerned, or not at all concerned?
49% very concerned
33% somewhat concerned
11% not too concerned
6% not at all concerned
1% don’t know
26. In the last 12 months, do you think that the presence of homeless people in your local community has increased, decreased, or stayed about the same?
60% increased
5% decreased
33% stayed the same
2% don’t know
Changing topics,
27. Have you personally received the COVID-19 vaccine, or not? [If yes ask: “Did you receive a single-dose vaccine, the first of two doses, or have you received both doses of a two-dose vaccine?”]
8% yes, single-dose vaccine [skip to q28]
6% yes, first of two doses [skip to q28]
64% yes, both doses of two doses [skip to q28]
22% no
— don’t know
27a. The coronavirus vaccine is now available to all individuals 12 and older. Will you definitely get the coronavirus vaccine, probably get it, probably not get it, or definitely not get it?
2% definitely get the vaccine
5% probably get the vaccine
4% probably not get the vaccine
10% definitely not get the vaccine
77% already got the vaccine [if q27=yes, code q27a=“already got the vaccine”]
1% don’t know
28. Overall, do you think the state government is doing an excellent, good, fair, or poor job of distributing COVID-19 vaccines to people in California?
28% excellent
50% good
14% fair
5% poor
3% don’t know
29. Do you favor or oppose requiring proof of the COVID-19 vaccination to be able to enter large outdoor gatherings or certain indoor spaces such as restaurants, bars, and gyms?
61% favor
36% oppose
3% don’t know
On another topic,
[rotate questions 30 and 31]
30. How much of the time do you think you can trust the state government in Sacramento to do what is right—just about always, most of the time, or only some of the time?
12% just about always
35% most of the time
43% only some of the time
8% none of the time (volunteered)
3% don’t know
31. How much of the time do you think you can trust the federal government in Washington today to do what is right—just about always, most of the time, or only some of the time?
10% just about always
28% most of the time
52% only some of the time
8% none of the time (volunteered)
2% don’t know
On another topic,
[rotate questions 32 and 33]
32. Do you have a favorable or an unfavorable impression of the Democratic Party?
51% favorable
42% unfavorable
7% don’t know
33. Do you have a favorable or an unfavorable impression of the Republican Party?
28% favorable
64% unfavorable
9% don’t know
34. Next, some people are registered to vote and others are not. Are you absolutely certain that you are registered to vote in California?
77% yes [ask q34a]
23% no [skip to q35b]
34a. Are you registered as a Democrat, a Republican, another party, or are you registered as a decline-to-state or independent voter?
46% Democrat [ask q35]
24% Republican [skip to q35a]
6% another party (specify) [skip to q36]
24% decline-to-state/independent [skip to 35b]
[likely voters only]
46% Democrat [ask q35]
28% Republican [skip to q35a]
7% another party (specify) [skip to q36]
19% decline-to-state/independent [skip to 35b]
35. Would you call yourself a strong Democrat or not a very strong Democrat?
55% strong
44% not very strong
1% don’t know
[skip to q36]
35a. Would you call yourself a strong Republican or not a very strong Republican?
58% strong
37% not very strong
5% don’t know
[skip to q36]
35b. Do you think of yourself as closer to the Republican Party or Democratic Party?
26% Republican Party
42% Democratic Party
24% neither (volunteered)
8% don’t know
36. Next, would you consider yourself to be politically: [read list, rotate order top to bottom]
13% very liberal
21% somewhat liberal
30% middle-of-the-road
20% somewhat conservative
12% very conservative
3% don’t know
37. Generally speaking, how much interest would you say you have in politics—a great deal, a fair amount, only a little, or none?
28% great deal
36% fair amount
26% only a little
9% none
1% don’t know
[d1-d15 demographic questions]
PPIC Statewide Advisory Committee
Ruben Barrales
Senior Vice President, External Relations
Wells Fargo
Angela Glover Blackwell
Founder in Residence
PolicyLink
Mollyann Brodie
Executive Vice President and
Chief Operating Officer
Henry J. Kaiser Family Foundation
Bruce E. Cain
Director
Bill Lane Center for the American West
Stanford University
Jon Cohen
Chief Research Officer
SurveyMonkey
Joshua J. Dyck
Co-Director
Center for Public Opinion
University of Massachusetts, Lowell
Lisa García Bedolla
Vice Provost for Graduate Studies and
Dean of the Graduate Division
University of California, Berkeley
Russell Hancock
President and CEO
Joint Venture Silicon Valley
Sherry Bebitch Jeffe
Professor
Sol Price School of Public Policy
University of Southern California
Robert Lapsley
President
California Business Roundtable
Carol S. Larson
President Emeritus
The David and Lucile Packard Foundation
Donna Lucas
Chief Executive Officer
Lucas Public Affairs
Sonja Petek
Fiscal and Policy Analyst
California Legislative Analyst’s Office
Lisa Pitney
Vice President of Government Relations
The Walt Disney Company
Robert K. Ross, MD
President and CEO
The California Endowment
Jui Shrestha
Survey Specialist Consultant
World Bank
Most Reverend Jaime Soto
Bishop of Sacramento
Roman Catholic Diocese of Sacramento
Helen Iris Torres
CEO
Hispanas Organized for Political Equality
David C. Wilson, PhD
Dean and Professor
Richard and Rhoda Goldman School
of Public Policy
University of California, Berkeley
PPIC Board of Directors
Steven A. Merksamer, Chair
Of Counsel
Nielsen Merksamer Parrinello
Gross & Leoni LLP
Mark Baldassare
President and CEO
Public Policy Institute of California
Louise Henry Bryson
Chair Emerita, Board of Trustees
J. Paul Getty Trust
A. Marisa Chun
Chet Hewitt
President and CEO
Sierra Health Foundation
Phil Isenberg
Former Chair
Delta Stewardship Council
Mas Masumoto
Author and Farmer
Leon E. Panetta
Chairman
The Panetta Institute for Public Policy
Gerald L. Parsky
Chairman, Aurora Capital Group
Kim Polese
Chairman, ClearStreet, Inc.
Cassandra Walker Pye
Executive Vice President and Chief Strategy Officer
Lucas Public Affairs
Helen Iris Torres
CEO
Hispanas Organized for Political Equality
Gaddi H. Vasquez
Retired Senior Vice President, Government Affairs
Edison International
Southern California Edison
Copyright
© 2021 Public Policy Institute of California
The Public Policy Institute of California is dedicated to informing and improving public policy in California through independent, objective, nonpartisan research.
PPIC is a public charity. It does not take or support positions on any ballot measures or on any local, state, or federal legislation, nor does it endorse, support, or oppose any political parties or candidates for public office.
Short sections of text, not to exceed three paragraphs, may be quoted without written permission provided that full attribution is given to the source.
Research publications reflect the views of the authors and do not necessarily reflect the views of our funders or of the staff, officers, advisory councils, or board of directors of the Public Policy Institute of California.