
- Nearly one in nine Californians is a member of a public pension program.
More than 4.6 million Californians are members of state and local pension plans, according to the State Controller’s Office. Most members (76%) belong to the state systems: the California Public Employees’ Retirement System (CalPERS), the California State Teachers’ Retirement System (CalSTRS), and the University of California pension system. The remaining members belong to more than 100 local, special district, and other pension plans. - California’s largest public pensions have significant unfunded liabilities.
The largest funds at CalPERS and CalSTRS have reported gaps of more than $138.9 billion and $107.3 billion, respectively, between their estimated obligations to retirees and the current value of their assets. Since 2008, these unfunded liabilities have grown by more than $103 billion for CalPERS and $84 billion for CalSTRS. In 2016, 70% of California’s public pension liabilities were covered by assets, ranking 26th in the nation. Among other large states, New York ranked 4th (91%), Florida ranked 13th (79%), and Texas ranked 19th (73%).
Unfunded liabilities at California’s public pension systems are at historic highs
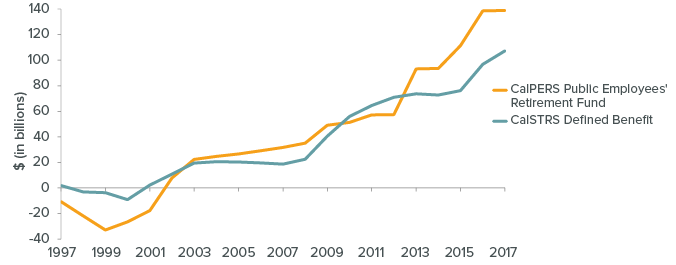
SOURCES: CalPERS and CalSTRS, Comprehensive Annual Financial Reports.
NOTES: Chart shows the largest funds at CalPERS and CalSTRS. CalSTRS unfunded liability level for 2002 was imputed.
- Liabilities have grown in part due to changing assumptions for investment returns.
Public pension funds are long-term investors—they expect short-term volatility but rely upon higher returns over time. Since the Great Recession, however, public pension plans around the country have projected lower future investment returns, leading them to reduce their assumed return rates. CalPERS and CalSTRS have followed suit and gradually decreased their expected rate of return from 7.5% to 7%. This lowered assumption regarding investment income—which supplies the majority of retiree benefits—may lead to higher estimations of liabilities and, in turn, increase contributions from employers and members.
Investment returns supply the majority of CalPERS retiree benefits
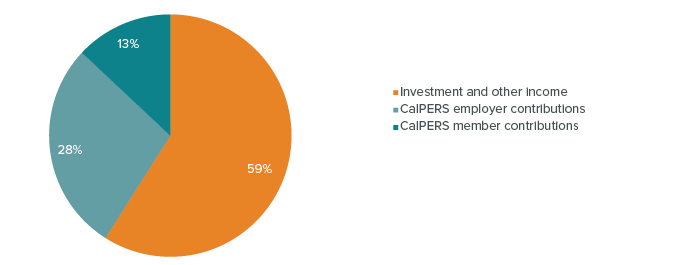
SOURCE: CalPERS, “Who Pays for CalPERS Pensions? The CalPERS Pension Buck.”
NOTES: Based on 20 years of data ending June 2018. CalPERS employer contributions include funds from school districts and charter schools, the state of California, and public agencies.
- Shifting state demographics mean higher pension costs and fewer active members.
The number of Californians age 65 and older grew from 9% of the population in 1970 to 15% in 2018—and is projected to reach 21% by 2030. Birth rates have declined and are projected to decrease through 2030, meaning fewer younger workers to support the increasing number of public employee retirees. For example, there were two active members contributing into CalPERS per retiree in 2001; the ratio dropped to 1.3 in 2015. Fewer active members and longer-living retirees contribute to higher unfunded liabilities. - Policy changes have begun to reduce state costs and increase employer contributions.
California passed legislation (PEPRA) in 2013 that reduced defined benefits, increased contributions for employers and employees, and delayed retirement ages. In addition, as part of a larger strategy to fully fund CalSTRS, AB 1469 set school districts’ share of teacher pension costs to increase from 8.3% of payroll in 2014–15 to 19% by 2020–21. Total district contributions are estimated at $5.7 billion in 2018–19. Recent state budgets have made sizable efforts to pay down unfunded liabilities and assist with higher contributions. - California’s local governments are especially affected by volatility in pension costs.
At least half of the employer contributions to state retirement systems in California come from local governments, which have smaller budgets and fewer ways to generate revenue when faced with higher pension costs. For example, pension contributions in Stockton rose from $6.8 million in 2002 to $41.5 million in 2017. One estimate suggests city pension costs will nearly double and reach up to 16% of general fund budgets by 2024–25. - Retiree health care is a key factor in addressing growing costs.
The unfunded liability associated with retiree health and dental benefits to state workers and their dependents is most recently estimated at $91.5 billion. The state adopted a plan in 2015–16 to begin prefunding these benefits with equal contributions from the state and employees. Prefunding retiree health care involves significant costs but could dramatically reduce future state obligations.
Sources: California State Controller’s Office, Public Retirement Systems Financial Data, 2017. League of California Cities, Retirement System Sustainability Study and Findings (January 2018). National Association of State Retirement Administrators, Issue Brief: Public Pension Plan Investment Return Assumptions (February 2019). California Department of Finance, State Population Projections. CalPERS, Interest Rates vs. CalPERS Investment Mix (December 2017). National Association of State Retirement Administrators, Public Fund Survey (FY 2017). Legislative Analyst’s Office, Proposition 98 Outlook (November 2018). Pew Charitable Trusts, The State Pension Funding Gap: 2016 (April 2018). For health care information: California State Controller’s Office (January 2018). For pension funding and investment returns: CalPERS and CalSTRS, Comprehensive Annual Financial Reports.
