Summary
California’s political representation depends on an accurate census in 2020-but an accurate count is far from guaranteed. Inadequate funding and fears among immigrant communities increase the likelihood of a significant undercount. Moreover, California is susceptible to an undercount: three in four Californians belong to at least one “hard to count” population, including Latinos, African Americans, renters, and others.
Do the threats to the 2020 Census put California’s political representation at risk? This report uses population trends and research on past undercounts to model several plausible scenarios in 2020. We find:
- California is on track to maintain 53 seats in the House of Representatives, given current population growth and a census as accurate as the last one. California will probably not gain a representative, whereas faster-growing states like Oregon, Arizona, and Texas are likely to gain seats.
- If the next census does a poor job of reaching traditionally hard-to-count populations and immigrant communities, more than 1.6 million Californians could be missed and the state could easily lose a seat. This scenario assumes a generally inaccurate count, similar to the 1990 Census, and a 10 percent undercount among households with one or more undocumented immigrants.
- Undercounting traditionally hard-to-count populations and immigrant communities could affect how political districts are redrawn within the state, shifting representation away from poorer areas with larger communities of color and toward wealthier and less racially and ethnically diverse parts of the state.
It is impossible to predict exactly how the 2020 Census will unfold. For example, it may be too restrictive to say only undocumented households would respond at lower rates or that a poorly conducted census would be similar to the 1990 Census. California could actually have a more accurate count than other states-increasing the likelihood of maintaining California’s political representation-if it dedicates enough resources. Accordingly, we consider a range of possible scenarios in this report.
There is much community organizations and state and local governments can do to improve the odds of an accurate census. With $90.3 million currently allocated in the state budget for census outreach, educating residents about the importance of the census for California and the security of the information they share with the Census Bureau will go a long way to ensuring that every Californian is counted.
Introduction
Every 10 years, as mandated by the Constitution, the federal government undertakes a census of the US population to determine the allocation of seats in the House of Representatives. The census has also become indispensable for other purposes’such as distributing federal funding across the country and providing a detailed portrait of residents-but its role in political representation is paramount. In addition to determining the size of California’s congressional delegation, the census count will be used to redraw federal and state legislative district boundaries. The rate of population growth since the last census-both across states and within California-will affect the number, location, and shape of new districts.
However, there are major concerns about the accuracy of the 2020 Census. Distrust and privacy concerns have driven survey response rates down, making surveys harder and more expensive to field. Today’s political climate is likely to exacerbate those concerns, especially after the federal government decided to add a question on citizenship status to the 2020 Census. Moreover, the Census Bureau, which has long argued that its funding levels are inadequate to count the nation’s growing population, is using new methods to modernize census-taking and cut costs. For example, the 2020 Census aims to be the first in US history to collect a majority of responses online. But insufficient funding could limit the agency’s ability to fully test and implement outreach activities designed to ensure a complete count.
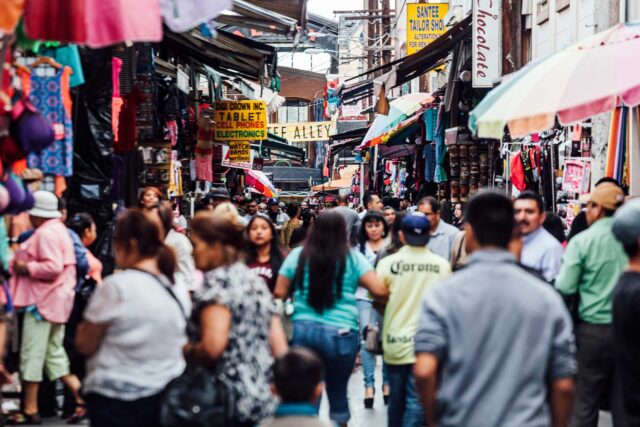
These challenges are a particular concern for California. Three out of four Californians belong to one or more populations that have been historically undercounted: children, young men, Latino and African American residents, and renters.1 These groups now make up a greater share of the state’s population than they did in 2010. Though the 2010 Census was the most accurate in the nation’s history, it still undercounted California by an estimated 0.26% (or 95,000 people), with larger undercount rates among hard-to-reach populations. PPIC’s interactive census maps show both historically undercounted populations and additional groups that may be hard to count in 2020.
This report begins by projecting the number of US House seats California may receive after 2020, assuming current trends in population growth and a census count as accurate as the last one. Next, we explore the potential impact on California’s share of House seats if the 2020 Census significantly undercounts the population because the census is poorly conducted in general and/or immigrant households respond at much lower rates. Finally, we present trends in population growth within California to highlight how district boundaries may be affected by the upcoming census count.
Population Growth and the 2020 Census
Since becoming a state in 1850, California has gained one or more seats in the House of Representatives in all but two censuses (1920 and 2010). If current trends in population growth continue and the next census is as accurate as the last one, the 2020 Census will be another exception. We project that under these conditions, California would maintain its 53 seats in the House of Representatives.
To gauge how California’s representation in Congress might change after the 2020 Census, we first project state populations to 2020 using current growth trends (see Technical Appendix A for details). We then apply the Census Bureau’s reapportionment formula for the 435 House seats to our population projections. This approach assumes that the 2020 Census will be as accurate in counting state populations as the 2010 Census.
California’s population is on track to grow 8.9% by 2020, adding 3.3 million people. Although this would be the lowest rate in the state’s history, California’s population growth rate is still 16th among all states and slightly higher than the nationwide growth rate (see Technical Appendix Table B1 for details). In terms of number of residents added, California will likely be second only to Texas. Overall, the state is projected to comprise a slightly larger share of the nation’s total population in 2020, compared to 2010.
The reapportionment formula is nuanced and depends on more than just population growth and size. Every state is guaranteed at least one representative. Beyond that, state population is the primary determinant. But large growth in the number of residents will not lead to an additional seat unless the state is also growing at a faster rate than the rest of the nation. The formula compares state populations to each other, while also considering how many seats a state already holds. This makes it subject to threshold effects: a state far from the threshold for a new seat might add a lot of residents without gaining a seat, while a state close to the threshold could gain a new seat with a much smaller change.2
Thus, California’s growth does not mean it will gain seats in 2020. In fact, if trends continue and the next census is as accurate as the last, we project that California will continue to be apportioned 53 seats in the House (Figure 1). In this baseline scenario, a handful of states are likely to gain seats: Arizona, Colorado, Florida, North Carolina, Oregon, and Texas. Several states, mostly in the Midwest and Northeast, will likely lose a seat.
Figure 1. Given current population trends and a fairly accurate count, California will likely keep its 53 House seats
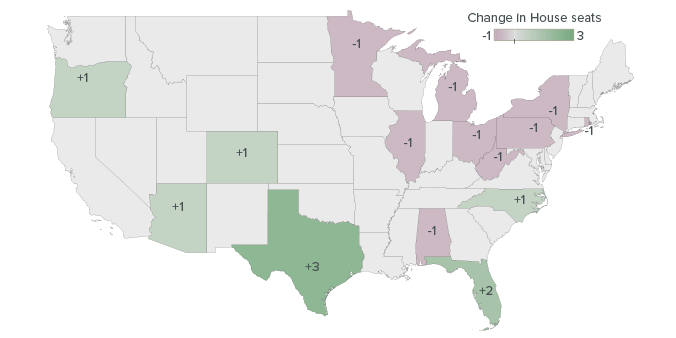
SOURCE: Authors’ calculations from US Census Bureau data.
NOTE: Relative to the 2010 apportionment, green states are gaining seats in our 2020 population forecast, purple states are losing seats, and grey states remain unchanged.
These results generally hold even under alternative population projections. In our baseline scenario, California is about 600,000 residents above the threshold for losing a seat, a fairly robust margin. When we apply population projections for the state developed by the California Department of Finance, California is similarly not in danger of losing a seat. The University of Virginia’s (UVA) Weldon Cooper Center for Public Service has state-level projections that suggest California would gain a seat. But California gains this extra seat by a margin of just 189,000 people-a relatively small margin given the size of California’s population. As a result, the seat gain is tenuous and tends to go away in our undercount scenarios below.3 On balance, California has grown enough to maintain its seats or possibly gain one seat in the House. California is unlikely, based on recent population trends and assuming a fairly accurate count, to lose a seat.
How Might California Be Undercounted?
An undercount could happen in innumerable and unpredictable ways. Our goal is not to say exactly what the undercount will be. Every census is different, and the challenges facing the next one make it particularly difficult to predict with certainty. Instead, we explore a few plausible undercount scenarios based on research and past experience, with the goal of benchmarking how severe an undercount would need to be to threaten California’s political representation.
We examine two different sources of an undercount:
- Low accuracy: groups that have been undercounted in the past are undercounted again, at similar or larger rates than before, due to inadequate funding or other reasons. We use the undercount rates of the 1990 Census, a particularly inaccurate census, as the starting point for this analysis.
- Immigration-related: individuals who are immigrants or live with immigrants are less likely to respond to the census for fear of being deported or otherwise targeted by the government. We use a 10 percent undercount among households with at least one undocumented immigrant as the starting point for this analysis.
Throughout, we focus on statewide undercount scenarios that treat all individuals in a demographic subgroup the same regardless of where they live within a state. For example, if Latino young children are severely undercounted in 2020, we assume that those living in Los Angeles will be undercounted at the same rate as those living in Fresno.4
Low-Accuracy Undercount
The risk of low accuracy stems from two concerns. First, many feel that the Census Bureau does not have the funding needed to follow up on hard-to-reach populations and ensure that as many of these residents are counted as possible (Seeskin and Spencer 2018). Second, the Census Bureau plans to collect the majority of initial responses over the Internet in 2020 to cut costs. Such a significant change requires extensive testing alongside the typical pre-census preparation. But due to insufficient resources, the Census Bureau is testing the computer systems that will support the Internet survey but not the outreach to inform residents about non-online options.5 Inadequate outreach will probably affect the same communities that are less likely to respond to the paper-and-pencil version.
The overall accuracy of the census has improved over time. The 2010 Census was the most accurate in the nation’s history, actually overcounting the total population by a modest 0.01 percent. But this overall rate masks differences in accuracy across states and demographic subgroups. For example, Latinos were undercounted by 1.54 percent-meaning that nationwide about 763,000 Latino residents were not represented in the 2010 Census.6 These undercount rates reflect an improvement from previous years, as the Census Bureau has made strides in reaching hard-to-count populations.
To understand the consequences of a low-accuracy census we turn to the 1990 Census, a well-documented case of a relatively high undercount.7 With a net undercount of 1.8 percent, the 1990 Census is the least accurate of the last several censuses, and a repeat performance would be a disappointing step backward consistent with concerns about the upcoming count. The Census Bureau has also carefully measured the size and scope of the 1990 undercount, including estimating undercount and overcount rates by age, race, renter/homeowner, and region (West and Robinson 1999). Latinos, for example, were undercounted by 5.0 percent, meaning that 1.2 million residents were left out of the 1990 Census nationwide. Furthermore, the 1990 Census actually happened, so we know that such an undercount is possible. Thus, we are not claiming that 2020 will look like 1990, though it certainly might. Rather, the 1990 Census is an example of a bad outcome that the Census Bureau hopes to avoid but that falls entirely within the realm of possibility.
Below, we simulate what would happen if the 2020 Census undercounted the same groups of people to the same degree as the 1990 Census did (see Technical Appendix Table A1 for specific undercount rates). The highest undercounts are for African American and Latino children and for renters, and all undercounts tend to be somewhat higher in the West than in other regions of the country. We use our 2020 population estimates as a baseline, which we then “downweight” based on the size of the undercount. For example, if a particular group had an undercount of 5 percent in 1990, we multiply that group’s population projection for 2020 by 0.95. It is important to note that the consequences of the 1990 undercount rates would be different in 2020 than they were originally since the US population is now more diverse, with more people living in the South and West.
Immigration-Related Undercount
A unique threat to the 2020 Census is the current political climate toward immigrants, which motivates a second undercount scenario. Federal government rhetoric and actions around border security, deportation, and immigrant rights have raised concerns among immigrants, even those legally in the United States.8 These concerns arguably make it much harder for a federal agency like the Census Bureau to obtain responses from immigrant households. In addition, the Department of Commerce approved adding a question on citizenship to the 2020 Census. A citizenship question has not been asked of every respondent since 1950, and even Census Bureau staff fear it will harm the accuracy of the census (Brown et al. 2018). Furthermore, the question was added too late for the Census Bureau to test approaches to minimizing nonresponse.
Information reported to the Census Bureau is protected by federal law, which prohibits releasing any data that can identify individuals or sharing the information with any other government entity for anything beyond broad statistical purposes. However, research suggests residents, even those born in the country, are unaware or skeptical of these protections (Kissam 2012; Maslin and Sonenshein 2017; Meyers and Goerman 2017).
In addition, foreign-born residents are a diverse group, currently numbering more than 43 million nationwide, and it is impossible to know how different subgroups might respond to the census in the current climate. Roughly half of foreign-born residents are naturalized US citizens, a quarter are estimated to have legal status of some sort (e.g., a green card, a work visa like H1-B, or temporary protected status), and a quarter are estimated to be undocumented. Will naturalized immigrants be more likely to answer the census, perhaps even more likely than some US-born minority groups? Will news of ICE (Immigration and Customs Enforcement) arrests of legal permanent residents dampen the response of green-card holders to the census? These questions are further complicated by the fact that many immigrant households include individuals with a variety of legal statuses and birthplaces (i.e., US born or foreign born). Each household is supposed to get a census form, and the primary respondent for the household may choose not to list all members or may not respond at all if, for example, one or more family member is undocumented.
The representation of foreign-born residents in the 2020 Census is thus difficult to predict and highly dependent on outreach efforts by the Census Bureau, state and local governments, media, and especially community organizations. Below we consider an undercount similar to that observed in the American Community Survey, a large-scale Census Bureau survey that asks respondents detailed questions about individuals in their household, including birthplace and citizenship status. In typical years, immigrants are estimated to be undercounted by 10 percent in the American Community Survey (Jensen et al. 2015). This is similar to the share of respondents who answer the survey but skip the citizenship question (Clark 2014).
However, the response rates documented in these studies do not account for the potential impact of the current political climate. While this is hard to pin down, the undercount could plausibly be much higher than 10 percent, especially among households with undocumented immigrants. For example, case studies of hard-to-count immigrant subgroups like farmworkers suggest undercounts as high as 38 percent in the 2000 Census or up to 52 percent in the 1990 Census (Gabbard et al. 1993; Kissam and Jacobs 2004). Related research identifies a dramatic effect of immigration enforcement on participation in government programs like SNAP (the Supplemental Nutrition Assistance Program, formerly known as food stamps) and the Affordable Care Act, on the order of a 10 to 30 percent decline even among naturalized immigrants (Alsan and Yang 2018).
Based on this research, we consider an immigration-related undercount of 10 percent as a starting point. “Immigration-related” here means those who are either undocumented or live in a household with at least one undocumented immigrant. This is the group most likely to be affected by an undercount and serves as a lower bound of estimates for reapportionment. We also explore scenarios that assume a broader impact of the current political climate, including undercounts among households with at least one noncitizen of any legal status and among Latinos and Asians/Pacific Islanders of any citizenship and legal status.
The Potential Impact of Undercounting
How might a substantial undercount affect the reapportionment of House seats in 2020? The challenges behind the two kinds of undercounts described above are unpredictable and changing day to day. They are also driven by somewhat distinct factors-even if the Census Bureau received more funding to support the online survey, for example, immigrant communities may still be reluctant to respond in this political climate. Thus a combination of both kinds of undercounts seems more likely than seeing just one or the other. Our analysis begins with a scenario that combines the low-accuracy undercount with an additional undercount for individuals in undocumented households. We then examine isolated scenarios of low-accuracy undercounts and immigration-related undercounts.
Combined Low-Accuracy and Immigration-Related Undercount
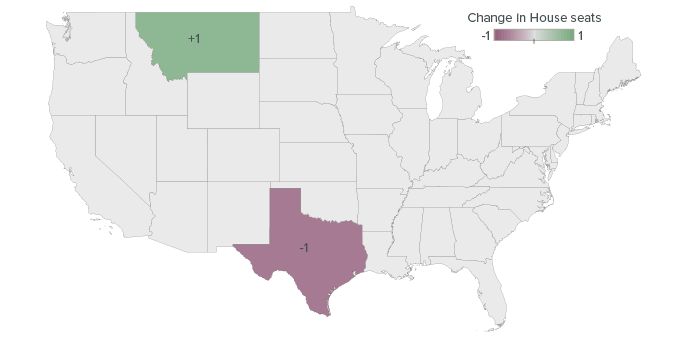
Figure 2 shows the potential impact on House apportionment in our combined scenario-a low-accuracy undercount similar to the 1990 Census and an undercount of 10 percent for individuals in undocumented households (see Technical Appendix A for details). If both of these undercounts occur, about 1.6 million Californians would be left out and the state would likely lose a seat relative to the baseline projection. However, California remains close to the threshold: it is only about 100,000 residents short of maintaining its 53rd seat and would be next in line among all states to receive one.
This scenario produces other shifts in the apportionment of House seats as well. Relative to the baseline population projections (Figure 1), Arizona and Texas would also lose a seat, and Minnesota, Montana, and Ohio each would gain one. However, these states would be no worse off-and Texas and Montana would be better off-compared to their current number of seats in the House. Only California would lose an existing House seat.9
Figure 2. A poorly conducted census’similar to 1990-and a 10 percent undercount of undocumented households would cost California a House seat
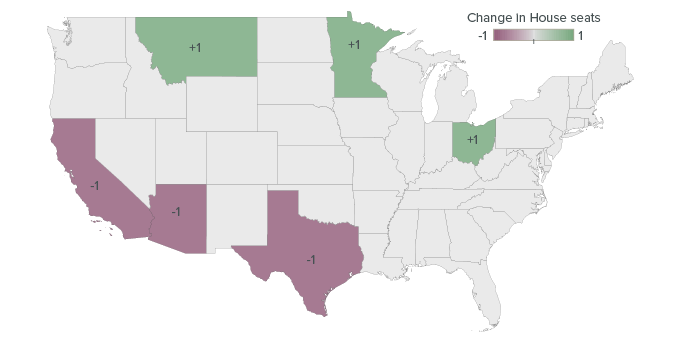
SOURCE: Authors’ calculations from US Census Bureau data.
NOTE: Relative to the baseline estimate in Figure 1, green states are gaining seats in our combined undercount scenario, purple states are losing seats, and grey states remain unchanged.
Because California is disproportionately affected by these undercounts, as the undercount worsens California’s relative position worsens as well. Even so, it would take a much larger undercount to cost California a second seat (every undercounted group would need to be undercounted by an additional 11%).10
There is a great deal of activity around the census in California, and it is possible that the count may actually be more accurate here than in other states. The latest state budget includes $90.3 million for census outreach to ensure as many Californians respond as possible, and local governments and community groups are planning their own efforts. If California alone improved its undercount of all groups by 1 percent, the state would no longer lose a seat, and if the undercount in California were improved by 5 percent, the state would actually gain a seat.11 Thus there is still room for meaningful independent state action.
The above scenarios assume that there will be both a poorly conducted census and a low response rate among households with undocumented immigrants. Below we examine what would happen if only one of these scenarios occurs.
Low-Accuracy Undercount Only
Figure 3 presents our estimates of what would happen if the nation had an undercount similar to the 1990 Census but without any immigration-related undercount at all. Despite a lower population count (by about 1.1 million) and a lower growth rate relative to the baseline projections, in this scenario California still holds 53 seats by a margin of about 200,000 residents. In other states, the undercount yields similar results: lower population growth rates but in general not enough to prompt losing a seat. In fact, the only change from the baseline prediction is that Arizona no longer gains a seat and Minnesota no longer loses one.12
Figure 3. By itself, a poorly conducted census, similar to 1990, would not change California’s House seats
SOURCE: Authors’ calculations from US Census Bureau data.
NOTE: Relative to the baseline estimate in Figure 1, the green state is gaining a seat in our low-accuracy undercount scenario, the purple state is losing a seat, and grey states remain unchanged.
As before, it is useful to test the limits of these results since we do not know for certain what the undercount will look like. If the rate of undercount from 1990 were worsened by 5 percent for each undercounted group, California would lose a seat. If overcounted groups were also counted more-thus worsening the count in both directions-it would take only a 3 percent change to lose a seat. And if California is the only state where undercounted groups are undercounted more, it takes being just a single percentage point worse than the 1990 undercount to lose a seat. On the other hand, California could actually gain a seat if its undercount-and not those of other states-were 3 percent better than the 1990 undercount.
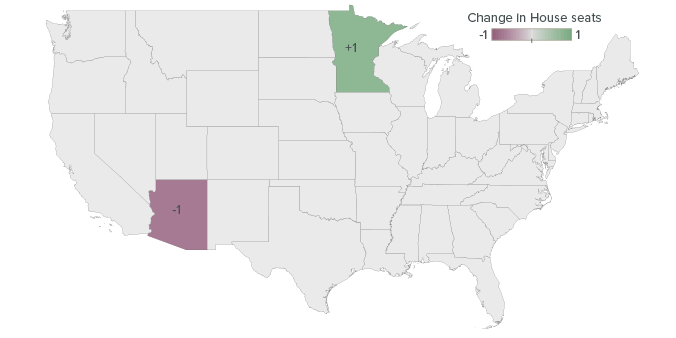
Immigration-Related Undercount Only
Figure 4 presents our estimates of what would if happen if households with at least one undocumented immigrant were undercounted by 10 percent but there were no broad low-accuracy undercount. This scenario still leaves California with 53 House seats, though it reduces the state’s overall population count by about half a million people compared to the baseline projections. The margin for losing a seat is a little more generous here than in the low-accuracy scenario, leaving a cushion of about 240,000 people. Nationwide, House seats for Arizona and Minnesota remain unchanged, but Montana picks up a seat at Texas’s expense. Otherwise, this scenario is similar to the baseline estimate.13
Figure 4. By itself, a 10 percent undercount of undocumented households would leave California’s House seats unchanged
SOURCE: Authors’ calculations from US Census Bureau data.
NOTE: Relative to the baseline estimate in Figure 1, the green state is gaining a seat in our immigration-related undercount scenario, the purple state is losing a seat, and grey states remain unchanged.
We would need to see a very substantial undercount among undocumented households to cost California a seat: households with at least one undocumented immigrant would have to be undercounted by 19 percent. Even if only undocumented households in California were undercounted and those in every other state were perfectly counted, 13 out of every 100 people in California households with undocumented immigrants would have to be missed. These undercount rates are not out of line with some of the research studies discussed earlier, but they do indicate that the undercount of undocumented households would need to be relatively bad to take away a seat.
Once again, it is worth considering what happens if California’s count is actually better than those of other states. With a 10 percent undercount of undocumented households, California keeps its 53rd seat by a margin of 240,000 residents. If California, but not other states, improves that undercount by just 5 percent (i.e., so that 95 out of 100 people in undocumented immigrant households are counted, instead of 90), its margin more than doubles to about 500,000 residents. The margin tops out at about 760,000 if California fully counts the undocumented population but other states do not. It is not possible for California to pick up a seat in these scenarios.14
It may be too restrictive to say that only undocumented households would be afraid of responding to the census. If we broaden our analysis to include any household with at least one noncitizen of any legal status, it only takes an undercount of 8 percent to lose a seat. Furthermore, if we assume an effect tied not to citizenship but ethnicity, with an effect on Latinos and Asians/Pacific Islanders of any background, it becomes even easier for California to lose a seat.15 A 4 percent undercount of Latinos and Asians/Pacific Islanders would be enough to cost California a seat. Note that these estimates assume only Latinos and Asians/Pacific Islanders are undercounted, and all other demographic subgroups are counted at least as accurately as in 2010.
The Potential Effect on Political Redistricting
The 2020 Census will also be used to redraw political boundaries within the state, including for congressional, state senate, and state assembly districts.16 Local governments such as cities and counties must redraw districts within their borders as well.
The need to redraw district boundaries is driven by trends in population growth. Political districts must be approximately equal in population, so any deviations in population that emerge between censuses must be corrected after the size of the deviation becomes apparent.17 California overall is on track to grow 8.9 percent by 2020. However, parts of the state are growing much more slowly or are losing residents, while other areas are growing at much faster rates. These patterns could yield shifting district boundaries following the 2020 Census.
Figure 5 shows projected population growth from 2012 to 2020. Although this omits two years of population change (2010-12), these data allow us to examine projected growth within key demographic subgroups and at the sub-county level for densely populated regions. Specifically, we show public use microdata areas (PUMAs), geographic designations of at least 100,000 people. The highest population growth is projected outside of larger cities in outer suburban and inland areas, such as the San Joaquin Valley and Inland Empire.
Figure 5. Some parts of California are projected to grow by 10 to 20 percent between 2012 and 2020
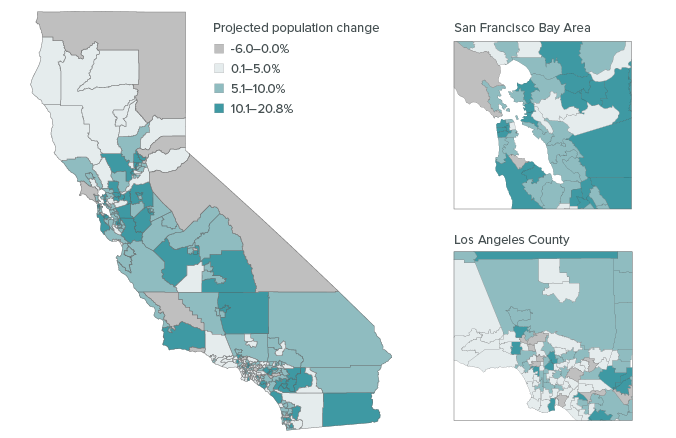
SOURCE: Authors’ calculations from US Census Bureau and California Department of Finance data.
NOTE: Population change is calculated based on growth from 2012 to projected 2020 estimates for public use microdata areas (PUMAs) in California.
Regions are not equally affected by the combined undercount scenario, where both low-accuracy and immigration-related undercounts occur. This is not a result of regional differences in undercounting but rather due to the differential demographic makeup of regions across California. Areas of California with larger communities of color-ranging from central Los Angeles to the San Joaquin Valley-have substantially larger undercounts than other areas, reaching up to 9.4% in some parts of the state (Figure 6). Technical Appendix Table B5 contains county-level estimates of undercount rates under this scenario.
Figure 6. Substantial undercounts could divert representation away from low-income communities of color
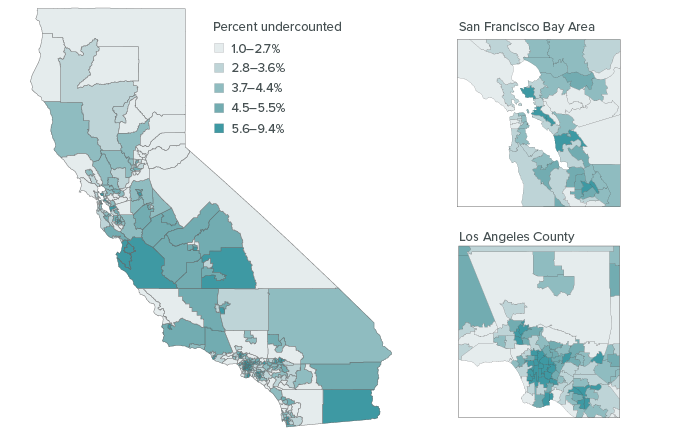
SOURCE: Authors’ calculations from US Census Bureau and California Department of Finance data.
NOTE: Percent undercounted (using the combined low-accuracy and immigration-related scenario) is calculated based on projected 2020 estimates for public use microdata areas (PUMAs) in California. County-level estimates are available in Technical Appendix B.
In this scenario, where traditionally hard-to-count populations and households with undocumented immigrants are undercounted, not only could California lose a seat in Congress (as Figure 2 showed), but the balance of districts within the state could be affected in significant ways. Many parts of the state that are projected to have the greatest population growth by 2020-including the San Joaquin Valley and Inland Empire-are also projected to be disproportionately undercounted. The demographic composition of these areas and others, like southcentral Los Angeles and eastern sections of the Bay Area, means that they are more at risk of being undercounted. This could shift political representation away from communities of color and toward parts of the state that are wealthier and predominantly white.
Conclusion
The 2020 Census faces many political and practical challenges, and an accurate count is not guaranteed. Our estimates suggest that California could lose a seat if realistically large undercounts occur among traditionally hard-to-count groups and immigrant communities.
We examine two potential kinds of undercounts. The first mirrors the poorly conducted 1990 Census-the least accurate of the last several censuses-which severely undercounted traditionally hard-to-count populations, including Latinos, African Americans, renters, young children, and others. The second is an immigration-related undercount, where immigrant households respond at lower rates. If the 2020 Census is similar to the 1990 Census and households with one or more undocumented immigrants are undercounted by 10 percent, California could easily lose a seat in the House of Representatives. If the undercount is worse in California than elsewhere, the state’s risk of losing a seat also increases.
How might we know if there is a significant undercount in California? One way is by comparing the California Department of Finance (DOF) population estimates on the eve of the census count to the census count itself. Though these numbers are only estimates’specifically, extrapolations from the last census using administrative records-they are likely to be broadly accurate.18 Any significant deviation would probably reveal a deeper problem with the census count.
The Census Bureau also conducts two separate validations of its own count. The first is a post-enumeration survey where census workers recanvass a random sample of census blocks more aggressively and compare the results to the original census count for the same blocks. The second is a demographic analysis where the Census Bureau adjusts the 2010 population count using administrative records on births, deaths, and migration.19 Assuming that funding limitations at the Census Bureau do not prevent these evaluations, these assessments can give a good sense of whether the official count is biased, in what way, and by how much.
Though the state is bound by law to accept the official census count for congressional reapportionment, if there appears to be a substantial undercount, California might have leeway when redrawing districts within the state.20 The state might be permitted to substitute its own count for the official census or to adjust the census count using the Census Bureau’s undercount estimates. In 1991, the California State Assembly requested the Census Bureau’s detailed undercount estimates for this purpose, though the Census Bureau ultimately turned down the request (Barringer 1991). However, the law on this issue remains unsettled, and the state could face a legal challenge for using alternate counts, even if it ultimately prevailed in the courts. The easiest and least contentious approach is simply to ensure a quality census count in the first place.
What can be done to avoid a large undercount in California? Community organizations and state and local governments have an important role to play. The state has currently allocated $90.3 million for census outreach, and efforts to educate residents about the importance of the census for California and the security of the information they share with the Census Bureau will go a long way toward ensuring that every resident is counted. In fact, our analysis suggests that even a modestly improved count for California relative to other states would be enough to maintain California’s 53 House seats.
The consequences of a significant undercount could be costly for the Golden State. If there is a change in federal policy-for instance, if the Census Bureau receives more funding or if the citizenship question is not added-the situation would look much better for California. But it is important to emphasize that vigorous outreach by California government and stakeholders could make a real difference and stave off some of the worst outcomes. California is far from powerless to control its fate.
Topics
Political Landscape PopulationLearn More
2020 Census: The Political Impact on California
2020 Census: Where Are California’s Hard-to-Count Communities?

Californians and the 2020 Census

Census-Related Funding in California

Policy Brief: How Accurate Was California’s 2020 Census?

Video: 2020 Census: What’s at Stake for California?
