

Key Takeaways
Over the past decade, expansions of Medi-Cal (federally known as Medicaid) and federal subsidies under the Affordable Care Act (ACA) have improved access to health insurance for millions of lower-income Californians. Insurance does not guarantee access to health care, but it does make care more affordable and should shield families from large financial shocks generated by medical crises. To more accurately assess the impact of health coverage (or lack thereof) on poverty across California, we developed a health-inclusive California Poverty Measure that integrates health insurance coverage as a basic need, along with food and shelter. Our analysis finds:
- Including health insurance in our measure increases the resources required to remain out of poverty by nearly 60 percent. As a result, poverty rates are substantially higher for Californians without health insurance: nearly four in ten are living in poverty (38.4%), compared to 18.5 percent of those covered by Medi-Cal and only 4.2 percent of those with employer-based coverage.→
- The Medi-Cal program plays a critical role in helping families achieve a basic level of resources. In the absence of Medi-Cal, poverty among young children could increase from 7 percent to 16.9 percent. For adults age 45 to 64, poverty could increase from 13.1 percent to 19.3 percent.→
- Poverty rates are highest among demographic groups that are more likely to lack health care coverage—in particular, non-citizens (27%). When the state expands Medi-Cal coverage to all income-eligible Californians in 2024, we estimate that poverty could drop by 2.9 percentage points for non-citizens; this should have a large impact on undocumented immigrants and families with mixed immigration statuses.→
- Covered California reduces poverty by providing premium subsidies that lower costs for low- and middle-income Californians. Without these subsidies, poverty would be a percentage point higher overall, and nearly 2 percentage points higher for older adults (ages 45–64) and Asian Americans—groups that are more likely to purchase individual coverage. The expiration of pandemic-era federal subsidy enhancements in 2025 could slightly increase poverty.→
- A more immediate—and larger—concern is how the resumption of Medi-Cal eligibility determinations starting in April 2023 could impact poverty. Monitoring the extent to which people become uninsured if they lose Medi-Cal coverage during the redetermination process should be a high priority.
Introduction
Health care is widely recognized as a basic need—as evidenced by large public investments in health care systems and insurance coverage for broad swaths of the population. Health insurance does not necessarily guarantee access to health care, but it does make care more affordable and, importantly, provides at least some measure of financial protection in the event of a major health crisis.
The federal Affordable Care Act (ACA) has resulted in massive expansions of publicly funded health coverage over the past decade. Millions of Californians gained health insurance through expansions to the state’s Medicaid program, Medi-Cal, and through subsidies of coverage purchased through the state’s insurance marketplace, Covered California. The ACA has been linked to significant improvements in financial well-being—including reduced debt, fewer bankruptcies, improved credit ratings, and access to credit (Guth, Garfield, and Rudowitz 2020).
To better understand the impact of health coverage on poverty, in this report we add insurance needs and costs to the California Poverty Measure (CPM), which itself builds on the longstanding official poverty metric to account for major social safety net programs. In line with a proposal to update the Census Supplemental Poverty Measure (SPM), we created a health-inclusive poverty measure that factors in health insurance and provides a way to assess improvements in economic well-being stemming from public investments in health coverage (Korenman and Remler 2016; Korenman, Remler, and Hyson 2019). This report focuses mostly on Californians under age 65, as insurance coverage and costs for those over 65 is largely tied to federal Medicare policy.
The resulting health-inclusive CPM can be an important tool for tracking the impact of changes to insurance coverage over the next few years. California is slated to expand Medi-Cal to all income-eligible residents, regardless of immigration status, in January 2024. At the same time, millions of Californians are expected to lose Medi-Cal coverage (though many could transition to other coverage) once the state resumes its eligibility redetermination process in spring 2023—the process was suspended during the pandemic in an effort to keep people healthy and financially stable (ASPE 2021).
Health Insurance Is a Significant Basic Need
Reflecting the substantial cost of health insurance, health-inclusive poverty thresholds are on average about 60 percent higher than CPM thresholds, although household composition makes a difference. Because we scale health insurance need both by age (e.g., it is cheaper to cover children than adults) and by household size (e.g., two-person coverage costs twice as much as single-person coverage), the differential is greater for households with older adults or seniors and for larger households.
The cost of living varies considerably across California’s diverse regions, and the CPM adopts the national SPM framework, which factors the varying cost of housing into poverty thresholds. Similarly, the health-inclusive framework allows us to capture geographic differences in the cost of health insurance. Health care costs are lower, on average, in Southern California and higher in the Bay Area and northern parts of the state, which are reflected in the premium costs for health insurance plans available from Covered California. This regional variation is incorporated into our health-inclusive poverty thresholds.
Across the state, the annual amount required to meet the basic needs of a family of two adults with children is about $53,000—about $17,000 of which is related to health insurance coverage (Technical Appendix Table B6). However, there are relatively large differences across California. Counties in the Central Valley have considerably lower health-inclusive poverty thresholds (around $45,000) compared to some counties in the Bay Area such as San Mateo or Santa Clara, where the resources needed to make ends meet add up to around $70,000. While much of this variation is driven by differences in housing-related costs, health insurance costs also contribute to regional variation.
Current subsidy structures and public coverage through Medi-Cal insulate many low-income (and some middle-income) individuals from sizable cost differences across regions, but these differences have implications for state and federal spending. The federal government provides the majority of Medi-Cal funding, and about nine in ten Covered California enrollees rely on federal subsidies. The state plans to continue additional subsidies for middle-income families and some federal subsidies are temporary, so it is important for state decision-makers to be able to track this variation.
Uninsured Californians Are Twice as Likely to Live in Poverty
The health-inclusive CPM paints a particularly stark picture for Californians who continue to lack comprehensive health coverage. Poverty rates for the uninsured are more than double the rates for low-income families with Medi-Cal coverage (Figure 1). To be sure, poverty varies widely among those who are insured: rates range from 4.2 percent among Californians with employer-based insurance, to 15.6 percent among those who purchase insurance through Covered California, to 18.5 percent among those with Medi-Cal. We would expect poverty rates to be higher among those with Medi-Cal coverage, since the program serves Californians with low incomes. However, variation in poverty rates is also driven by other factors, including employment opportunities and barriers, housing costs, and access to social safety net programs.
Health-inclusive poverty rates are at least twice as high among those who are uninsured

SOURCE: Author calculations from the health-inclusive CPM (fall 2021).
NOTES: Estimates include only Californians under age 65. Medi-Cal counts are corrected for survey underreporting. See Technical Appendix B. All those who report “direct purchase” insurance are categorized as enrolled through Covered California. “Employer” is employer-based coverage. “All other” includes IHS, VA, and Medicare. For an alternate version of these statistics that incorporates a broader imputation of Medi-Cal coverage, see Technical Appendix Table D3.
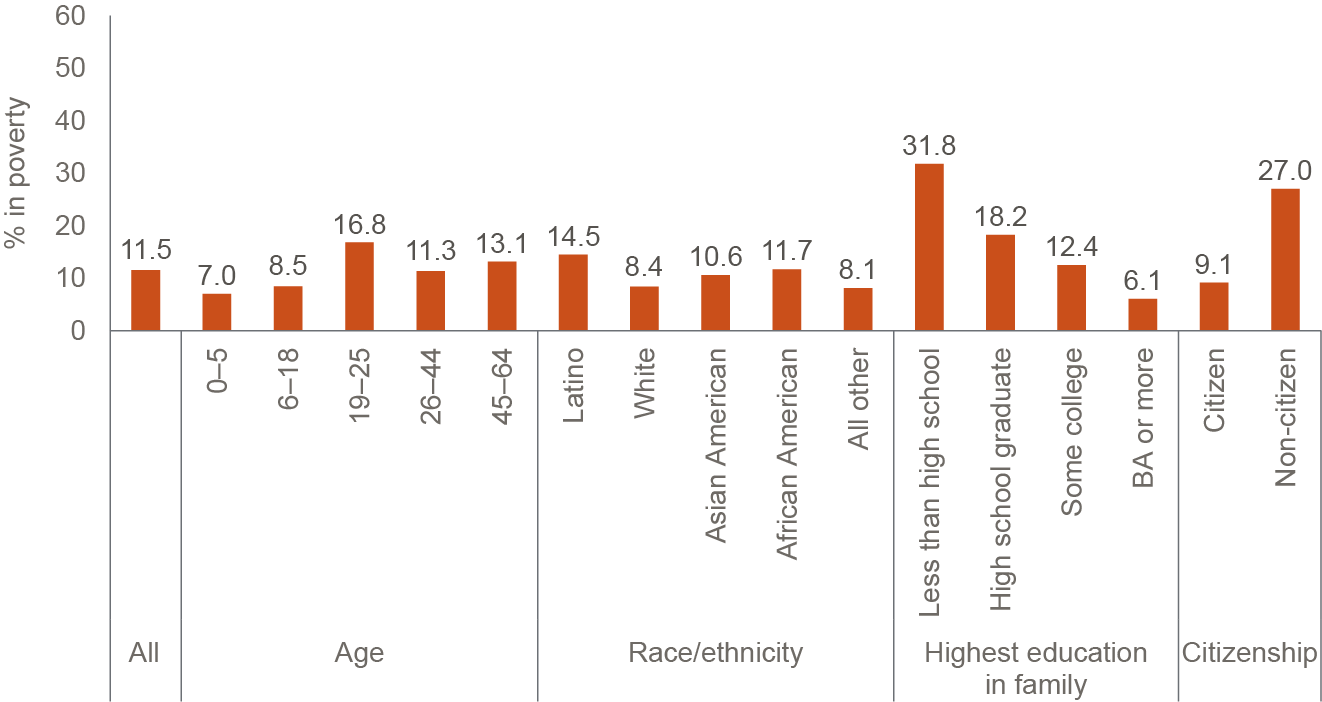
Health-inclusive poverty rates also vary widely across demographic groups (Figure 2). Here, too, of course, poverty is driven by many other factors. Looking at variation across age groups, for example, we know that substantial pandemic investments in the federal Child Tax Credit and CalFresh food assistance significantly reduced poverty rates among children, which had been the highest among age groups; as of fall 2021, children had the lowest poverty rates (Danielson, Malagon, and Bohn 2022). Among those under age 65, poverty was highest among young adults (ages 18–25), even though they are more likely to be insured than are older adults (see Technical Appendix Table B3). In the health-inclusive framework, however, poverty tends to be highest among population groups that more often lack health insurance—particularly non-citizens and those in families without a high school graduate.
Health-inclusive poverty rates are sharply higher for non-citizens and those in families without a high school graduate
SOURCE: Author calculations from the health-inclusive CPM (fall 2021).
NOTES: Estimates include only Californians under age 65. We focus on the population under 65 because insurance costs and coverage for seniors is mostly governed by federal policy under the Medicare program. Non-citizens include both legal permanent residents and undocumented immigrants. Educational attainment categorized by highest level in the family.
Medi-Cal Coverage Has a Big Impact on Poverty
State and federal expansions over the past decade have heightened Medi-Cal’s contribution to family resources. We can gauge the contribution by calculating how high the poverty rate would be in its absence. Because some individuals would likely obtain insurance from other sources, this is an upper-bound scenario. If we zero out Medi-Cal from family resources, health-inclusive poverty rates are dramatically higher among all Californians under age 65; the overall rate increase, from 11.5 percent to 18.9 percent, translates to an increase of up to 2.4 million Californians (Figure 3). This is more than twice the increase in poverty in the absence of CalFresh, the largest poverty-mitigating social safety net program (Danielson, Malagon, and Bohn 2022). Among children, who have always had the broadest eligibility for Medi-Cal, poverty could more than double absent Medi-Cal coverage. Among adults who were most directly affected by the Medi-Cal expansion under the ACA, poverty could increase by about half. These large poverty differentials underscore the success of the federal and state investments that have reduced California’s uninsured rate to historic lows.
Without Medi-Cal, health-inclusive poverty would be much higher—especially for children

SOURCE: Author calculations from the health-inclusive CPM (fall 2021).
NOTES: Estimates include Californians under age 65. Orange bar segments and corresponding orange numbers indicate the percentage point increase in health-inclusive poverty after zeroing out Medi-Cal from family resources, and assumes that Medi-Cal recipients become uninsured.
It is also important to consider Medi-Cal’s impact on people who may themselves have other insurance coverage but have family members—most often children—who rely on Medi-Cal (Figure 4). For example, nearly a fifth of people who buy health insurance directly through Covered California have a household member who is covered by Medi-Cal; the same is true for an estimated 14.5 percent of individuals with employer-based coverage. And more than two-thirds of Californians without insurance (67.2%) would see a rise in poverty absent Medi-Cal because other family members rely on the program to meet their health insurance needs.
Uninsured Californians are especially likely to have a family member covered by Medi-Cal

SOURCE: Author calculations from the health-inclusive CPM (fall 2021).
NOTE: Estimates include only Californians under age 65 with more than one person in their family unit. They show percentages of people with other sources of insurance (or who are uninsured) who have a family member with Medi-Cal coverage.
Expanding Medi-Cal to All Low-Income Californians Could Lower Poverty
Many uninsured Californians are not eligible for full Medi-Cal benefits because of their immigration status (Dietz et al. 2021). However, the state has been expanding comprehensive Medi-Cal coverage to undocumented immigrants, and plans to complete the expansion to all income-eligible residents in 2024. We therefore estimated the poverty effect of full enrollment among those who are income eligible. We found the biggest impact on poverty among non-citizens—who make up 12 percent of all Californians. This group would see up to a 2.9 percentage point decline in poverty, equivalent to 125,000 people moved out of poverty (Figure 5). The expansion will improve the economic circumstances of 1.6 million Californians who are themselves undocumented or who are members of mixed-citizenship-status families with low incomes. In particular, we anticipate a 2.5 percentage point decline in poverty among all members of mixed-status families. Technical Appendix Table D4 provides estimates for regions and additional demographic groups.
Once California fully expands Medi-Cal, poverty is expected to drop among non-citizens and their families

SOURCE: Author calculations from the health-inclusive CPM (fall 2021).
NOTES: Estimates are for individuals and include only those under age 65. “Potential decrease after January 2024 expansion” assumes that all income-eligible undocumented residents who are uninsured will enroll in Medi-Cal. “Not a citizen” includes both those residing legally in the US and those who lack legal documentation. Individuals in “All non-citizen” families make up only 4 percent of all Californians.
Our analysis suggests that the 2024 Medi-Cal expansion will result in meaningful poverty reductions. Though it is difficult to pinpoint exactly, given uncertainty about program take-up, these improvements to economic well-being will be concentrated among undocumented immigrants and mixed-status families.
Longstanding Concerns about Medi-Cal Payment Rates and Access to Care Deserve Attention
From a household finance perspective, comprehensive Medi-Cal coverage should be considered “better” than the Covered California silver plans that we use to determine the benchmark cost of adequate health coverage. For the most part, Medi-Cal requires minimal out-of-pocket spending for either premiums or services. It also covers a broad range of services—including medical transportation and long-term care—that are not covered by most other health insurance plans.
However, the value of insurance coverage is also premised on access to medical care, and there are longstanding concerns about whether Medi-Cal coverage offers adequate access to health care providers and services (California State Auditor 2019a; California State Auditor 2019b). Researchers and advocates often cite lower payment rates and provider reimbursements as the main reason that fewer health care providers are willing to treat Medi-Cal enrollees (Zuckerman, Skopec, and Aarons 2021; MACPAC 2021). In a recent study, Medi-Cal enrollees did report more problems finding doctors who would accept their insurance compared to people with employer-based insurance or Covered California plans, even after adjusting for socio-economic factors and health status (Ponce et al. 2021).
The direct effects of payment rates on access to care for Medi-Cal enrollees are beyond the scope of this report. However, we can do some simple cost comparisons in response to potential concerns that Medi-Cal coverage should not be considered equivalent to Covered California health plans. To provide a broad assessment of differences in the cost of Medi-Cal health plans and the cost of Covered California silver plans that we use for our poverty thresholds, we compared Medi-Cal capitation rates with the full premium for Covered California silver plans. Statewide, we find that the costs of the Covered California silver plan are about 20 percent higher than Medi-Cal capitation rates, on average. There are differences across regions. For example, in the Inland Empire (Riverside and San Bernardino Counties) and San Diego County, Medi-Cal capitation rates are nearly equivalent to the cost of the Covered California silver plan. In contrast, in counties in the Bay Area and the far Northern and Eastern regions of the state, Medi-Cal capitation rates are more than one-third lower than the silver plan costs.
On the one hand, we might expect that Medi-Cal, the single largest purchaser of health insurance in the state, could negotiate lower rates. In recent years, the Medi-Cal program has spent over $100 billion annually on medical services for enrollees (California Department of Health Care Services 2022). On the other hand, Medi-Cal covers more benefits—for example, long-term care that is quite expensive—and also serves a low-income population with potentially greater social needs, which can increase the cost of health care (Whitman et al. 2022). Without more detailed information on health care costs and usage patterns, it is difficult to pinpoint a Medi-Cal payment rate that would ensure adequate access. The new Office of Health Care Affordability should provide more data resources and greater transparency that can help to untangle these intertwined issues. Certainly, as the Medi-Cal program continues to expand eligibility, policymakers will want to monitor access standards and ensure that people can get the care they need.
Covered California Subsidies Also Reduce Poverty
Californians with incomes too high to qualify for Medi-Cal and who do not have access to affordable employer-based coverage can get premium subsidies to help them pay for insurance through Covered California. Federal subsidies—also referred to as premium tax credits—are available to people with incomes between 100 and 400 percent of the federal poverty level (about $26,500–$106,000 for a family of four in 2021). These subsidies are structured on a sliding scale, so that people at lower income levels contribute a smaller amount of household income and thus receive a larger subsidy than those with higher incomes.
California began offering state subsidies in 2020 to help people with higher incomes—up to 600 percent of the federal poverty level (about $160,000 for a family of four)—pay for health coverage. As part of federal COVID relief efforts, the 2021 American Rescue Plan Act (ARPA) included time-limited subsidies for higher-income individuals and larger subsidy amounts at all income levels, which increased enrollment in California (Covered California 2022). We use these ARPA-enhanced amounts to estimate the impact of premium subsidies on poverty, though the increases in federal premium subsidies are slated to expire in 2025.
In 2021, Covered California provided health coverage to about 1.6 million people, with nine in ten enrollees receiving premium subsidies (California Health Benefit Exchange 2021). On average, Covered California enrollees received premium subsidies of nearly $500 per month. These subsidies helped reduce poverty by about 1 percentage point overall—equivalent to about 345,000 fewer Californians in poverty (Figure 6)—with a larger impact on middle-aged adults (45–64), reflecting that group’s higher rate of purchasing insurance from Covered California (10.5% vs. under 9% for younger Californians; see Technical Appendix Table B5).
Without Covered California subsidies, 350,000 additional Californians would be poor

SOURCE: Author calculations from the health-inclusive CPM (fall 2021).
NOTE: “All” includes only Californians under age 65. Increases shown in the orange segment of each bar are based on the assumption that everyone who has directly purchased insurance maintains this coverage without government subsidies.
Conclusion
Access to health care has expanded significantly over the past decade, and safety net expansions during the COVID-19 pandemic helped Californians stay healthy and financially stable. These expansions have highlighted the key role that federal and state policy can play in reducing poverty. This report marks an important step in developing tools that can evaluate the role of publicly funded health insurance in reducing poverty.
Our measure shows the substantial role that Medi-Cal plays in mitigating poverty; we estimate the program kept up to roughly 2.4 million Californians under age 65 out of poverty in 2021, far outstripping the role of social safety net programs like CalFresh food assistance and the 2021 federal Child Tax Credit (Danielson, Malagon, and Bohn 2022). This is not surprising, given the high cost of health care and the wide reach of Medi-Cal—with total spending of about $120 billion in recent years, Medi-Cal is the state’s largest program expenditure. Medi-Cal enrollment swelled to more than 15 million during the pandemic and uninsured rates dropped in California even amid historic levels of employment disruption and economic uncertainty. As the public health emergency ends and Medi-Cal eligibility redeterminations resume, policymakers will need to monitor uninsured rates and economic well-being.
Covered California premium tax credits also play a key role, particularly during the pandemic, when they were increased under federal law. An estimated $9 billion in tax credits kept about 345,000 Californians under age 65 out of poverty in 2021. The enhanced premium subsidies are federally funded through 2025 as part of the Inflation Reduction Act. Now that enrollment though Covered California is higher than it has ever been—nearly 2 million Californians purchased plans in 2022—it will be important to track both coverage and poverty rates after these enhanced subsidies expire.
Our goal with this work is to help policymakers better understand the impacts of publicly funded health insurance in supporting economic well-being. Our analysis underscores the Medi-Cal program’s critical contribution to basic household resources and highlights the potential impact of the state’s planned 2024 expansion on poverty rates among immigrants and their families. Ultimately, it yields a new appreciation of the way public spending on health insurance coverage enhances economic well-being across the state.
Topics
Health & Safety NetLearn More

Public Health Insurance in California

Poverty in California

California’s Medi-Cal Expansion Is Lowering Poverty among Undocumented Immigrants

As Medi-Cal Enters a Post-Pandemic Phase, Keeping Eligible Californians Enrolled Is a Key Concern

Video: The Impact of Health Insurance on Poverty in California

As a Pandemic Medi-Cal Policy Ends, Some Californians Will Fall through the Cracks
