

Table of Contents
- Key Takeaways
- Introduction
- State Tax Credits Increasingly Support Low-Income Families
- Credit Claiming Varies across the State
- On Average, CalEITC Dollars Are Distributed Proportionally
- Credits Are Claimed Early in High-Eligibility Communities
- Conclusion
- Notes and References
- Authors and Acknowledgments
- PPIC Board of Directors
- Copyright
Key Takeaways
State-funded tax credits that deliver cash directly to low-income families are a growing part of California’s anti-poverty portfolio. As state policymakers explore ways to refine, increase, and supplement the California Earned Income Tax Credit (CalEITC), it is important to understand the reach of these credits among low-income Californians across the state. Learning more about where and when the CalEITC and similar tax credits are claimed can help improve their reach and efficiency. This report finds that:
- Credit claiming varies across the state. The ratio of claims to likely income-eligible families tends to be lower in the San Joaquin Valley and northern regions, and higher in areas including eastern Los Angeles County, Orange County, and San Diego County. Claims ratios also vary within urban areas. →
- On average, CalEITC dollars are distributed proportionally. On average, the distribution of CalEITC dollars across counties is largely aligned with the distribution of households with incomes under $30,000. This ratio of state CalEITC spending to income-eligible families is closely related to the claims ratio, which suggests that boosting CalEITC claiming might lead to a more proportionate distribution in areas where the ratio of state CalEITC spending to income-eligible families is low. →
- In communities with more CalEITC claims, filers tend to claim credits earlier in the year. Although claims ratios are lower in communities with large numbers of low-income residents, higher shares claim their credits early in these communities. This probably reflects action taken by filers who know they can get a refund. It could also point to successful outreach over the course of the year to low-income residents of wealthier areas; future research could help identify the best practices that facilitate early claiming and drive increases over the course of the year, as well as potential barriers to earlier claiming. →
- Communities with more Latino members tend to claim CalEITC at higher rates. Claims and dollars ratios are higher in communities with more Latino residents, and lower for communities where more residents are white, even after accounting for economic differences. This is the case despite the fact that claims and dollars ratios are lower in communities with more non-citizens, which may be linked to barriers to filing tax returns or limited awareness of credit eligibility among undocumented residents. The state might be able to learn from Latino communities—US-born Latino communities in particular—about best practices for encouraging and facilitating credit claiming.
In the near term, the state has been focusing on engaging Californians who might be eligible for the CalEITC: in 2022, policymakers authorized $20 million for CalEITC outreach over a two-year period. A key challenge is finding ways to reach those whose incomes are so low they are not required to file taxes—particularly given that most filers are eligible for only small credits because they have no qualifying children.
Introduction
Tax credits have long played a part in alleviating poverty in California—which has remained high by national standards in recent years, despite historic reductions during the pandemic driven by an expanded safety net (Shrider and Creamer 2023). Since the 1970s, the federal Earned Income Tax Credit (EITC) has reduced poverty and incentivized work among single mothers while improving health and education outcomes for children (Hoynes 2019; Nichols and Rothstein 2016; Schanzenbach and Strain 2020).
While California’s major safety net programs are largely funded and shaped by the federal government, fully state-designed and -funded tax credits for low-income families are playing a small but growing role in reducing poverty. The California Earned Income Tax Credit (CalEITC), introduced in the 2015 tax year (TY), is at heart designed to supplement the federal EITC, and to be most generous to those whose incomes are too low to receive that credit’s maximum amounts; the recently launched Young Child and Foster Youth Tax Credits (YCTC and FYTC) share some of CalEITC’s basic components.
State lawmakers are particularly concerned with honing the design of state-funded tax credits and ensuring that they reach eligible residents. The IRS estimates that a comparatively low 75 percent of eligible households in California claim the federal EITC (IRS 2022), and take-up of CalEITC is likely lower. In 2018, when CalEITC was smaller, only about half of Californians who were enrolled in the state’s wide-reaching food assistance program and estimated to be CalEITC-eligible claimed the credit (Iselin et al. 2022).
Perhaps the most impactful—and challenging—step the state can take to improve credit take-up rates is to increase tax filing among people who are not required to complete returns because their incomes are so low. Given that credit amounts can be quite small, some eligible filers might not want to take on the challenge of filing a tax return or the cost of seeking assistance with filing. In 2018, two-thirds of Californians who were receiving food assistance and were probably eligible for CalEITC but did not claim the credit did not file tax returns (Iselin et al. 2022).
Little is known about how CalEITC claiming varies across the state, and whether it disrupts or reinforces California’s long-standing racial/ethnic income disparities—to the extent that a relatively small credit might do so. This report explores variation in CalEITC claiming across the state, and based on community racial/ethnic compositions, by leveraging data on claims in small geographical areas. And, since residents who do not owe taxes for the previous year can file returns through October, this research also examines claims over the course of the year, to learn more about the possible impact of ongoing outreach to eligible filers. A better understanding of the factors associated with credit claiming can help the state increase participation.
State Tax Credits Increasingly Support Low-Income Families
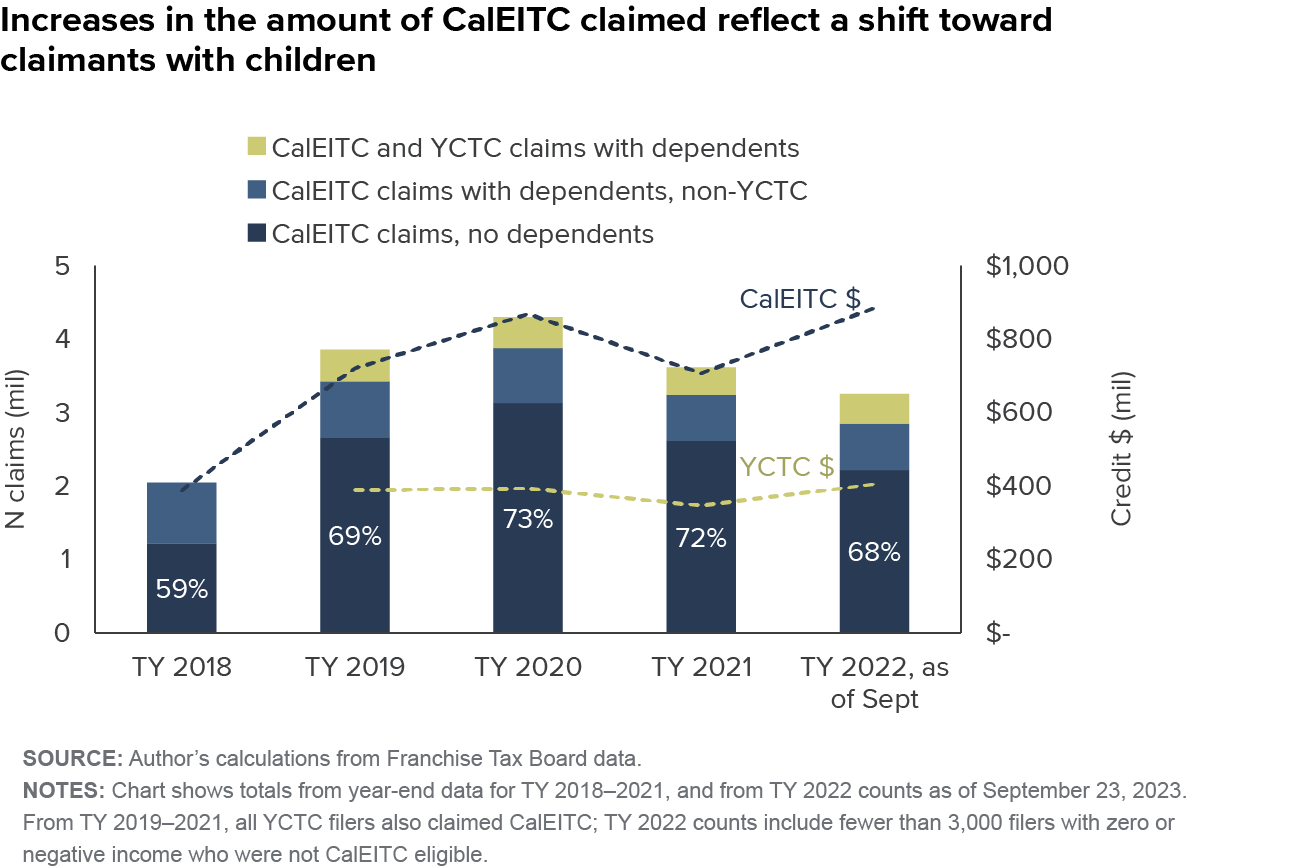
More than 3.6 million California households claimed the CalEITC for TY 2021; about 10 percent of these households (or nearly 400,000 tax filers) also claimed the YCTC. Eligible tax filers receive credits once a year, minus any income tax owed—in contrast to other safety net programs, which provide benefits to families that enroll when they are experiencing income declines. In total, filers claimed $1.05 billion from CalEITC and YCTC for TY 2021; this is a fraction of the federal EITC dollars Californians have claimed (more than $6 billion each year since TY 2019), even though more filers claimed the state credit.
The CalEITC was initially available only to filers who were eligible for the federal EITC, and continues to be tied to that credit: lawmakers set the maximum state credit as a percentage of the maximum federal credit each year (CA Rev and Tax Code § 17052). Both credits are targeted to filers with low incomes, although CalEITC aims to reach an exceptionally low-income group. For TY 2022, an eligible single filer with one qualifying child could claim the maximum CalEITC with an adjusted gross income (AGI) of about $6,300, and the maximum federal credit with an AGI between $11,800 and $21,600 (Table 1). Single filers without dependents are not required to file state returns unless their incomes are above about $21,000; the filing threshold is higher for seniors, married people, and those with dependents. For many CalEITC-eligible residents, the tax credit might not be worth the time and effort required to file a return, and/or the expense of seeking filing assistance.
CalEITC is smaller than the federal EITC, and is targeted to Californians with even lower incomes

SOURCES: Author’s calculations from Franchise Tax Board data, FTB Eligibility and credit information, IRS Statistics for Tax Returns with the Earned Income Tax Credit (EITC), Center on Budget and Policy Priorities, Policy Basics: The Earned Income Tax Credit.
NOTES: * indicates value or range varies by number of children. () indicates value not published. Some FYTC values marked N/A, since the first year of claiming is in progress at the time of this report. Income eligibility describes adjusted gross income (AGI)—income that is taxable, after deductions— for single filers; values differ slightly for filers with married filing joint status. Values shown for TY 2022, except for average amounts and number and share of claimants shown for TY 2021. In TY 2021, federal EITC credit amounts and the maximum eligible income were temporarily increased for adults without qualifying children. Some filers with negative net incomes can also claim YCTC. For additional information on CalEITC filing status and number of dependents, see Technical Appendix Table B1.
Between TY 2015 and TY 2021, lawmakers repeatedly expanded the CalEITC in ways that in some cases further differentiated it from the federal credit: they increased the maximum AGI for eligibility up to $30,000, made it possible to claim the credit based on self-employment income, expanded age eligibility to workers ages 18 and over, and made filers with Individual Taxpayer Identification Numbers (ITINs; holders are primarily undocumented immigrants) eligible. Together, these factors could explain why the CalEITC is now more commonly claimed than the federal EITC.
The YCTC, introduced for TY 2019, provides up to $1,000 for CalEITC-eligible filers with qualifying children under age 6. As of TY 2022 (the year for which claims are currently being filed, at the time of this analysis), filers with no earned income can claim YCTC at its full value; less than 1 percent of YCTC claimants to date fall into this group. The FYTC, new in TY 2022, also offers about $1,000 to young adults who are former foster youth and have at least $1 in earned income. YCTC and FYTC credits decrease for filers with earnings above $25,000 (see Technical Appendix Figure B1).
Like the federal EITC, CalEITC amounts are higher for filers with qualifying children. The maximum credit in TY 2022 was $3,417, available to filers with three or more children, while filers without children could claim up to $275. On average, CalEITC claimants received $195 in CalEITC for TY 2021, and three-quarters received less than $200. This reflects the fact that 73 percent of claimants are adults without qualifying children, and indicates how few claimants are eligible for the largest credit amounts.
The high share of claimants without children may be surprising, given that childless adults overall stand to claim the smallest credits (Table 1), but it is largely in keeping with the demographics of tax units overall. Estimates using California Poverty Measure data indicate that 69 percent of all tax units include no EITC-qualifying children, and the share is similar among those with state AGIs under $30,000 (Kimberlin et al. 2022).
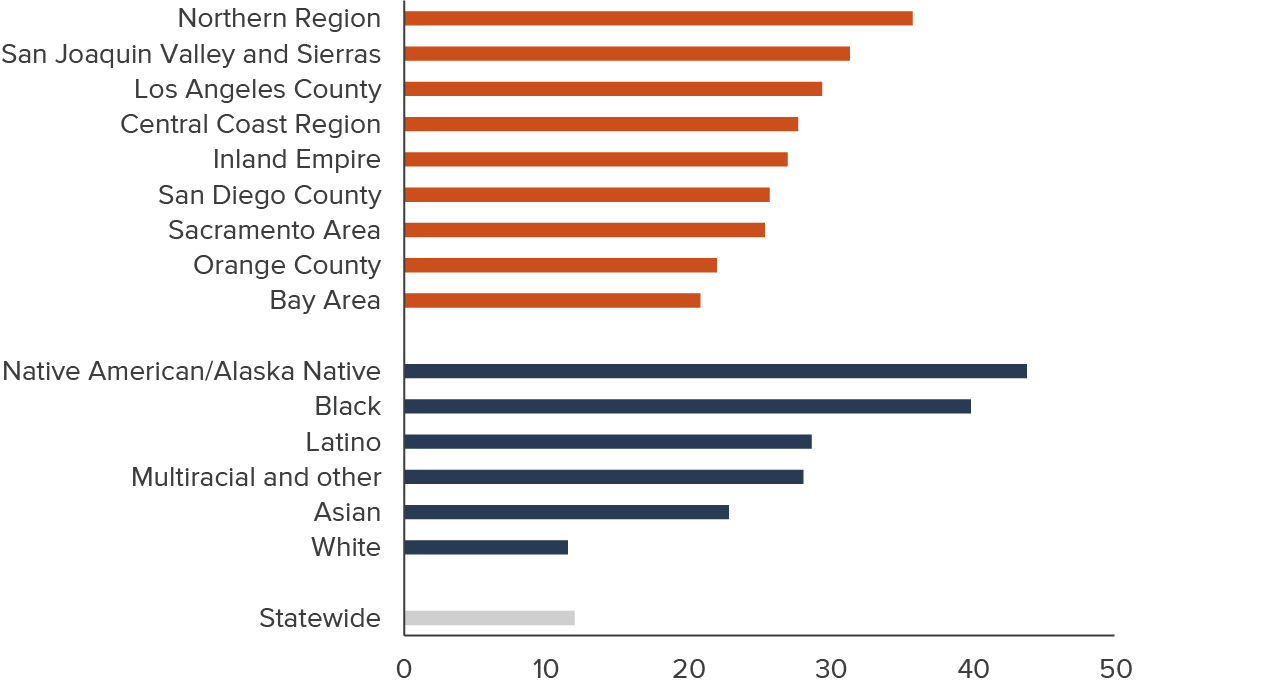
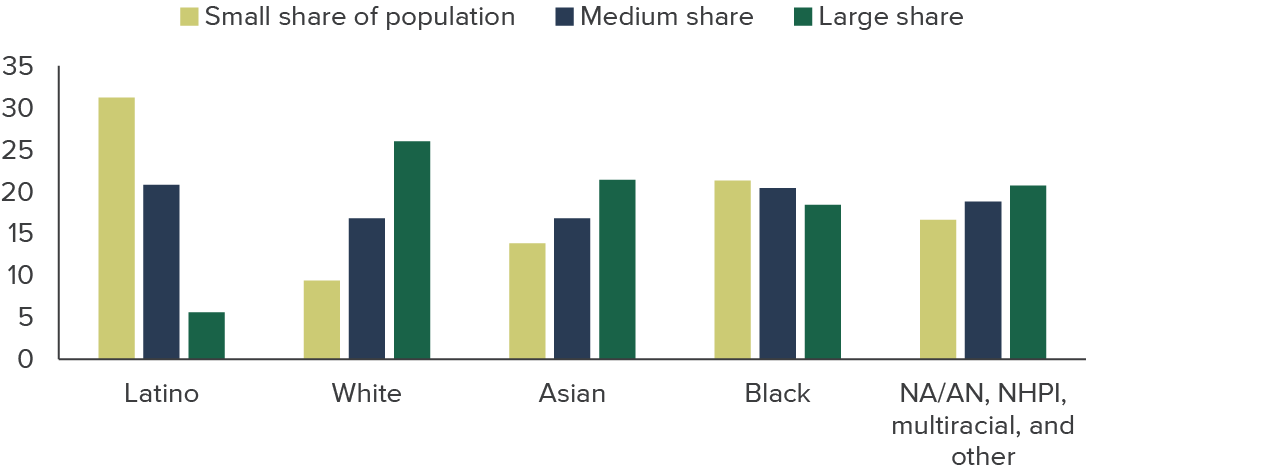
Some demographic groups are substantially more likely than others to be eligible for CalEITC, given regional differences in incomes and costs of living, and pervasive income disparities along racial/ethnic lines (Figure 1). Latino, Black, and Native American/Alaska Native (NA/AN) Californians, for example, are more likely than others to be eligible for CalEITC because they make up a disproportionately large share of the state’s low-income population. Additionally, YCTC eligibility reflects demographic differences in family structure: 17 percent of Latino families include children under 6, compared to about 10 percent of Black, Asian, and other families of color, and 8 percent of white families.
Racial/ethnic income disparities and geographic differences in incomes are drivers of wide variation in CalEITC eligibility
% of families with total income under $30,000
SOURCE: Author’s calculations from IPUMS-ACS data (Ruggles et al. 2021).
NOTE: Total income includes wages/salaries, self-employment, interest and income from estates and trusts, social security, retirement and pensions, public assistance, and SSI and other disability income.
Legislators continue to propose changes to tax credits for low-income Californians, including increasing the minimum value of the CalEITC, extending YCTC eligibility to families with older children, and issuing credits in periodic payments rather than lump sums. However, lawmakers need to weigh these changes against other priorities, especially when the state is facing budget shortfalls. In this context, it is worth noting that take-up has likely been low in previous years, and spending would be substantially higher for the current versions of the CalEITC and YCTC if all eligible Californians claimed the credits.
Credit Claiming Varies across the State
Learning more about geographical variation in CalEITC claims can shed light on the reach of the credit in more ways than one. In this section we compare the number of claims in a community—or zip code—to the number of families in that community with incomes under $30,000, the maximum adjusted income at which filers can claim the credit. We call this the “claims ratio.” (See Technical Appendix A for details of data and methodology.)
The claims ratio gives us a way to understand how usage varies across communities but cannot pinpoint the share of eligible tax filers that claim the credit (the “take-up rate”), in part because even though survey data allow us to count the number of families in a community, not all members of a family necessarily file taxes together. (For example, adult children living at home would not file taxes with their parents.) Moreover, income summarized in aggregated survey data differs somewhat from income counted for determining CalEITC eligibility, and does not reflect tax deductions.
For these reasons, we should not expect to see a claims ratio close to one to one. If all eligible tax filers were equally likely to claim CalEITC regardless of where they lived and the composition of their community, the claims ratio would be similar everywhere and not associated with local demographic characteristics. Differences that are associated with local demographic characteristics suggest that demographic composition is associated with community infrastructure or norms—such as a high level of tax credit awareness, or easily accessible tax preparation assistance.
In the average California zip code, there were 34 CalEITC claims for every 10 families with income under $30,000 in TY 2021. In zip codes with low ratios (at the 25th percentile), there were 26 claims, and in zip codes with higher ratios (at the 75th percentile), there were 40 claims for every 10 families with incomes under $30,000. That the claims ratio is not close to one to one reflects how it differs from the share of eligible tax units that claim CalEITC, underscoring in particular that one family can have multiple tax returns if members file separately.
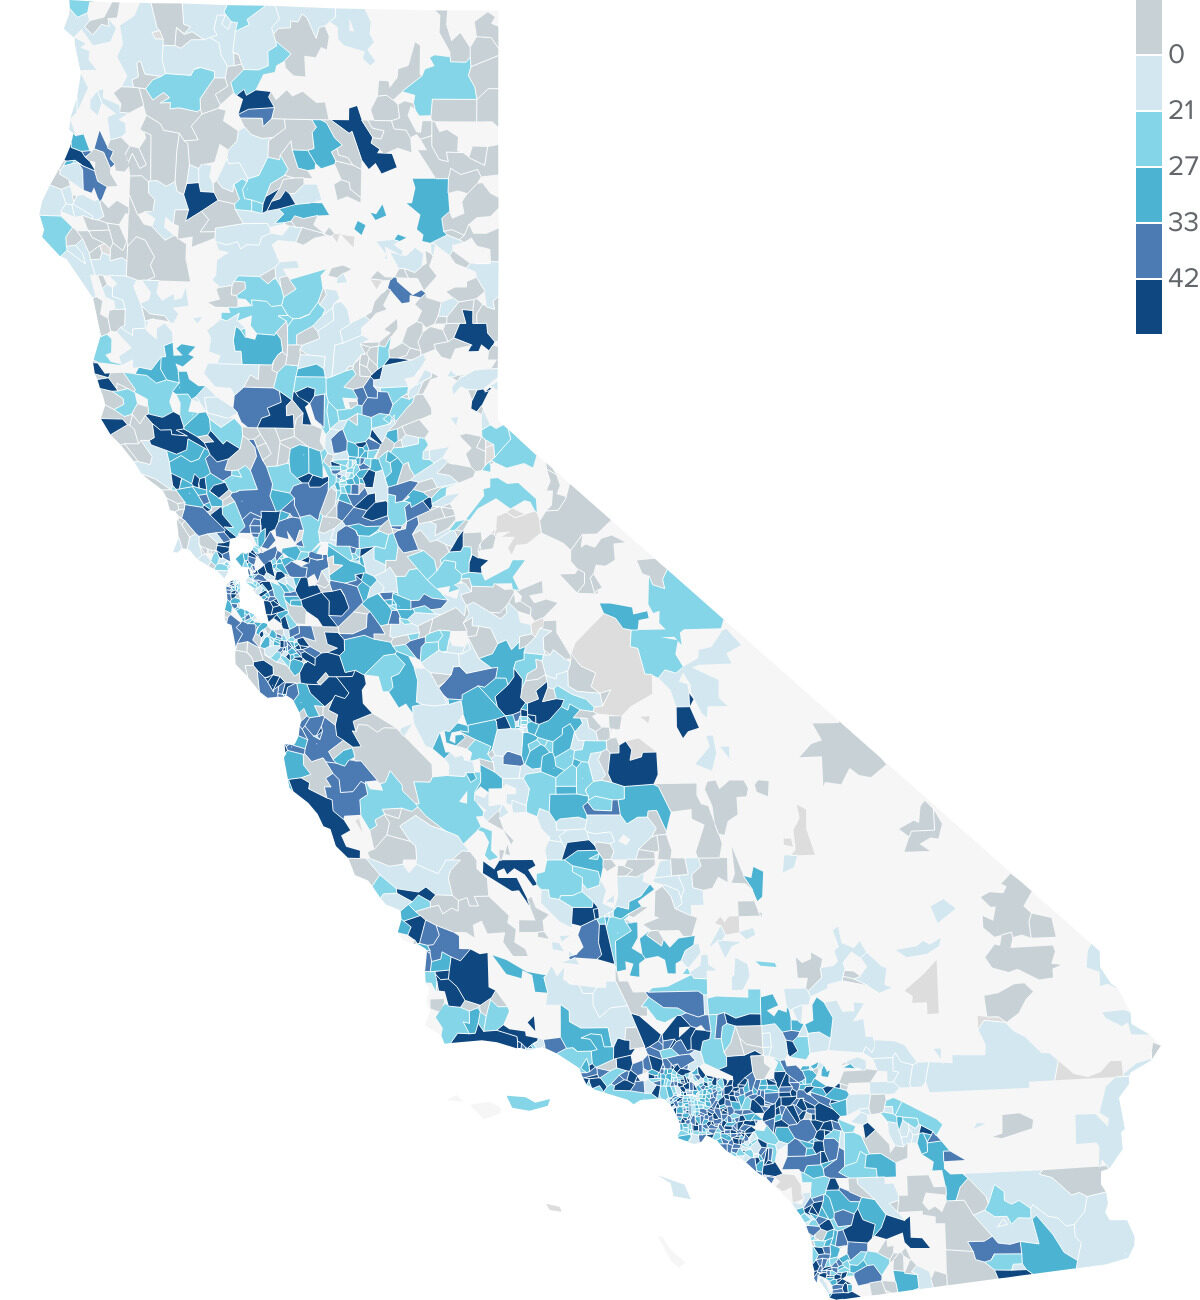
Claims ratios varied across the state (Figure 2). Ratios were lower in most zip codes in the San Joaquin Valley and the state’s northern region, while those in areas including eastern Los Angeles County, Orange County, and San Diego County saw higher ratios. Ratios also varied within metro areas. They were below average in Sacramento’s core urban area, while its suburban communities saw higher claiming. In the San Francisco Bay Area, claims ratios were high in cities like San Mateo and Hayward, while other cities, including Palo Alto and parts of Oakland, saw low ratios. Although ratios can be low in both high- and low-income zip codes, a higher federal poverty rate is associated with a lower claims ratio, holding other factors constant (see Technical Appendix Tables C1 and C1B).
The ratio of CalEITC claims to potentially eligible families varies across the state
Number of claims for every 10 families with incomes under $30,000
Claims Ratios Are Higher in Communities with More Latino Residents
A simple comparison of claims ratios based on racial/ethnic composition shows that in zip codes with large shares (at or above the 75th percentile statewide) of Latino, Asian, Black, or multiracial residents, ratios are comparable to the statewide average. In zip codes with large shares of white residents, by contrast, ratios are 4 percent below average (see Technical Appendix Table B4). (For context, a zip code where the share of white residents is higher than in 75 percent of other zip codes would be at least 53 percent white. See Technical Appendix Table B2 for all groups.)
When we account for factors that determine credit eligibility and amounts, such as family size and income, zip codes with higher shares of Latino residents stand out as having higher ratios of claims to families with incomes under $30,000, while ratios are lower in zip codes with more white residents (see Technical Appendix Table C1). It is worth noting in this context that most people in California are either white or Latino, so in most parts of the state, one or the other is the largest racial/ethnic group in any given zip code (see Technical Appendix Figure B4).
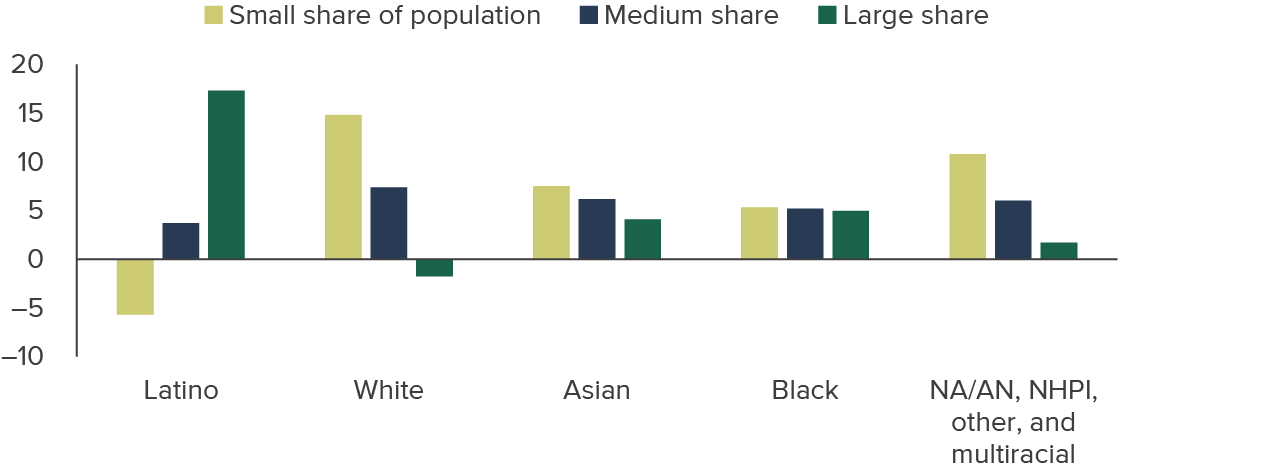
Figure 3 shows the impact of community-level racial/ethnic differences on claims ratios. For example, the claims ratio in a zip code with a small white population (25th percentile) would be 15 percent higher than in the average zip code, while the ratio would be about 6 percent below average in a zip code with a small Latino population. By contrast, ratios are above average in zip codes with large Latino population shares (75th percentile). And finally, in zip codes with median shares (50th percentile) of each group, claims ratios are near average. The claims ratio does not vary as much for low or high shares of Black, Asian, or other races/ethnicities, mostly because these groups typically make up small shares of zip code populations (see Technical Appendix Table B2).
Claims ratios tend to be above average when Latino populations are relatively large and white populations relatively small
% difference from statewide average
SOURCE: Author’s analysis of Franchise Tax Board (2022) and ACS 5-Year Summary File data (2017–21).
NOTE: Chart shows percent difference in predicted claims ratio at population share from statewide average, holding all other variables at their median values. “Small” describes 25th percentile population share, “medium” describes 50th percentile, and “large” describes 75th percentile. See Technical Appendix Table C3 for complete output.
We might expect claims ratios for Latino communities to be much lower once we account for factors such as the shares of non-citizen residents and the share in poverty—both of which are associated with lower ratios (Technical Appendix Tables C1 and C3) and strongly correlated with more residents being Latino. And yet, this is not the case. Notably, this analysis covers one of the first years in which undocumented tax filers could claim CalEITC and YCTC. It could be that increased awareness of credit eligibility among undocumented immigrants weakens the correlation between a high share of noncitizen residents and a low claims ratio.
This evidence suggests that the CalEITC has not worsened racial/ethnic income disparities. Given that TY 2021 claims ratios were connected to community racial/ethnic demographics but were higher only in predominantly Latino communities, the credit seems to have neither reinforced nor fully disrupted existing dynamics.
On Average, CalEITC Dollars Are Distributed Proportionally
We also want to learn more about the distribution of CalEITC dollars across the state. Given the close relationship between family income and eligibility, a proportionate distribution of CalEITC money would mean that about 1 percent of CalEITC dollars would go to a zip code with 1 percent of the state’s families with incomes under $30,000 each year (holding constant some of the factors that determine the dollar amounts filers can claim). Throughout this section, we will call this the “dollars ratio.”
While the claims ratio only allows us to look at the scale of differences between zip codes, we can compare dollars ratios to an ideal, or proportionate, outcome. And the dollars ratio is more heavily influenced than the claims ratio by the number of local households that include children, since eligible filers with qualifying children can claim larger credits. However, like the claims ratio, the dollars ratio can have multiple interpretations. For example, a low dollars ratio in a given community might indicate that relatively few eligible residents are claiming CalEITC. Or, it might indicate that some filers are not claiming the highest possible credits, due to mistakes on tax returns or filing status choices.
CalEITC dollars are distributed across counties largely in the same way the state’s families with incomes under $30,000 are distributed (Figure 4).
Shares of CalEITC dollars claimed align closely with where families with incomes under $30,000 live
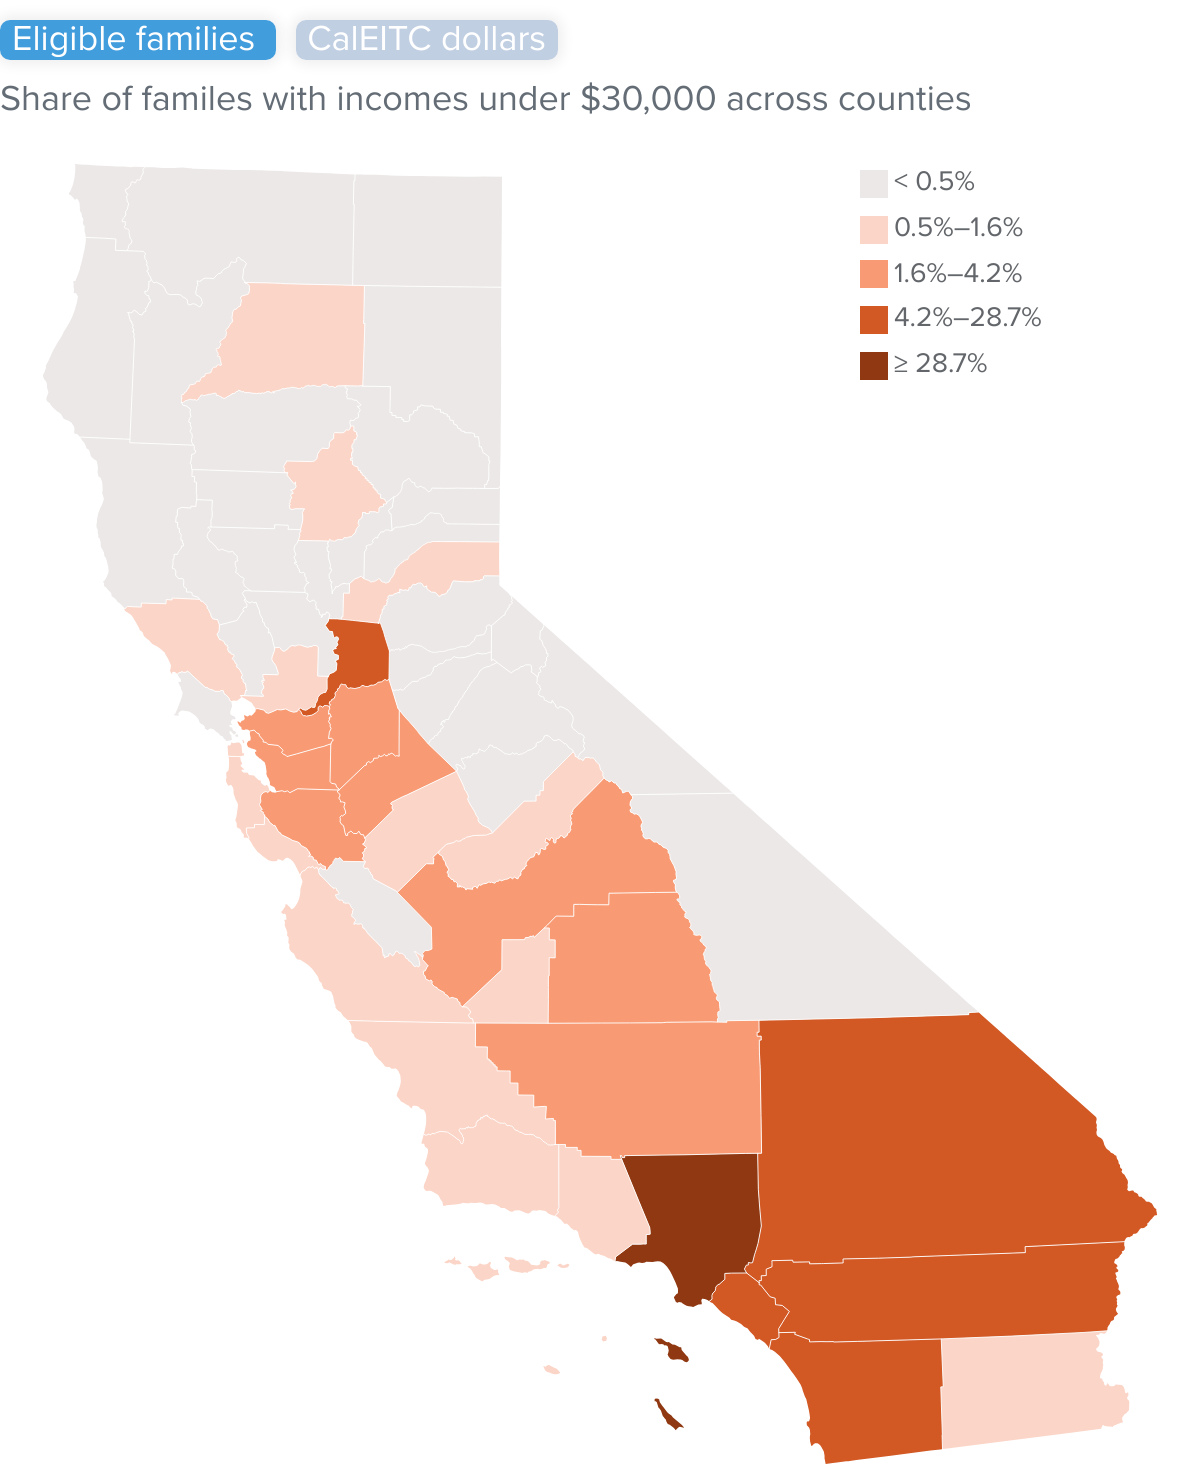
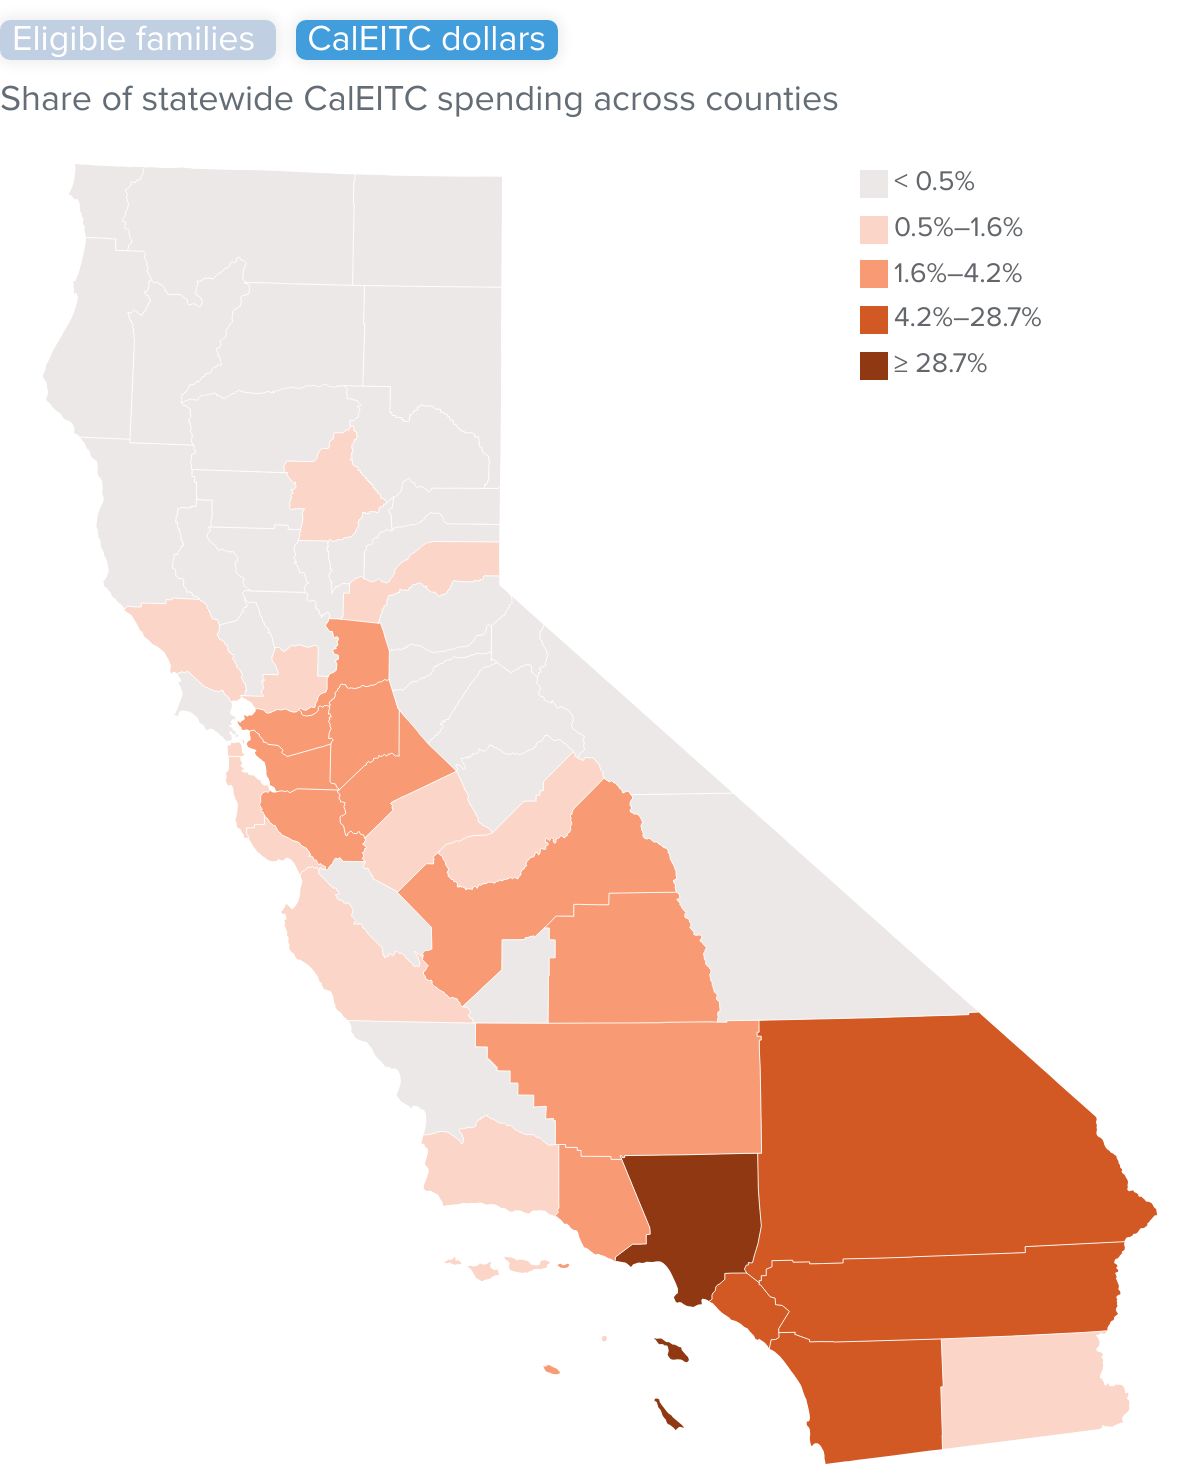
SOURCES: Author’s calculations from Franchise Tax Board (2022) and ACS 5-year Summary File data (2017–21).
NOTES: Maps show county-level shares of the state’s families with total incomes under $30,000 and county-level total shares of statewide CalEITC dollars.
At the local, zip code level, we see more differences. However, since CalEITC is designed to be more generous to families with children, it is not surprising that dollars ratios are higher in zip codes where more families have children—such as in communities that are predominantly Latino, like those in the Inland Empire and San Joaquin Valley/Sierras regions. According to 2021 ACS data, Latino families are substantially more likely to include children than families of other races/ethnicities; moreover, Latino families have more children on average than other families with children. (See Technical Appendix Figure B5 for a map of unadjusted dollars ratios, and Table B4 for unadjusted dollars ratios by zip code race/ethnic demographics.)
After we adjust for demographic and income differences, dollars ratios are closer to one to one. However, they remain positively associated with the share of the local population that is Latino, and decrease as the shares of other racial/ethnic groups increase (Figure 5). In areas with a relatively large share of Latino residents (at the 75th percentile), dollars ratios are about 1.2 to 1, while ratios in areas with large white populations are below one to one (0.9 to 1) even after adjusting for family composition. Like claims ratios, dollars ratios are linked to local demographic differences: they do not diverge greatly from a one-to-one ratio unless racial/ethnic groups make up particularly large or small shares of the population.
Dollars ratios are above one to one in communities where a relatively large share of residents are Latino
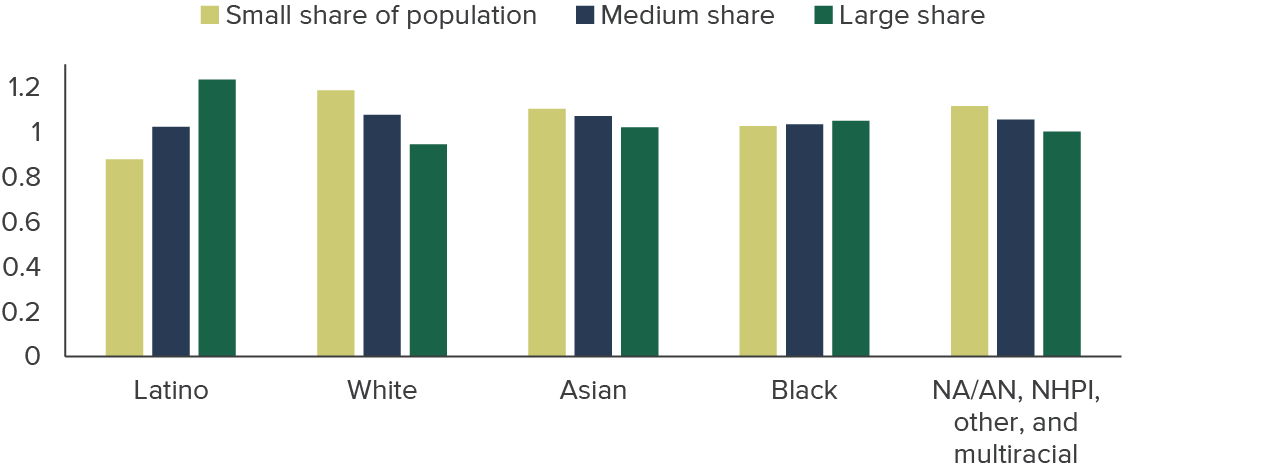
SOURCE: Author’s analysis of Franchise Tax Board (2022) and ACS 5-Year Summary File data (2017–21).
NOTES: Charts shows predicted dollars ratio at population share for each group, holding all other variables at their median values. “Small” describes 25th percentile population share, “medium” describes 50th percentile, and “large” describes 75th percentile. See Technical Appendix Tables C1 and C4 for complete output.
The strong correlation between dollars and claims ratios indicates that low dollars ratios are due to fewer eligible residents filing and claiming CalEITC, rather than to systematic differences in maximizing CalEITC amounts. This could mean that increasing claims would bring dollars ratios closer to one to one, but this might not be the case if these additional claims came primarily from filers without children, since they receive only small credits.
Credits Are Claimed Early in High-Eligibility Communities
A better understanding of when credits are claimed can help the state and other interested parties refine their outreach efforts by identifying differences between late claimants and those who claim credits as soon as possible. The latter group reflects either prior positive experience with the credit or a response to pre–tax season outreach. This section tracks the timing of CalEITC claims and CalEITC and YCTC dollar amounts throughout the year.
Although the vast majority of CalEITC and YCTC claims are made by tax day in mid-April, people who do not owe tax money (and most who are eligible for CalEITC do not) can file and claim credits through October. Filers can also amend prior-year returns to claim credit retroactively. Outreach can thus be impactful well beyond April to encourage credit claiming among those who were either unaware of the benefits, not intending to file a return, or found the process too burdensome to complete by tax day.
Overall, CalEITC claimants file early, particularly if they are also claiming YCTC. In 2022, 28 percent of yearly CalEITC and 42 percent of YCTC claims had already been processed by February 28. By April 30, these shares had balanced out at 85 and 87 percent, respectively (see Technical Appendix Figure B2).
Zip codes with the highest numbers of claims overall—overwhelmingly, those in the Central Valley, rural northern California, and Inland Empire—also tend to have the highest shares of their claims made by the end of February (although this share remains low: as shown in Figure 6, the 20 percent of zip codes with the most early claiming are those with between about 30 and 60 percent of claims). This suggests that outreach later in and after tax season might be having the biggest relative impacts on communities with fewer claims overall, such as wealthy parts of the Bay Area, Los Angeles, and San Diego. Indeed, zip codes with above-average poverty rates according to the official poverty measure filed 31 percent of their CalEITC claims early, compared to 23 percent in zip codes with below-average poverty rates.
In many inland zip codes, more than a third of CalEITC claims were made early
CalEITC claims made by February 28, 2022, by quintile

Between February and the end of the year, the total number of claims and credit dollars more than doubled, with the bulk of the increase by the end of April. Throughout the year, dollars were distributed on average at a one-to-one ratio, as a function of disproportionately high and low ratios converging. Central Valley zip codes in particular saw their share of dollars relative to their share of the state’s poverty population decrease, while shares of dollars increased in the wealthier parts of the Bay Area, Los Angeles, and San Diego, as claims continued to grow.
CalEITC claims tend to be filed earlier in zip codes where more of the population is Latino, Native American/Alaska Native, Native Hawaiian or Pacific Islander, multiracial, or other race (holding constant factors that determine local levels of credit eligibility). In the average zip code, 26.5 percent of CalEITC claims would have been made by the end of February; 28.4 percent would have been made in a zip code with a relatively large Latino population, compared to 24.8 percent in a zip code with a relatively large white population (see Technical Appendix Table C2). As a result, the dollars ratio would increase 26 percent in a zip code with a large share of white residents after February, compared to 6 percent in a largely Latino zip code (Figure 7).
Zip codes where relatively large shares of residents are white see larger increases in dollars ratios after February
% change in dollars ratio
SOURCE: Author’s analysis of Franchise Tax Board (2022) and ACS 5-Year Summary File (2017–21) data.
NOTE: Charts shows predicted change in dollars ratio from February to the end of the tax filing year at population share, holding all other variables at their median values. See Technical Appendix Table C7 for complete output.
Communities in which more families have children and/or low incomes are also more likely to see higher shares of credit dollars claimed early (see Technical Appendix Table C1). Inasmuch as these characteristics determine both eligibility and credit amounts, this suggests that among those who do file, the ones who stand to gain most tend to claim early. Yet claims ratios are lower in zip codes where more families have low incomes; early claiming by some clearly does not necessarily result in higher take-up overall.
Notably, although the share of residents who are noncitizens is associated with lower claims ratios, lower dollars ratios, and lower levels of early claiming, it is positively associated with increases in the dollars ratio over the course of the year. This suggests that while there is work to be done to improve take-up in immigrant communities, organizations might be having some success over the course of the year in reaching newly eligible ITIN filers and communities whose primary languages are not English. Of course, the increasing dollars ratios might also underscore that ITIN and other immigrant filers may spend longer without valuable resources because of the time required to collect necessary tax documentation or become more comfortable with claiming government resources. Still, identifying the trend offers an opportunity to pinpoint successful means of overcoming these sticking points.
Conclusion
This analysis suggests that, overall, the distribution of CalEITC tax credits aligns well with low-income communities in the state. For organizations and agencies working to improve the credit’s reach, mapping claims relative to neighborhoods where low-income families live can be a valuable tool for identifying places where additional outreach or support might be warranted. Understanding whether YCTC claimants follow substantially different trends is beyond the scope of this analysis and would require detailed local information from FTB specific to YCTC claiming.
We find evidence that CalEITC generally functions in a manner consistent with its design. Since non-white Californians are more likely to have low incomes, we would expect the CalEITC to help narrow racial/ethnic income disparities by boosting these low incomes. Claims and dollars ratios are lower in zip codes where more residents are white, and higher in those where more residents are Latino, indicating that CalEITC resources are not disproportionately directed to low-income white communities.
Given that credit claiming does vary across groups, however, and that ongoing low estimated take-up of the federal EITC continues to point to low take-up of the CalEITC, California has room to improve. This analysis points to several actions that could help boost claims among eligible Californians.
Learning from Latino communities. Given the higher ratios in predominantly Latino zip codes, one fruitful avenue for improving take-up statewide could involve learning from Latino communities about best practices for encouraging and facilitating credit claiming. Research on tax filing practices in Latino communities is limited, although there is some evidence that historically, Latino tax filers nationwide have been more likely than the average filer to pay for tax preparation services (Bartmann 2015; Maag 2005)—and this, in turn, could maximize their credit claiming. Future research should explore whether this historical trend has persisted and whether it is connected to higher CalEITC claims—and, if so, what elements might be replicable. For example, given some findings in qualitative research that low-income filers prefer paid assistance, does free, volunteer filing assistance offer comparable services (Halpern-Meekin et al. 2015)? In general, filers who use paid preparers tend to do so because they think it will benefit them, be more accurate or more convenient, or are daunted by the complexity of taxes (Book 2009). IRS counts indicate that a majority of California filers already use paid preparers, as do nearly 60 percent of CalEITC claimants (see Technical Appendix Table B5).
Reducing barriers for eligible noncitizens. Encouraging newly CalEITC-eligible undocumented residents to file with ITINs might help address lags in claims ratios in communities with more non-citizen residents, along with efforts to smooth the process of getting an ITIN. Efforts to raise awareness and facilitate claiming among undocumented residents might already be having an impact, since the dollars ratio in these communities increases relatively more over the course of the year. A next step for those seeking to increase take-up will be to assess which efforts are responsible for these changes over the course of the year, and whether they can be scaled up—or whether the changes reflect delays in filing or processing that could be reduced.
Conducting outreach throughout the year and identifying reasons for delays. Overall, communities with more residents who are likely to be CalEITC eligible tend to claim the credit earlier in the year than others. Those who know they are eligible for a meaningful credit based on outreach or prior experience certainly have an incentive to file early. This would be consistent with research finding that in California, EITC claimants file returns earlier than others (Davis and White 2019), and studies that show earlier filing among filers nationwide who expect larger refunds and/or are experiencing immediate financial hardship (Maag 2016; Kondratjeva et al. 2022). However, our finding that claims increase over the course of the year among low-income residents of wealthier areas indicates that current outreach aimed at boosting claims may be having a large relative impact in these areas. Better understanding the role of outreach in these communities could provide insight into mechanisms for improving take-up.
Reducing barriers to claiming CalEITC for non-filers. A key challenge for the state is to find ways to help eligible Californians with very low incomes claim CalEITC through the tax system despite their not being required to file tax returns. “Light touch” encouragements like mailings and text messages have not been found to increase state tax filing or EITC claims (Linos et al. 2022). Moving forward, effective methods could involve removing barriers to filing—for example, in 2023, legislation aimed at bypassing the filing process entirely by creating a form that could be used to claim CalEITC, YCTC, and FYTC, although this was vetoed (FTB 2023a; FTB 2023b)—or increasing credit values, although this could raise the cost of the credits substantially.
California already offers a free online tax filing portal—CalFile—for many residents who have filed federal returns. The FTB recently explored a range of other options to make it easier to claim CalEITC by streamlining tax filing, including prepopulating tax returns, simplifying the filing process, and expanding services in languages other than English—many of which it deemed not feasible in the near term (FTB 2022a). At the federal level, the IRS is exploring building its own free, online filing tool, after years of offering free options for low-income filers online through paid tax preparation companies and in-person through a small network of volunteer assistance sites (IRS 2023b; Horsley 2023). A federal tool could potentially be a gateway to prepopulating returns with information from employers, or synchronizing state and federal filing processes, both of which could reduce the number of steps required to complete a return.
Increasing credit amounts for filers without children. The vast majority of residents eligible for the CalEITC do not have qualifying children. The small dollar amounts that CalEITC provides to these filers may make it more likely that the time and potential expense necessary to file a return outweigh the benefits from claiming the credit. So far, lawmakers have focused on increasing benefits for families with children, with the major addition of the YCTC; this may also be increasing the share of eligible families with children who claim CalEITC. Moving forward, the state may want to consider increasing credit amounts for filers without children. This could boost credit claiming and boost resources for a group that generally receives very little safety net assistance.
In the near term, the state has been focusing on engaging Californians who might be eligible for the CalEITC: in 2022, policymakers authorized $20 million for CalEITC outreach over a two-year period (FTB 2022b). One result is a campaign by FTB to mail informational materials to likely eligible non-filers using FTB data on earnings and tax filing history (FTB 2023a). Meanwhile, legislators continue to consider changes to tax credits for low-income families that may alter incentives to file a return. Tracking changes in CalEITC claiming as ITIN filers ramp up claims and as YCTC claims increase among those with zero income could prove informative.
Topics
Health & Safety NetLearn More

California’s Cash-Based Safety Net

Post Title

Are Eligible Undocumented Immigrants Claiming the CalEITC and Young Child Tax Credit?
Video: Understanding the Reach of the California Earned Income Tax Credit
Post Title
