

Summary
Over the past 20 years, in-state tuition at both the University of California (UC) and the California State University (CSU) has more than tripled. These tuition increases have led many to believe that spending in the state’s public higher education systems is out of control. However, a closer look reveals that institutional expenditures in the two systems-including faculty salaries and benefits, the largest budget category-have not increased significantly. Our evaluation of both revenues and expenditures shows that recent tuition increases have been driven by dramatic reductions in state subsidies to UC and CSU. In the past, General Fund contributions covered the majority of educational costs. Today, students (often with help from federal, state, institutional, and private grants) pay most of these costs through tuition and associated fees. Better budget data could help policymakers monitor costs and align higher education funding with state goals. But it is clear that tuition at California’s public universities has risen much more rapidly than the cost of providing higher education.
Are Costs Rising?
Rapid increases in tuition1 at California’s public universities have raised questions about the cost of higher education. The general public, lawmakers, and the governor are clearly concerned that the tripling of tuition over the past 20 years reflects increases in the cost of providing higher education at the UC and CSU systems. According to a December 2012 PPIC Statewide Survey, 65 percent of Californians believe that higher education affordability is a big problem in the state. To be sure, many students who could not afford to pay the full listed tuition receive grants and scholarships-this is the focus of a companion report, Higher Education in California: Student Costs. But the governor’s 2013-14 higher education budget froze tuition for CSU and UC and noted that “student tuition should not be the go-to budget balancer … everyone must do their part: taxpayers, students, and university officials need to find solutions other than tuition increases to balance their budgets.” The budget proposal also noted that “student aid doesn-t fix the problem: it helps individual students but masks the underlying problem of higher education costs that are rising too fast.” At a recent meeting of the University California Board of Regents the governor called for spending efficiencies that could prevent tuition hikes.2
To understand why tuition has increased so dramatically, it is necessary to evaluate trends in both revenues and expenditures at UC and CSU. In this report, we examine the extent to which increases in tuition have been driven by increases in the costs of providing higher education versus reductions in direct state support. Our focus is on revenues and expenditures related to educating undergraduates, not areas such as hospitals and research. Costs include faculty and staff compensation, institutional aid (grants and scholarships) provided to students, support services, and other operating expenses such as utilities. Like public universities throughout the country, UC and CSU cannot cover all their costs with the revenue generated by tuition. In other words, students do not pay the full cost of enrollment and instruction-even if they pay the full in-state tuition.3 State subsidies provided directly to UC and CSU through General Fund allocations make up most of the difference between costs incurred by the universities and the revenue they generate through the tuition charged to students.4
Revenues
The vast majority of funds available to the UC and CSU systems to cover the costs of educating students come from state General Fund support and net tuition (that is, the total amount of tuition paid minus the cost of institutional grants). Over the past ten years, state allocations have declined and revenue from tuition has increased.
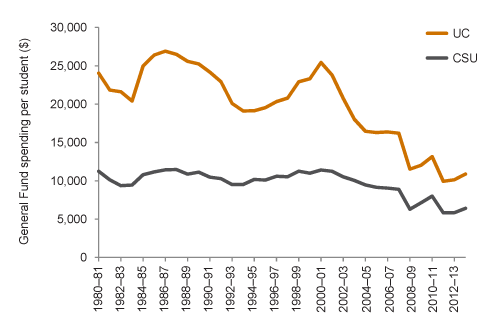
Between 2007-08 and 2012-13, state appropriations to UC and CSU fell by $2.0 billion (from $6.3 billion to $4.3 billion in 2013-14 dollars) or more than 30 percent, even as enrollment increased. On a per-student (full-time equivalent, or FTE) basis and adjusted for inflation, the declines have been even more dramatic. General Fund subsidies per student fell by more than 50 percent at UC and CSU. Inflation adjusted per student General Fund revenues fell from more than $16,000 in 2007-08 to about $10,000 in 2011-12 at UC and from almost $9,000 to less than $6,000 at CSU during the same period (Figure 1).5 Recent increases in General Fund allocations to 2013-14 are relatively small (less than 10% per student), and state support for UC and CSU students remains near the lowest level in more than three decades.6
Figure 1. State support for UC and CSU has declined dramatically
Reduced support from the state has left UC and CSU with two options: finding additional funding and cutting expenses. UC and CSU have cut some expenses by restricting the growth of enrollment, among other measures.7 However, given the magnitude of the reductions in state support, UC and CSU have relied primarily on tuition increases to help make up the difference.
UC and CSU have used some tuition revenue increases for institutional grants (scholarships) to aid lower-income students. Even so, per-student net tuition (full tuition net of institutional grants) revenue more than doubled between 2002 and 2012 (Figure 2).8
Figure 2. Per student tuition revenue more than doubled at both UC and CSU from 2002 to 2012
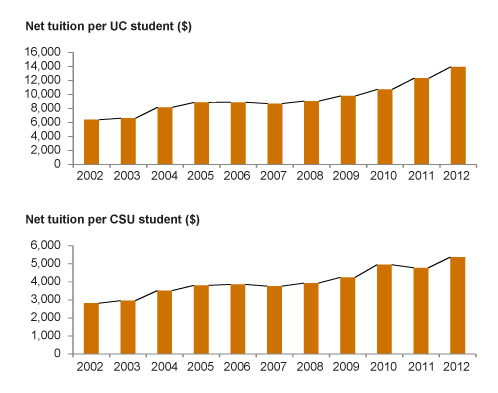
SOURCE: Integrated Postsecondary Education Data System (IPEDS).
NOTES: Inflation-adjusted in 2012 dollars. For UC, does not include Hastings or UCSF, which provide only graduate education, but does include out-of-state and graduate students at other campuses. For CSU, includes out-of-state and graduate students.
Inflation-adjusted revenues per student are slightly lower now and the source of those revenues has shifted dramatically. In 2002-03, state General Fund allocations made up 75 percent of all core revenues at UC and 79 percent at CSU; by 2012-13 the state share had fallen to 45 percent at UC and 50 percent at CSU.9
Between 2002 and 2012 the decline in state General Fund support has been mostly but not completely offset by increases in revenue from tuition. In other words, the primary core funds available to UC and CSU for providing instruction have declined slightly.
Expenditures
We have seen that UC and CSU increased tuition to make up for a loss of revenue from the state, but it may also be true that the costs of providing undergraduate education have changed. It is worth considering whether, given slightly declining revenues per student, public universities have shifted their expenditures among or within budget areas.
We begin by looking at whether the overall distribution of spending in the UC and CSU systems has changed. Figures 3 and 4 present an expenditure breakdown of each system’s budget for both 2006-07 and 2012-13. The largest spending category for each system is clearly instruction. Administrative costs, referred to as “institutional support” by the higher education systems, also constitute a significant portion of UC and CSU budgets. The only cost categories for the UC and CSU that have grown significantly since 2006 are student services and auxiliary enterprises. Auxiliary enterprises are self-supporting operations, including college stores, food services, and residence halls, and do not affect tuition. Below, we discuss the primary costs that could impact tuition.
Figure 3. Distribution of UC expenditures across budget areas, 2007 and 2012
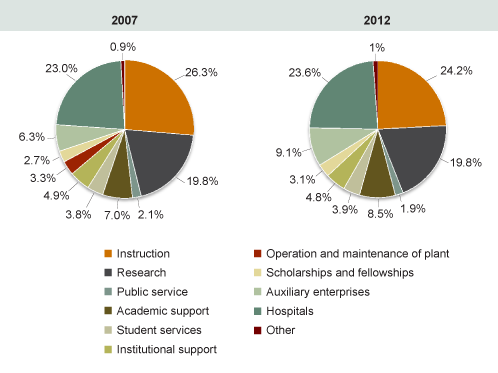
SOURCE: IPEDS.
NOTE: UC and CSU adopted IPEDS’ new required reporting methodology in spring 2011: operation and maintenance of plant expenditures are now allocated across the other functional expenditure areas (instruction, research, etc.).
Figure 4. Distribution of CSU expenditures across budget areas, 2007 and 2012
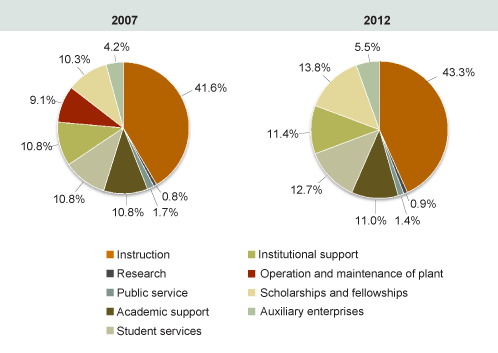
SOURCE: IPEDS.
NOTE: UC and CSU adopted IPEDS’ new required reporting methodology in spring 2011: operation and maintenance of plant expenditures are now allocated across the other functional expenditure areas (instruction, research, etc.).
Instructional Costs
The instructional expense category, which includes faculty and staff salaries and benefits, represents 30 to 40 percent of the total operating budget. This is not surprising, since higher education is a labor-intensive industry.
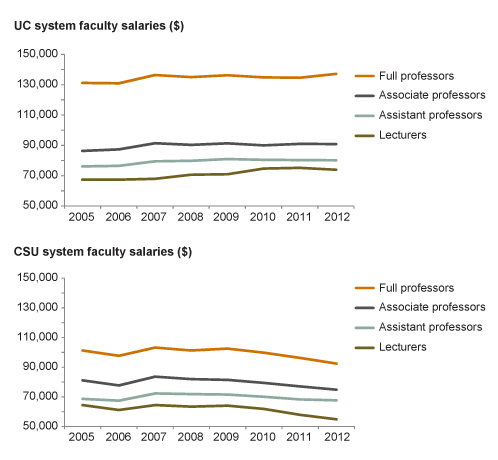
From 2002 to 2013, nationwide utility costs, fringe benefits, and administrative costs have all grown at a much faster pace than faculty salaries (66%, 58%, and 53% versus 32%). Indeed, nationwide faculty salaries just barely kept up with inflation over this period: the CPI-U increased 29.5 percent compared to a 32.3 percent increase in faculty salaries.10 Adjusted for inflation, average faculty salaries by rank have been flat at UC and declining at CSU since 2007 (Figure 5).
Figure 5. Since 2007, faculty salaries have plateaued at UC and Declined at CSU
SOURCE: IPEDS.
NOTE: Average salary by rank adjusted for inflation in 2012 dollars.
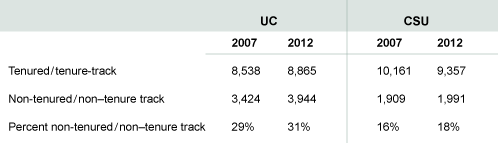
Not only have faculty salaries plateaued or declined within faculty ranks, but UC and CSU are increasingly relying on untenured, non-tenure track, and part-time faculty to provide instruction. As shown in Table 1, the share of faculty that is non-tenure track has increased at both UC and CSU. Given that faculty salaries and benefits constitute the majority of instructional costs, this is not surprising.11 Employing non-tenure track faculty allows universities more staffing flexibility-which is particularly useful during budget downturns-and costs them less in salaries and benefits. Table 1 shows the dramatic shift in faculty composition.
Table 1. Faculty composition has shifted toward non-tenured instructors
SOURCE: IPEDS.
NOTES: Numbers are based on faculty headcount (versus FTE) basis. UC began reporting this data to IPEDS in 2007.
In short, the shift toward lower cost non-tenure track faculty coupled with the stagnation of faculty salaries has kept expenditures for faculty from having a significant effect on the cost of providing higher education. It has also raised concerns about instructional quality and reductions in research.
In the UC system, pensions constitute another large portion of instructional costs.12 The UC Retirement Plan (UCRP) covers about 254,000 current, former, and retired UC faculty and employees and their beneficiaries. Historically, the UCRP has been very well funded-at its peak in 2000 the plan had assets totaling 154 percent of the amount needed to pay the cost of future benefits. Given this level of funding, the Regents suspended employee contributions for nearly two decades, and the state discontinued funding to UC for retirement costs for instructional staff. After the stock market crash of 2008, the UC system acknowledged that the UCRP had become underfunded. Employee contributions were reinstated in 2009, and as of 2013 the UCRP had an unfunded liability of $13.8 billion, an amount equal to 24 percent of the assets needed to pay expected benefits. It does not appear that pension obligations have a significant effect on instructional costs, though this may change in the future.13 UC is seeking state support to help fund future costs.
Administrative Costs
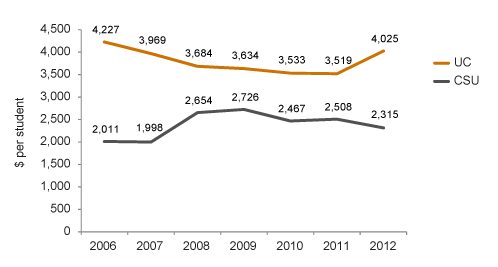
Broadly defined, administrative costs are incurred in day-to-day operational support. This category includes include expenses for general administrative services, executive-level activities concerned with management, legal and fiscal operations, logistical services such as purchasing and printing, and public relations and development.14 Administrative costs are often a source of consternation for policymakers and taxpayers because they appear to be unrelated to the primary mission of providing instruction. UC’s administrative spending in 2012 was about $200 less per student ($4,025) than in 2006 ($4,227), while CSU spent somewhat more in 2012 ($2,315 per student) than in 2006 (Figure 6).
Figure 6. administrative expenditures per student have not increased significantly
SOURCE: IPEDS.
NOTE: Inflation-adjusted to 2012 dollars.
The UC system showed a steady decline in administrative costs until 2012, when an increase in staff retirement costs reversed the trend. The CSU, on the other hand, has kept administrative costs relatively flat with a gradual decrease in administrative cost per student since its peak in 2008-09 though the system currently spends more per student than it did in 2006. These trends do not appear to indicate a rapid increase in administrative costs from pre-recession levels.
Student Services
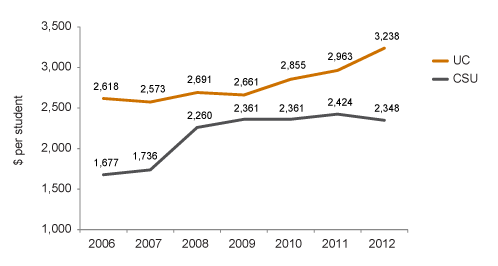
Between 2006 and 2012, UC per-student spending on student services increased by 24 percent and CSU spending rose by 40 percent (Figure 7). Student services expenditures cover the cost of student life outside of the instructional setting, such as student organizations, intramural activities, and cultural events. However, this category also includes expenses related to remedial education, counseling, and financial aid administration.
Figure 7. student services expenditure per student
SOURCE: IPEDS.
NOTE: Inflation-adjusted to 2012 dollars.
Though the broad definition of the term “student services’ makes it difficult to draw firm conclusions, it should be noted that the category includes many of the recommended policies for increasing graduation and retention rates such as increased counseling, tutoring, and financial aid support.15 More research is needed on the relationship between student services and increased graduation rates, but a positive correlation could signal increased overall efficiency.
Conclusion
Our examination of expenditures by the UC and CSU systems shows that the cost of providing public higher education in California has not risen dramatically. Instead, the tuition increases over the past several years have merely shifted the cost from the state to students and their families. To be sure, there has been an increase in grant aid from both the state and federal government, but the majority of students do not receive federal or state grants.
If policymakers are concerned about monitoring what the state gets for its money, they might want to consider implementing performance-based budgeting to better align fiscal incentives with state higher education priorities. Performance-based funding-which has been implemented in several other states-is the focus of a companion report, Higher Education in California: Performance Budgeting. Although it would not prevent cost increases in and of itself, performance-based budgeting would allow the state to provide fiscal incentives for schools to allocate resources to desired outcomes.
More generally, attempts to restrain costs are not likely to succeed in the long run without better data and a deeper understanding of cost drivers. Tuition caps are especially problematic. Because the restriction on increasing tuition is not accompanied by enrollment expectations, the state’s public universities have a fiscal incentive to restrict enrollment or increase out-of-state enrollment. Given the excess demand at UC and CSU and strong labor market demand for college graduates, enrollment restrictions are not in the best interests of the state and college students. To date, both UC and CSU have said that lack of state funding has prevented them from enrolling some qualified students. Moreover, tuition caps could lead to greater volatility in prices once those caps are abolished.16
Higher education is especially vulnerable to budget cuts during economic downturns. The state’s public universities do not have constitutional protections like K-12 education and the community colleges. And, unlike corrections, the higher education budget has not been affected by any major court rulings. During the recent recession, the UC and CSU systems made commendable efforts to keep spending levels from rising. However, those efforts may have unintended consequences. For example, relying on non-tenure track lecturers could reduce the amount of research under way at the state’s institutions, which might negatively affect innovation and spillovers. As the state reinvests in higher education it will need to set clear priorities and ensure that higher education funding aligns with state goals.
Topics
Finance Higher Education