
California continues to be a popular destination for new immigrants to the country; over one in four of the state’s residents was born abroad. But immigration patterns have shifted. Large numbers of immigrants came from Latin America in the late 20th century, while large but less substantial numbers came from Asia. In recent years, immigration has slowed from all countries, and Asia has overtaken Latin America as the prime source. These shifts in immigration flow have immediate implications for the state’s electorate.
Today, Latinos make up a larger share of children than of adults in virtually every part of the state, and the gap is even larger when comparing children (52% Latino) to those of retirement age (22% Latino). But with fewer new immigrants—who tend to be working age—the state’s Latino and Asian American and Pacific Islander (AAPI) populations are aging along with the rest of the state. Over the past 10 years, the Latino and AAPI population shares have grown mostly among those over 45. The AAPI share today is actually higher among older Californians than younger ones.
Longer tenures in the country have led to higher citizenship rates, as older immigrants become citizens and their children are born in the country. The change has been especially sharp among Latinos, where the drop in new immigration has been the largest even as the share of children has remained high. Among Californians under 35, citizenship rates are now higher among Latinos than among AAPI residents.
Changing patterns around the age and citizenship of immigrants have important implications for the voting electorate. While the state’s Latino population is growing more slowly than it once did, the Latino share of eligible voters is growing much faster. Over the last decade, the share of eligible Latino voters has grown 6 percentage points while the Latino population as a whole has grown 2 percentage points. By contrast, the share of eligible AAPI voters has grown at close to the rate of the group’s population growth overall.

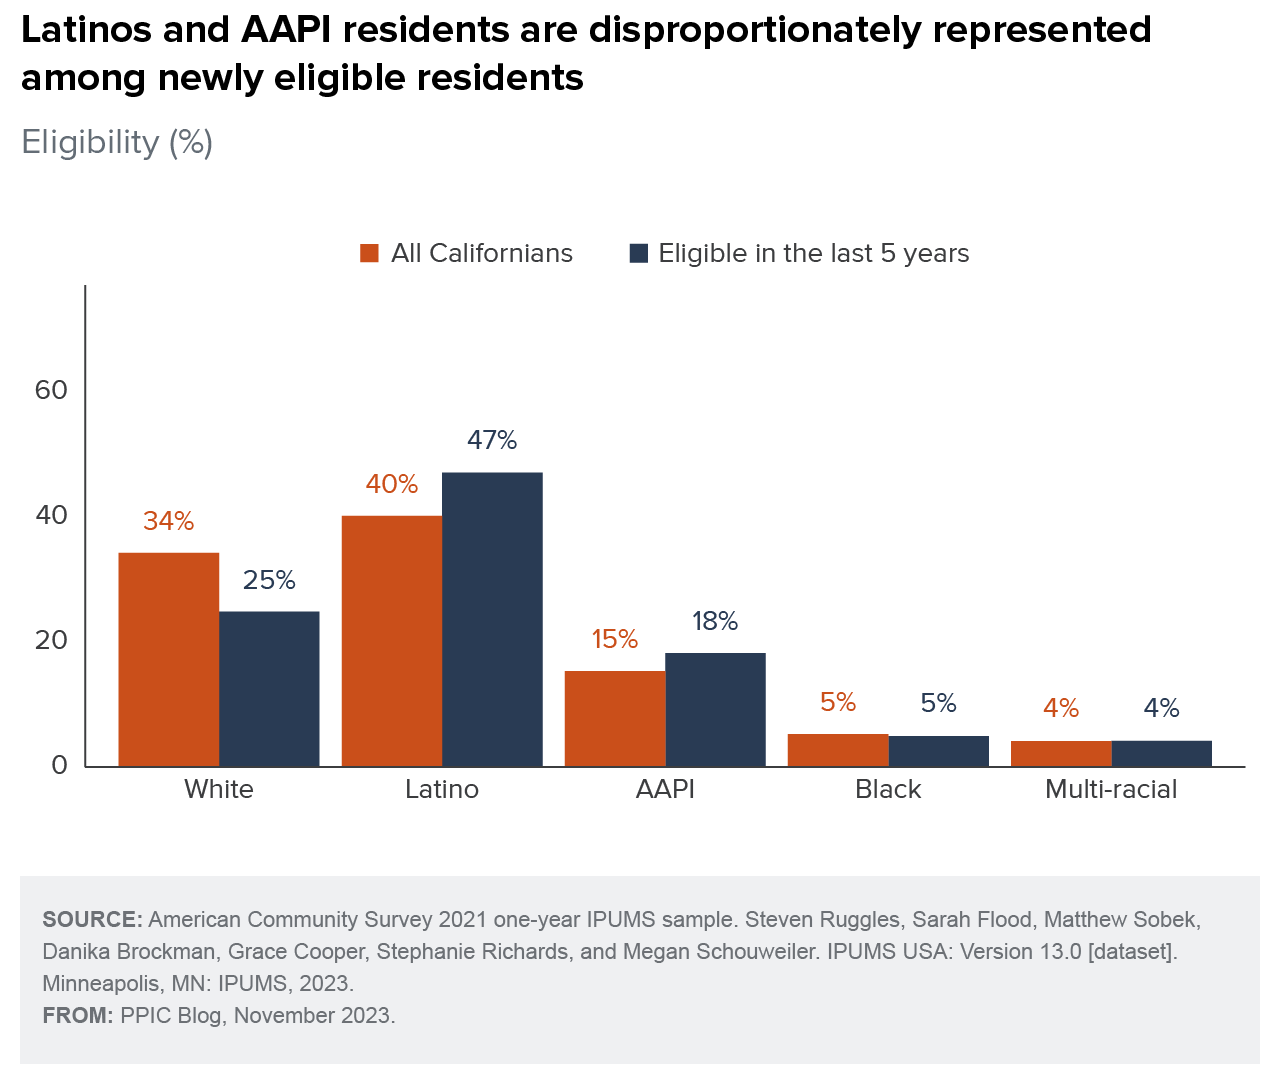
Likewise, Latinos and AAPI residents are disproportionately represented among the recently eligible. Latinos are 40% of the total California population, but 47% of residents who became eligible to vote in the previous five years, while AAPI residents are 15% of the total population and 18% of the newly eligible. The source of this new eligibility differs in each community—Latinos are more likely to age into eligibility as young citizens, while AAPI residents are more likely to be adults who naturalize—but the end result is similar.
In short, the immigration slowdown is gradually shifting the state’s potential electorate closer in line with its total population. As the shift occurs, it directs focus on the continuing disparities in participation that eligibility rates cannot explain. Challenges also may exist around mobilizing newly eligible Latinos, who are more likely to be younger and so less likely to participate. California’s voting electorate is rapidly diversifying; the challenge for the state is to build a democracy where this new diversity is fully represented.