


Last week, the Census Bureau released detailed data from the 2020 Census that will be used to draw new political districts across the state. The bureau had already reported California’s total population—along with the total for every other state—in April. But the latest data release offers the first opportunity to see the official enumeration of the state’s full diversity, and to do it with a level of geographic detail that will not be matched again until the next decennial census.
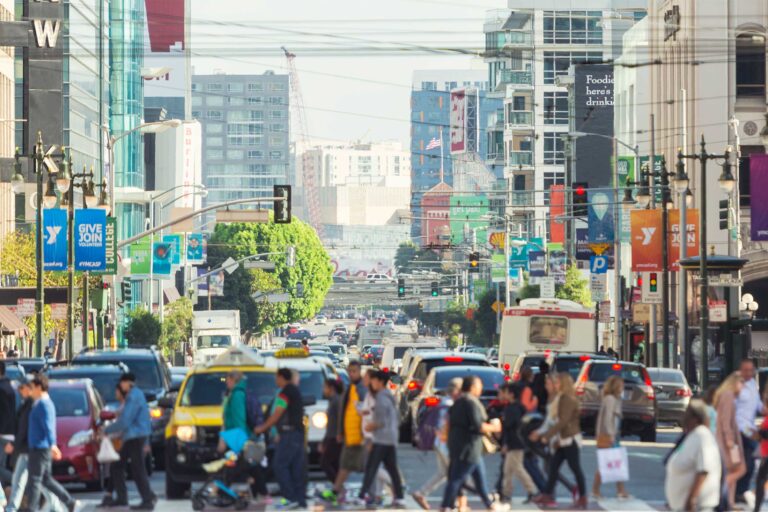
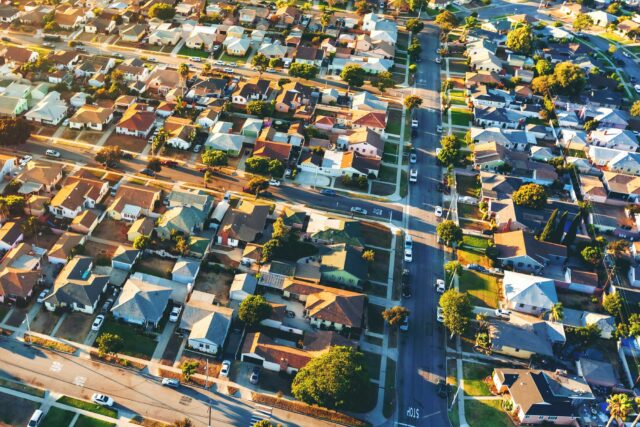
California has grown slowly enough in the past 10 years compared to other states that it has lost a congressional seat for the first time in its history. The map below shows population changes for the state’s 9,129 census tracts—statistical units with a maximum of 8,000 people. Many rural tracts in the far north and east actually have fewer people now than in 2010, while the eastern Bay Area, the Inland Empire to the east of Los Angeles, and the Sacramento metro area have grown the most. These are all areas that offer access to urban job centers—but with far cheaper housing.
The state has also continued its decades-long trend toward greater racial/ethnic diversity. Non-Hispanic whites have declined from 40.2% of the population in 2010 to 34.7% in 2020, with population shares declining in more than eight in ten census tracts. In fact, three-quarters of census tracts have fewer white residents overall than 10 years ago. The number of majority-white tracts in 2020 is 3,000, compared to more than 3,700 in 2010.
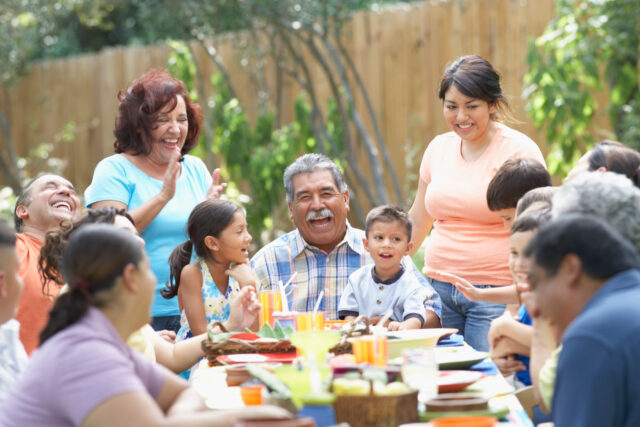
At the same time, the Latino population has grown modestly from 37.6% to 39.4% of the state total. This change further cements Latinos as the most-populous group among all races and ethnicities, but it also reflects a significant slowdown in growth compared to decades past. Though the share of Latinos has increased the most in the Inland Empire, 74% of tracts across the state have seen gains.
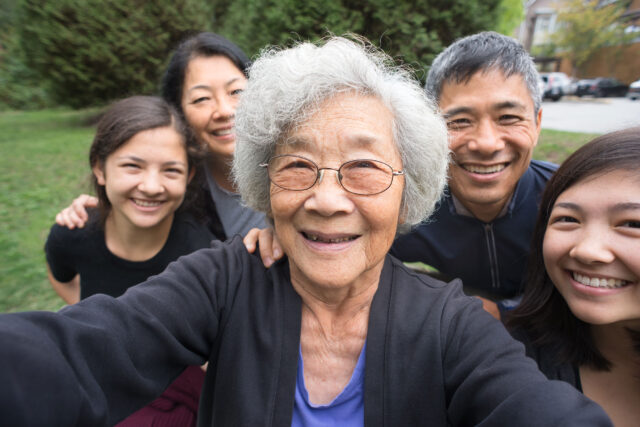
Growth among Asian Americans has accelerated: their share has risen from 12.8% to 15.1% of the population. This growth has been much more geographically concentrated, with the Bay Area and Orange County seeing most of the increase. The Asian American share of the population has grown as much as 25% or more in some Bay Area tracts.
Other groups have been more or less static as a share of the total population. The African American share has declined from 5.8% to 5.4%, the Pacific Islander and Native Hawaiian share has grown slightly from 0.6% to 0.7%, and the Native American and Alaska Native share has been mostly flat at about 0.4%.
Finally, the number of Californians who identify with more than one race has increased significantly, from 4.9% in 2010 to 14.6% in 2020. The vast majority of this increase has occurred among Californians who also identify as Latino, and likely reflects a change in the way the Census Bureau asks and processes the racial-identification question. Latinos often identify with a racial category that the Census Bureau considers nontraditional (e.g., “Mexican Indian” instead of “American Indian”), and more of those categories have been captured this time. Among non-Latinos, growth in multiracial combinations—for example, white and African American, or white and Asian American—has been much smaller; while their share of the overall population has grown considerably, their overall numbers remain modest.
In short, while California’s total population has increased only a little, the state is still experiencing dramatic changes. California today is less rural and white than it was 10 years ago. It is a transformation that has touched almost every corner of the state.
Topics
Census decennial census Political Landscape political representation PopulationLearn More

California’s Changing Immigration Is Reshaping Its Electorate

California’s Plunging Birth Rates
California’s Hispanic Community
California’s AAPI Community
Understanding the Geography of California’s Final Redistricting Maps
Racial Representation and Partisan Leanings in California’s Final Redistricting Maps