
PPIC research fellow Iwunze Ugo testified before the Assembly Budget Subcommittee on Education Finance’s Oversight Hearing on “Learning Recovery and Chronic Absenteeism” on March 15, 2023. Here are his prepared remarks.
Today, I’ll be providing an overview of how California students are faring as the state continues to emerge from the worst parts of the pandemic. I’ll focus on what we’ve learned from the 2022 student test scores, the first full administration of the state standards tests in nearly three years, as well as the impacts of the pandemic on chronic absenteeism and high school graduation rates.
I want to start on test scores by setting the stage. With the onset of the COVID-19 pandemic in March 2020, the administration of the state tests—the Smarter Balanced Summative Assessments, often called the SBAC tests—was cancelled. As the pandemic raged on, many districts were unable to reopen in person by the following year, so the spring 2021 tests were optional and fewer than one in four students took the exams. The spring 2022 tests, the results for which were released in the fall, provide our first look at student achievement in California since the start of the pandemic three years ago. As was broadly feared, the results were bleak.
Overall, 47.1% of students met grade-level standards in English/Language Arts and only 33.4% met standards in math. These are down from 51.1% in English and 39.7% in math in 2019. The English rate is the lowest since 2016, reversing six years of steady progress, and the math rate is the lowest since the SBAC tests began in 2015.

Proficiency rates in English are typically lower in the younger grades, while rates for math are often higher. Comparing the 2022 scores to the 2019 tests, we saw that the largest declines in proficiency rates in English were in grades 3 and 4, where rates dropped 6.4 and 5.2 percentage points, compared to an average decline of 3.4 percentage points in the other grades. There were large declines in proficiency rates across all grades in math, though 8th grade students saw a particularly large decline of 7.4 percentage points (compared to an average decline of 6.4 percentage points for other grades).
Looking at student demographic groups, the overall gaps in proficiency rates for disadvantaged students remain quite large, but the 2022 results show that the pandemic-era declines were often slightly smaller for disadvantaged students. Proficiency rates for economically disadvantaged students fell by 4 percentage points in English and 6.3 percentage points in math, while students who are not economically disadvantaged saw larger declines of 5 and 7.4 percentage points, respectively. Similarly, English Learner (EL) students also saw smaller percentage declines in their proficiency rates compared to non-EL students.

When we examine results by gender, we find that female students had larger declines in proficiency rates than male students. And across racial and ethnic groups, white and Latino students saw larger declines compared to Black and Asian students.

The findings here were somewhat surprising given the substantial research showing that the pandemic exacerbated existing inequalities. PPIC research has found that families that were low-income, Black, or Latino, or did not have any college graduates were more likely to have lower rates of consistent access to the computing devices and high-speed internet needed for distance learning. Districts that serve high shares of low-income or Black and Latino students also remained closed for, on average, six weeks longer than the typical district in the state. The discrepancy here perhaps can be explained by the massive investments of federal and state funds to address the broad impact of the pandemic. The state distributed Expanded Learning Opportunities grants according to the same, targeted approach used in the state’s Local Control Funding Formula, meaning investments were greater in districts that serve high shares of disadvantaged students.
Although we can compare test performance each year—either for the state as a whole or for individual student groups—we often want to understand the growth in student achievement. This requires us to, as best as we can, follow cohorts of the same students over time in order to assess their educational trajectories. This is, perhaps, of even greater importance now, given the uniquely difficult experiences that the recent pandemic-affected cohorts have had. In order to measure growth, we track cohorts of students year after year. For example, 5th grade students in 2015 are linked to 6th grade students in 2016 and 7th grade students in 2017 and so on.
In our most recent cohort, students took the 5th grade SBAC exams in 2019 and most did not take the tests again until spring 2022 in the 8th grade. I should note that we need to shift here from proficiency rates to scale scores—that is, the numerical scores that are used to determine whether students met the state standard. These scale scores capture the annual progress that students are expected to make, allowing us to assess performance growth over time. Comparing our most recent cohort—those who experienced the pandemic—to the results from the two earlier cohorts for which SBAC test data are available, we find that the pandemic cohort of 5th grade students saw scale score growth of 51 points in English and 23 points in math by grade 8. This amount of growth is only 73% of the usual amount of progress in English and only 39% of the usual progress in math.

As a check on these findings, we compared the demographics of the students in each of these cohorts and the differences were minimal, except for a much larger decline in enrollment between 5th and 8th grade in the pandemic cohort. While we saw an average of 3,700 fewer students from 5th to 8th grade in the earlier cohorts, enrollment dropped by 19,000 in the pandemic cohort.
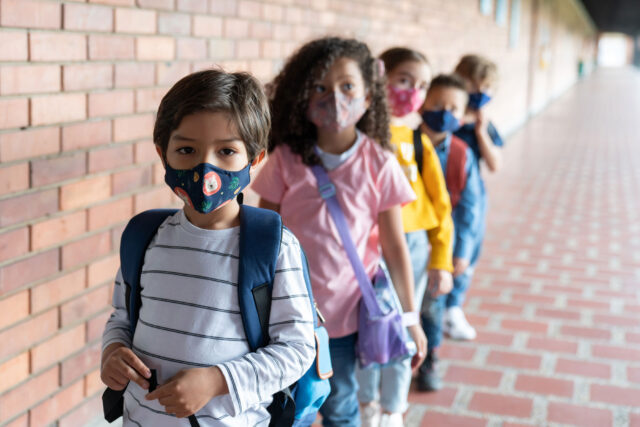
Picking up on this theme of declining enrollment, the last few years have also seen a stark rise in chronic absenteeism. Specifically, that is the number of students who miss at least 10% of the school year, or 18 days. This rate is based on the count of individual students. Some of these students may miss exactly 18 days, some may miss many more, and those who miss 15, 16, or 17 days are not included here at all, so these numbers may undercount the true scope of missed school. In 2021–22, 30% of students were chronically absent—a near tripling of the percentage of students who were chronically absent in 2018–19. There were substantial increases in absenteeism across nearly every student group. Notably, students in kindergarten saw chronic absenteeism rates rise to over 40%, by far the highest out of all the grades. Over half of Black, Native American, and Pacific Islander kindergarten students were reported as chronically absent.

We do not know if these extremely high rates of chronic absenteeism in 2021–22 were temporary—whether they were caused by school districts’ isolation and quarantining policies that year, for example—or if the rates reflect a new reality of a weakening connection between students, their families, and their schools. Further, there is a significant correlation between the magnitude of the rise in absenteeism across California school districts and declines in their proficiency rates on the state tests. Districts with the highest increases in absenteeism also had, on average, larger declines in proficiency rates on both the English and math SBAC tests. To be sure, these early findings are not causal, but the correlation could be pointing to factors that are responsible for both trends. These levels of chronic absenteeism will likely slow the pace of learning recovery. After all, most students are better served by the state’s schools when they are present in the classroom.
Finally, on graduation, the overall picture is different from what we see in test scores and chronic absenteeism, but there are a few important pieces of context needed to understand the trend. Overall, graduation rates were 87% in 2021–22, higher than the 84% average over the last four years. One possible reason for this improvement is that the massive investments that districts received from state and federal recovery programs went to efforts—like summer school programs and additional tutoring—that kept many students on track to graduate despite the turbulence of the pandemic. Another potential contributing factor is that school districts were able to relax their graduation standards, allowing course grades of D and F to be switched to Pass/No-Pass.
With looser graduation requirements, various stakeholders have voiced concerns that students may be receiving diplomas without acquiring the skills and knowledge necessary for a successful transition into higher education or the workforce. However, the share of graduates meeting the A–G course requirements for admission to the University of California or California State University system has continued its steady climb since 2017, up to 44.7% in 2022. Despite the rising rate, only about half of graduates meet these requirements. It appears that whatever the costs of the looser graduation requirements, they are borne not by college-bound students, but instead by those holding high school diplomas that might be worth a bit less, reflecting a reduced scope of competence. However, just as graduation standards were lowered, course-grading standards may have been relaxed as well. We will not have a clear picture of the effects on preparation for higher education until we can actually see how well, or not, these students progress through the state’s universities.

Altogether, it is clear that the COVID-19 pandemic and all of the associated disruptions had a massive detrimental effect on the state’s students. The state and federal government responded quickly, mitigating some of the worst potential effects of school closures. Despite that, student performance on the state tests showed major setbacks in educational progress. Comparisons of test score growth show that students today experienced a sharply reduced pace of progress than earlier cohorts of students. Though longstanding disparities for disadvantaged student groups were exacerbated by some of the impacts of the pandemic, achievement gaps did narrow slightly as these students saw smaller performance declines.
As the state continues to emerge from the pandemic, these recent test scores reveal a substantial need for recovery. Rising chronic absenteeism rates are additionally worrisome, though higher graduation rates and reduced achievement gaps provide some—admittedly complicated—positive news. Addressing these challenges is, of course, a major focus of statewide education policy currently and will likely continue to be throughout the near future.
Topics
A–G courses absenteeism coronavirus English Learners high school graduation K–12 Education learning loss test scoresLearn More

K–12 Test Scores Show Overall Improvement but Highlight Challenges in Upper Grades
Chronic Absenteeism in K–12 Schools Remains Troublingly High

Implications of Chronic Absenteeism for Student Learning

Test Scores Show Six-Year Setback for California Students