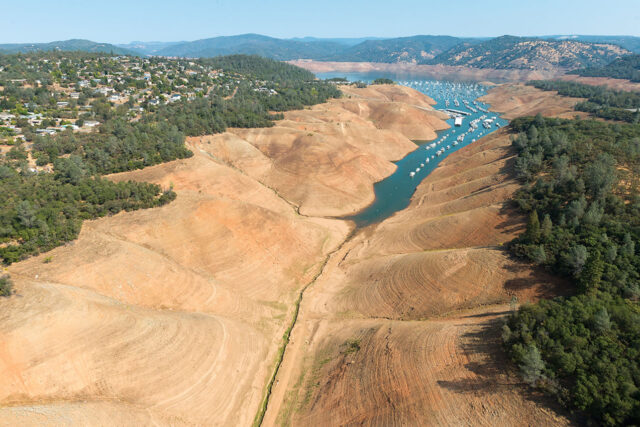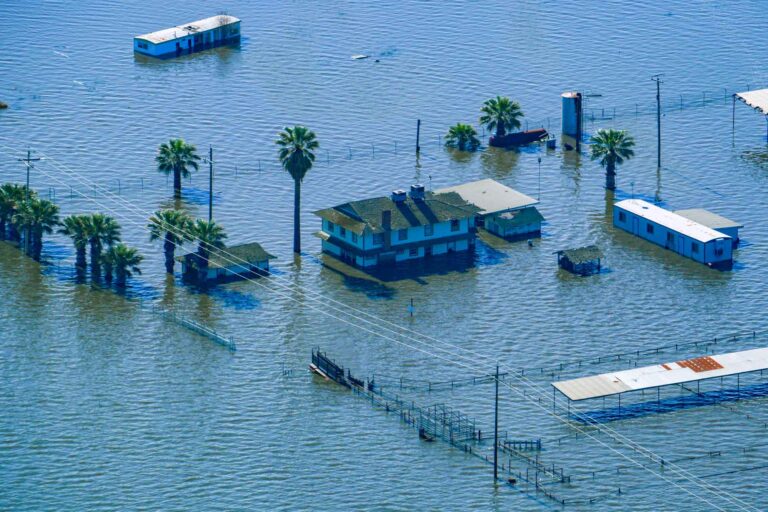


Water Year 2023 comes to an end on September 30. For most weather-watchers, this was an unusual year, with very wet conditions following several very dry years. And there were some dramatic events within the water year, including winter and spring flooding, near-record snowpack, a summertime tropical storm, and the reemergence of ancestral Tulare Lake.
Large year-to-year variation is common in California, which has the distinction of having the nation’s most variable precipitation. But are the frequency and intensity of these variations increasing as the planet’s temperature rises? And if so, what might be the implications for water management?
There are many sophisticated ways to measure climate variability; here we offer some simple metrics. The first panel in the figure below plots statewide annual precipitation since 1900. It shows how variable precipitation is in California. It also shows that we haven’t been experiencing long-term declines or increases in overall precipitation; the trendline is flat.
The second panel measures how much precipitation changes from one year to the next. If variability is increasing, we should see an increase in annual differences over time. As the trendline shows, precipitation is indeed getting more variable—with bigger swings from one year to the next—even though the average is not changing.
Over the past few years, the term “climate whiplash” has emerged to describe extreme reversals in precipitation between wet and dry years. If climate variability is increasing, more years will likely qualify as whiplash years.
We evaluated this using a definition of whiplash from a study that examined projected changes in climate variability in California: a whiplash year is any very wet year (> 80th percentile) preceded by a very dry year (< 20th percentile), or vice versa. In the figure, years shown in blue are whiplash years where very wet conditions are followed very dry conditions, and red years are those where very dry conditions followed very wet conditions.
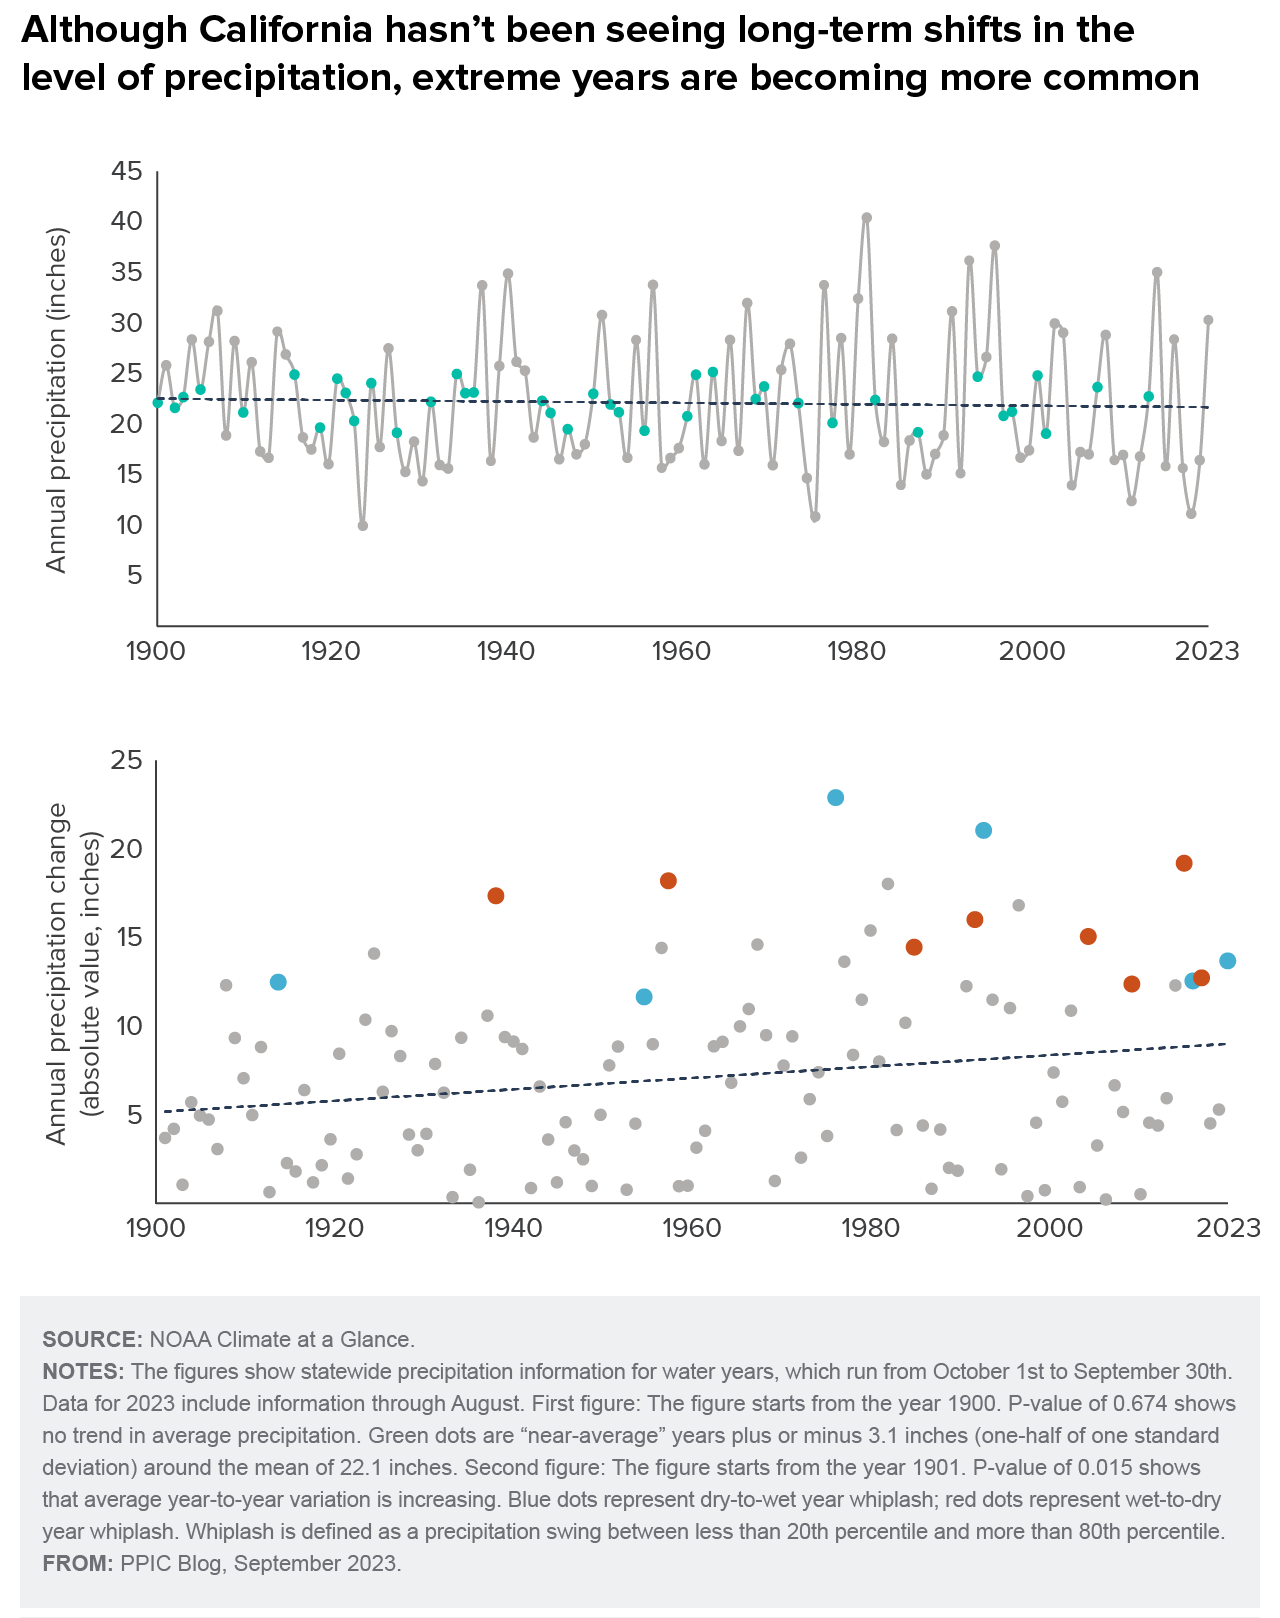
While California’s variable climate has always swung between wetter and drier years, the swings in annual precipitation weren’t typically as large as they are today, and extreme swings not as frequent. Before 1980, a whiplash year occurred about once every two decades. From 1980–99 three whiplash years occurred, and since 2000 there have been six, including this year.
A key part of this story is that the number of years that fall close to “normal” is declining. To show this, the first panel uses green dots to highlight years when precipitation was close to the long-term average (22.1 inches). Before 1980, 38% of all years were near-average; since 1980, that share has fallen to 20%. Extreme variability is becoming “normal”—and near-average conditions are increasingly the exception.
The increasing variability and frequency of whiplash years have been projected by climate modelers for some time. Warming, driven principally by greenhouse gas emissions, supercharges the atmosphere and amplifies the swings in precipitation. The charts illustrate that these changes are not just a future threat—they are already underway.
To a large extent, our flood control and water supply systems are designed around the assumption that precipitation is distributed roughly equally between wet, medium, and dry years. This corresponded, in broad strokes, to historical hydrologic conditions. Having more dry years, more wet years, and fewer near-average years complicates water management in at least three ways:
- Floods. More volatility and warming—which makes floods flashier by increasing the share of precipitation that falls as rain rather than snow—are increasing flood risk in ways that are generally not reflected in flood management plans, including hazard maps and land use planning guidelines. State and regional flood managers will have to rethink their approach to accommodate the changes that are underway.
- Water supply. As California saw in the most recent drought, dramatic swings from very wet to very dry conditions can lead to rapid increases in water scarcity, sometimes little more than a year after reservoirs were full. Reservoir managers—already worried about increasing flood risk—will need to adapt operations to account for the increasing likelihood of wet-to-dry whiplash years.
- Ecosystems. Many of our regulations to protect the environment and keep water fresh are based on water-year type, again relying on the hydrology of the past. The loss of near-average years has big impacts on water flow and quality regulations. And the increase in the frequency and intensity of extreme dry years greatly stresses native fish and wildlife. Regulatory updates are needed to account for these changes.
While not unique, the weird weather of 2023 is an example of a trend of growing precipitation volatility and increasing frequency of whiplash years. In combination with two other trends—warmer temperatures and an increasingly thirsty atmosphere—this is making our dry years drier. Warming also may be making our winter storms more powerful. The scientific community has been sounding the alarm over this issue for decades, and all levels of government are aware of these changes, especially in California. But these changes are already impacting how we manage flood risk, water supply, and the environment—in ways that water year 2023 exemplifies. Adapting to them remains a work in progress that demands an even greater sense of urgency.
Topics
Drought extreme weather Floods infrastructure Water Supply Water, Land & AirLearn More
How California Partners with the Federal Government on Water and Weather Forecasts
A Look Back at 2023’s Volatile Year in Water
Video: Stewarding California’s Wet Years
Reservoirs Are Full, But Let’s Not Celebrate Just Yet
Policy Brief: Tracking Where Water Goes in a Changing Sacramento–San Joaquin Delta