
Summary
Over the two decades since their inception, charter schools have become a significant part of the California public school system. Quasi-independent, but publicly funded, these schools educate about 10 percent of the state’s students.
The Local Control Funding Formula (LCFF), implemented in 2013, overhauled California’s school funding system with the goals of reducing longstanding disparities in funding and improving outcomes for high-need students. To this end, the funding formula augments its base grants-meant to equalize funding across the state-with supplemental and concentration grants that target additional funding to high-need students.
For the most part, charter schools are funded as if they were districts. However, a provision in the LCFF limits the amount of concentration funding that some charters receive. Our analysis of this provision’s impact on charter school funding and performance found that:
- The cap on the concentration grant for charter schools affects a third of charter school students, lowering the amount of per pupil funding by an average of about $450, or about 20 percent of the additional funding they receive for their high-need students.
- The amount of funding lost to the cap on the concentration grant is even greater for charter schools with the highest shares of high-need students. Those where over 95 percent of students are high need lose about 24% of their added funding.
- Thus far, the concentration cap does not seem to be associated with student outcomes.
Under the LCFF, charter schools are on a much more even footing with districts than they were before, and our examination of early student outcomes found minimal differences between charter schools that receive full funding for high-need students and those that do not. Based on these findings, we suggest that it is too soon to revisit the provisions of the LCFF that have resulted in inequitable funding of high-need charters relative to high-need districts.
Introduction
School funding for both traditional public schools and charter schools underwent a major change in 2013, with the implementation of the Local Control Funding Formula (LCFF). Seeking to focus on high-need students-those who are economically disadvantaged, English Learners (EL), or foster youth1-and expand local authority and accountability over education spending, the new funding formula shifted away from the system of revenue limits and categorical programs, which had long been criticized as outdated and overly restrictive.2 The LCFF provides funding to school districts and charter schools through uniform base grants that are augmented by two levels of additional funding for high-need students: the supplemental grant, which provides added funding based on a district’s share of high-need students, and the concentration grant, which provides even more funding for districts in which more than 55 percent of students are identified as high need.
Before the LCFF, charter schools received less per pupil funding than traditional public school districts because some categorical funding was not available to them (Estrada 2012).3 Charter schools are now incorporated into a unified structure where they are treated much like school districts in terms of funding and accountability. There is, however, a provision in the LCFF that limits the amount of funding that some charters receive. While districts receive concentration grant funding if their share of high-need students is above 55 percent, the grant for a charter school is calculated based not on that school’s share of high-need students but on the share in the local district-if it is lower. This provision-which aims to discourage districts from trying to relieve pressure on their budgets by converting schools with many high-need students into charters, thus isolating them from less-disadvantaged students and communities (Fensterwald 2013, Cabral and Chu 2013)—lowers the amount of funding allocated to some charter schools. Charter schools serve more than 565,000 students4-many of whom are high need-and these somewhat arbitrary disparities have the potential to impact a substantial number of them.
In this report, we first look at student demographics to see whether charters and traditional public schools serve similar populations. We then examine the LCFF provision that restricts funding for some high-need charter schools and detail the differences in funding that arise from it. Finally, we compare student outcomes in the charter schools that are affected by the provision to outcomes in schools that are not affected.
Charter Schools and Traditional Public Schools Serve Similar Student Populations
A common criticism of charter schools is that they serve fewer disadvantaged students than traditional public schools. In California, however, the demographic differences between the two are mixed. The share of charter school students who are white is larger than that for traditional public schools (29% to 24%), and the shares of students at charter schools who are Latino (50% to 54%) or Asian (5% to 9%) are smaller. However, the share of African American students is actually a bit larger at charter schools (8% compared to 6% in traditional schools).5 Fewer charter school students are economically disadvantaged, and their share of EL students is even lower. Charter schools do, however, serve similar shares of students with disabilities.6
Table 1. Charter school students are more likely to be white or African American, less likely to be Latino or Asian
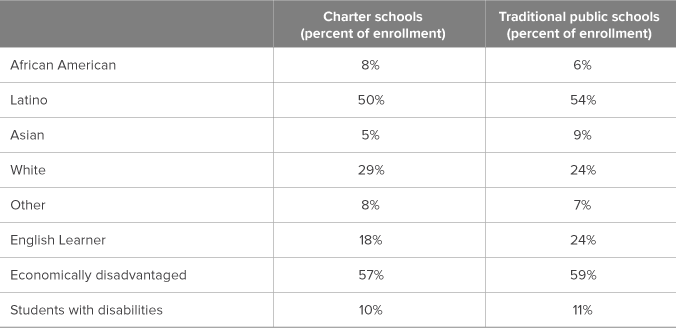
SOURCES: California Charter Schools Association. California Department of Education, 2015-16.
NOTE: Share of students with disabilities is calculated only for students who took the 2015 CAASPP. About 14 percent of students with disabilities did not take the CAASPP.
While California charters serve, on average, only a slightly lower share of high-need students than traditional public schools, looking more closely at how the share of high-need students varies among schools reveals substantial differences. In Figure 1, we examine how high-need students are distributed among traditional public schools and charter schools. Relative to traditional public schools, a greater share of charter school students are at schools with lower shares of high-need students. Smaller shares of charter students attend schools where the share of high-need students is above 70 percent. However, the share of charter school students at these high-need schools is substantial. Almost 43 percent of charter school students are at schools where more than 70 percent of students are high need-though the share for traditional public schools is even higher at 50 percent. When we consider the most concentrated cases, we see that 21 percent of charter students attend charter schools where the school share of high-need students is 90 percent or more, and a similar share, 22 percent, do so at traditional public schools.
Figure 1. Relative to traditional public schools, fewer charter students are at schools with large shares of high-need students
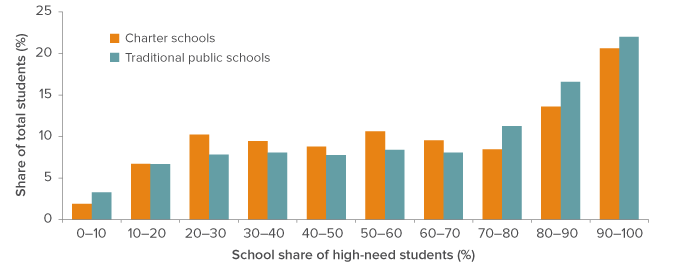
SOURCE: California Department of Education.
The LCFF Caps Concentration Grants for Some High-Need Charter Schools
Additional funding from the LCFF’s supplemental and concentration grants provides a major boost to districts with large shares of high-need students. For example, as Table 2 shows, Stockton Unified and Fremont Unified are roughly the same size, but have dramatically different shares of high-need students. In the case of Stockton Unified, nearly half of its $86 million in additional funding for high-need students comes from the concentration grant, while Fremont Unified only receives $17 million in additional funding-all from the supplemental grant. The difference in need leads to large differences in funding, with Stockton receiving about $1,900 more per pupil.
Table 2. Different shares of high-need students can produce dramatically different amounts of additional funding
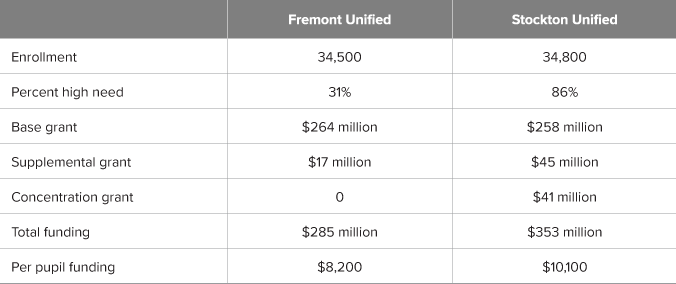
SOURCE: California Department of Education.
NOTES: Total funding includes add-on funding for the categorical programs that were not eliminated by the LCFF and special grants for rural schools (not shown in table). Total funding based on LCFF Target Entitlement, the amount of funding a district will receive when the LCFF is fully funded in 2020-21.
The concentration grant was included in the LCFF in recognition of the additional challenges faced by schools with large shares of high-need students. The rationale for the provision that limits the amount of concentration grant funding charters can receive is similar to the reason for allocating LCFF funding through districts rather than sending it directly to traditional public schools. Without the cap for charters or the provision that traditional public schools be funded through their districts, schools with deliberately high concentrations of high-need students could be formed for the purpose of maximizing funding, with the side effect of increasing segregation.
Indeed, there was suggestive evidence that, in the years leading up to the LCFF, school finance rules created an incentive to form charter schools in order to get more funding. The shift to the LCFF was preceded by steep cuts in funding for K-12 education throughout California as a result of the economic downturn in the late 2000s. As school districts struggled to maintain services with diminished support from the state, more charters may have been formed in order to take advantage of the charter school block grant, which had not been cut as heavily as broader education funding (Estrada 2012).
However, basing the amount of concentration grant funding on the districtwide share of high-need students rather than the charter school share can create arbitrary disparities in funding between schools with similar demographics. For example, a charter school with a 70 percent share of high-need students in a district with only a 40 percent share does not receive any funding from the concentration grant. If the charter’s local district share of high-need students is 60 percent, it receives concentration grants for the 5 percent difference between the 55 percent threshold and the district’s 60 percent share, rather than the full 15 percent difference between the threshold and its own share.
Figure 2 shows the amount of per pupil concentration grant funding that high-need charter schools receive relative to their shares of high-need students. Estimates of the average amounts received by capped and uncapped charter schools are represented by teal and orange lines, respectively. The widening gap between the two lines shows that the average amount of funding lost to the cap on the concentration grant is higher for charter schools with larger shares of high-need students.
Figure 2. The concentration cap has a bigger effect on schools with higher shares of high-need students
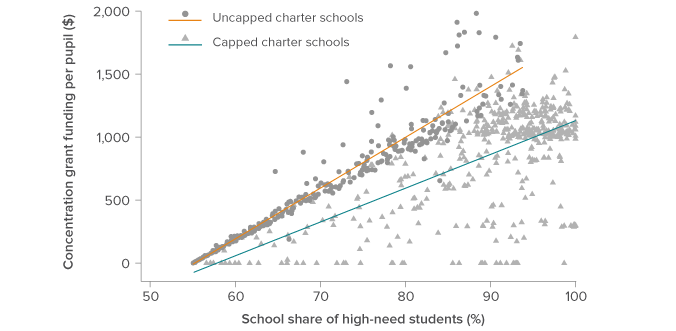
SOURCE: California Department of Education. Authors’ calculations.
For example, the amount of per pupil concentration grant funding at a charter school in which 60 percent of students are high need would be about $125 lower if it were capped, while a school in which 90 percent of students are high need would get $575 less than a similar school not affected by the cap. We quantify the loss of funding for charters due to the cap in the next sections.
Funding differences among capped charter schools
While charter schools and districts receive similar shares of their total funding from concentration grants-5 percent and 6 percent, respectively-charter funding would be higher without the cap. Of the more than 1,200 charter schools across the state, just over 700-about six in ten-are concentrated, with shares of high-need students at 55 percent or above. Of that 700, about 460-another six in ten-are capped because they have shares of high-need students that are larger than the shares in their local districts. More than 30 percent of charter school students are at these capped schools. They have an average share of high-need students of 88 percent, which is much higher than the average 77 percent share districtwide. On average, capped charter schools receive about $450 less in per pupil funding-about 20 percent of all the additional funding they receive for their high-need students. Altogether, this difference in funding adds up to $78 million. For the full list of capped charter schools, see Technical Appendix A.
With the cap on concentration grant funding, the local district that a charter school is tied to-its determinative district-can have a substantial effect on funding differences among similar charter schools.7 The three schools in Table 3 all have similarly large shares of high-need students, but their determinative districts put them in three different situations when it comes to concentration grant funding. A school like El Sol in Santa Ana has a high concentration of high-need students but happens to be located in a district with an even larger share, so the cap does not affect its concentration grant. The two other schools, with virtually identical shares of high-need students, are both capped. Edison Charter in San Francisco receives some funding from the concentration grant, though its per pupil funding would be about $500-almost 6 percent-higher without the cap. And at Aspire Alexander Twilight Secondary Academy, its 80 percent share of high-need students generates no concentration grant funding at all since it is tied to San Juan Unified, which has a share of high-need students just under the 55 percent threshold. Its per pupil funding would be about $900-or 10 percent-higher without the cap.
Table 3. The local district can have a major impact on charter school funding
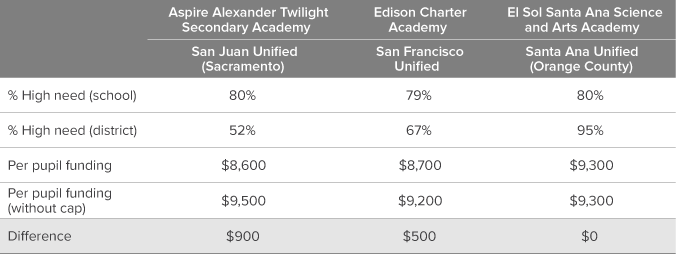
SOURCE: California Department of Education. Authors’ calculations.
NOTE: Dollar amounts are rounded to the nearest hundred.
The cap on the concentration grant has the largest impact on charter schools with the highest shares of high-need students. Table 4 compares the funding that charter schools at different levels of need would get with and without the cap on the concentration grant. The charter schools with a share of high-need students up to 75 percent would see a 2 percent increase in funding without the cap, while the next group of schools-with up to a 95 percent share of high-need students-would see an increase of about 4 percent. At extremely concentrated schools-where more than 95 percent of students are high need-per pupil funding would be $500 higher. That would be a 5 percent increase for the almost 60,000 students who attend these extremely concentrated schools and make up 10 percent of charter school enrollment overall.
Table 4. Charter schools with the largest shares of high-need students miss out on the most concentration funding
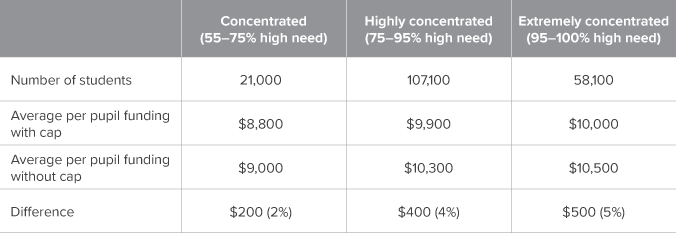
SOURCES: California Department of Education. Authors’ calculations.
NOTES: Dollar amounts and student counts are rounded to the nearest hundred. Percentage differences are based on actual numbers.
In the next section, we investigate whether academic outcomes for high-need students attending capped charters are worse than outcomes for high-need students at uncapped schools.
Outcomes for High-Need Students at Capped Charter Schools
Given the significant amount of funding that some charter schools miss out on due to the cap on the concentration grant, it would be useful to examine whether those differences in funding relate to student outcomes. To this end, we looked at the most recent results on the English and math portions of the Smarter Balanced tests, as well as the state’s measure of English Learner (EL) progress. The English and math results measure how close student scores are to the state standard, while the indicator of EL progress is the share of ELs who have advanced to higher levels of English fluency in the past year, including those who were reclassified.
In order to set some context for the analysis, we looked at the average outcomes in English and math for high-need students at charter schools and traditional public schools. Average scores for high-need students at all types of schools are below the standard, but, on average, charter schools’ results in English were better and results in math were worse than results for traditional public schools.
Figure 3. On average, high-need students at charter schools did better than their counterparts at traditional public schools in English and about the same in math
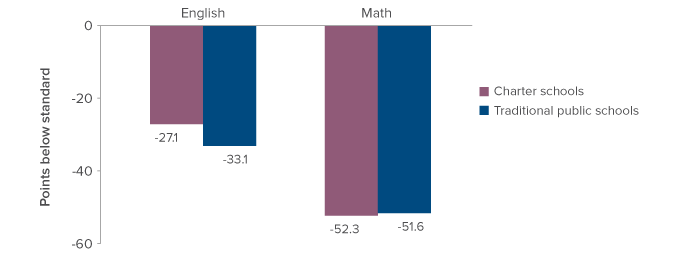
SOURCE: California Department of Education. Authors’ calculations.
Charters also had higher levels of EL progress than traditional public schools. Of course, there is an entire body of research dedicated to comparing student outcomes at charter schools to those at traditional public schools. The statistics in Figure 3 provide only a rough benchmark for performance as we consider the cap in relation to student outcomes.
When we compared the results for high-need students at capped charter schools to those for high-need students at uncapped charter schools, we found mixed results. A more detailed description of the regression models we used to compare student outcomes is available in Technical Appendix B.
In English, students at capped charter schools seemed to do worse than those at uncapped charter schools, but this result was not statistically significant-as indicated by the dashed boxes in Figure 4. Capped charter schools had lower levels of English Learner progress, with a rate about 3.5 percentage points lower. Interestingly, they did better on math than high-need students at charter schools that were not affected by the cap on the concentration grant with scale scores that were about 7.8 points higher.
The schools that are affected by the concentration cap differ from those that are not in one important way: capped schools tend to have larger shares of high-need students-an average of 89 percent, compared to just 71 percent in schools that are not capped. Previous research has shown that the share of high-need students at a school or district is a strong predictor of its average test scores (Hill and Ugo, 2016), which might explain some of the gap in scores between capped and uncapped schools.
When we looked again at the relationship between the cap and student outcomes, this time controlling for the share of high-need students at a school, we found that the results for students at capped schools were relatively higher. Math scores at capped schools rose, with the gap between them and uncapped schools rising from 7.8 to 9.9 points. The EL progress rate was still lower for capped schools, but the gap shrank from 3.5 percentage points to 2.9 percentage points. The estimated gap also shrank for capped charter schools on English, but here again the result was not statistically significant. When we examined only charter schools that are directly funded by the state we got similar results. More details on the other ways we analyzed student outcomes can be found in technical appendix Table B4.
Figure 4. With shares of high-need students are factored in, results for capped charters improve relative to uncapped schools
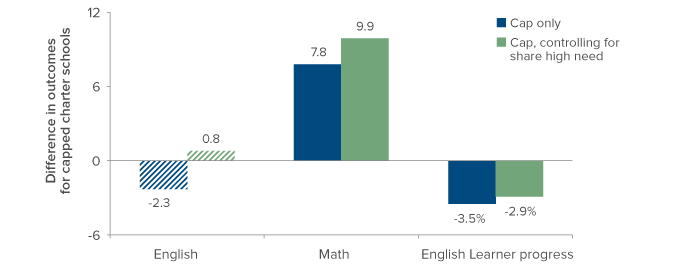
SOURCE: California Department of Education. Authors’ calculations.
NOTE: The results for English are not statistically significant. For more on the regression model used, see Technical Appendix B.
The gap between the share of high-need students in a capped school and the districtwide share was about 12 percentage points on average, but it ranged from almost 0 to more than 40. Since a charter school with a larger gap misses out on more concentration grant funding, we also looked at the question of whether the magnitude of this gap was related to student outcomes. We found that the size of this gap was not related to any differences in student outcomes for English, math, or English Learner progress, with no statistically significant results for any of the measures.
What do these results say about the relationship between the cap on the concentration grant and student outcomes? We caution against reaching definitive conclusions. Our finding that the incremental difference between capped and fully funded charters does not seem to be linked to differences in student outcomes does not constitute a clear statement on either the impact of the cap or the usefulness of concentration grants. For one thing, it is too soon to tell, since LCFF implementation is not yet complete. Further, supplemental and concentration grants account for a good deal of extra funding even at capped charter schools, especially when compared to pre-LCFF levels.
Conclusion
The implementation of the LCFF began a new chapter in the complex history of charter schools and their relationship to traditional public schools. On the one hand, the LCFF has brought charters into line with traditional public schools. On the other hand, it includes a provision that caps the amount of funding some high-need charters can receive. The cap on the concentration grant affects a third of charter school students and lowers the amount of funding allocated to their schools by an average of about $450 per pupil. The charter schools with the highest shares of high-need students miss out on even more funding.
In looking at whether these differences in funding are related to student outcomes, we found that high-need students at charter schools that were capped did better on math and worse on English Learner progress than students at charter schools that avoided the cap. The results for English, however, were not significantly different. After controlling for important demographic differences we saw outcomes improve for capped charters relative to uncapped charters, with the gap growing in math and shrinking in EL progress, while English results remained the same. We also looked at whether the amount of funding lost to the cap was related to differences in outcomes among capped charter schools but found no significant differences. Thus far, student outcomes as they relate to the concentration cap are mixed and inconclusive.
Prior to the recent reforms, charters typically had lower per pupil funding than traditional public schools, and that is likely to continue under the LCFF. Recent estimates have shown that the gap between comparable charter schools and districts had been about 7 percent, while under the LCFF the difference is about 5 percent for the charter schools most affected by the cap and even lower for charter schools with lower concentrations of high-need students (Estrada 2012). A unified funding system that covers both charters and traditional schools-as opposed to the patchwork of categorical programs that often were not available to charters-has put charter schools on a much more even footing with districts, and the impact of not receiving the full concentration grant does not appear to be related to lower performance levels.
Topics
K–12 Education