
Summary
Recognizing the educational and economic benefits of a college degree, education policymakers at the federal, state, and local levels have made college preparation a priority. There are many ways to measure college readiness, but one key component is rigorous high school coursework. California has not yet adopted a statewide college readiness requirement, but a growing number of school districts-including Los Angeles Unified, San Jose Unified, Oakland Unified, San Diego Unified, and San Francisco Unified-now require students to complete the rigorous coursework, called the “a-g courses,” that are necessary for admission to the University of California (UC) and the California State University (CSU) system.
In this report we look at participation and performance in rigorous high school courses among California high school students, both overall and across demographic and racial/ethnic groups. While enrollment in rigorous courses has been increasing, particularly among students who are traditionally underrepresented in higher education, a large majority of California high school students are not taking the courses that can prepare them for college. Forty-three percent of high school graduates in 2015 completed the a-g requirement, and 27 percent of high school graduates in 2013 passed an advanced placement (AP) exam. Participation in advanced math, biology, chemistry, and physics courses is also low. In particular, only 30 percent of high school juniors and seniors enrolled in Algebra II and smaller shares enrolled in chemistry (28%) and physics (10%).
As they monitor the progress of public high schools in preparing students for college, state policymakers and districts need to focus on indicators such as a-g completion, benchmark course-taking, and end-of-course exam (EOC) results. We also recommend tracking performance across student groups to help schools and districts address gaps in achievement and provide educational resources to students who need them most.
Are California Students Taking College Prep Courses?
Despite the rising cost of higher education, the benefits of a college degree remain high (Autor 2014; Goldin and Katz 2008; Autor, Levy, and Murnane 2003). And one of the keys to college success is academic preparation. To date, 48 states-including California-have adopted rigorous academic standards to prepare public high school students for college and careers (US Department of Education 2010; Education Commission of the States 2014). In California, college readiness is a key component of several other major reforms. Senate Bill (SB) 1458, signed into law by Governor Brown in 2012, de-emphasized state test scores by requiring additional measures of student accomplishment and preparation for college and beyond (California Department of Education 2012). The state’s new school finance system, the Local Control Funding Formula (LCFF), includes college readiness as one of eight priority areas that schools and districts must address in their Local Control and Accountability Plans (LCAPs). In addition, one of the LCFF’s major goals is to help districts address long-standing achievement gaps between groups of students.
This report highlights the importance of high school coursework in preparing students for college and examines trends and patterns of rigorous course-taking. Rigorous research that controls for student selection shows that participation and performance in rigorous courses, particularly in math and science, are associated with positive educational and economic outcomes in college and beyond (Long, Conger, and Iatarola 2012; Joensen and Nielsen 2009; Rose and Betts 2004; Levine and Zimmerman 1995). Given the benefits of rigorous high school courses, we address several important policy questions: How many California students are taking courses that prepare them for college? Are there disparities across student groups? And how have course-taking patterns changed over time? How can policymakers improve college readiness?
We focus on completion of the a-g requirement as well as enrollment and performance in advanced science, technology, engineering, and math (STEM) coursework and participation in advanced placement (AP) exams. When applicable we also provide historical trends with breakdowns along the lines of student demographics and family income.
A-G Completion
The a-g sequence consists of year-long courses in seven subject areas: history/social studies (a), English Language Arts (b), mathematics (c), laboratory sciences (d), world languages (e), visual and performing arts (f), and college-preparatory elective (g). Students must complete the sequence to be eligible for admission to the UC or CSU system. In recent years, several districts in California have made a-g completion a graduation requirement-part of an effort to expand college access among students who have traditionally been underrepresented in higher education.1 Given the importance of a-g completion in high school graduation and college eligibility, it will be important to monitor the impact of these policies over time (Betts et al. 2016).
In this report we look at trends in a-g completion since 2000. Despite a modest increase in statewide completion, less than half of California’s high school graduating class of 2015 met the requirement (Figure 1). Though a small percentage of high school graduates who did not complete the a-g sequence have nonetheless enrolled in college, the low completion rate has raised concern about the preparedness of California’s high school graduates (Betts, Zau, and Bachofer 2013). Latino students have made the most progress (a 51% increase from 2000 to 2014), leading to a slight decrease in the white-Latino performance gap. Other gaps-racial/ethnic, gender, and family income-have remained largely unchanged.
Figure 1. The share of high school graduates completing the a-g requirement has been increasing modestly
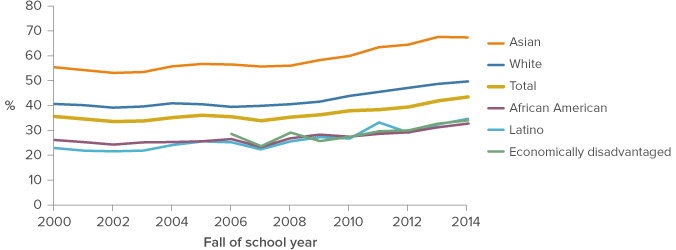
SOURCE: California Department of Education, 2000-2014.
NOTES: No breakdown by socioeconomic status was available before 2006-07. The completion rate is higher among girls across all subgroups’ in 2014-15, 49 percent of female graduates completed the a-g requirement, compared to 38 percent of male graduates.
African American and Latino students disproportionately attend high-minority schools or high-poverty schools; these schools tend to have lower a-g completion rates.
The statewide number masks the uneven distribution of demographic and socioeconomic student groups across schools. For instance, African American and Latino students disproportionately attend high-minority schools (in which more than 75 percent of students are Latino or African American) or high-poverty schools (in which more than 75 percent of students are eligible for free or reduced price lunch); these schools tend to have lower a-g completion rates. For this reason, we also look at completion rates at the school level (Figure 2). From 2000 to 2014, the average completion rate is 34 percent in low-minority schools, compared to 20 percent in high-minority schools. There is a similar gap between high- and low-poverty schools. These minority and poverty gaps have remained largely unchanged over time, raising the concern about persistent achievement gaps that has motivated new state and district policies (Figure 2).
Figure 2. Completion rates for the a-g sequence are higher at low-minority and low-poverty schools
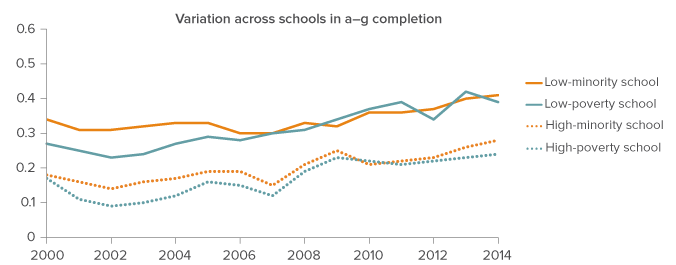
SOURCE: California Department of Education, 2000-2014.
NOTES: Low minority schools are schools where less than 25 percent of students are African American or Latino; low poverty schools are schools where less than 25 percent of students are eligible for free/reduced price lunch. The completion rate is substantially lower using school level data, and the downward bias is evident across all subgroups. Over time there has been a steady increase in high-minority and high-poverty schools, and a parallel decrease in low-minority and low-poverty schools. For instance, in 2000 only 7 percent of high schools were high poverty; in 2013 the share was 34 percent. Forty-four percent of schools were low-poverty in 2000; the share decreased to 15 percent in 2013.
STEM Courses
With the United States falling behind other developed nations in math and science education, California’s recently adopted math and science standards make scientific and technological literacy for all students a priority (National Center for Education Statistics 2014; California Department of Education 2013a, 2013b). Enrollment and performance in STEM courses is an important indicator not only because access to certain math and science courses (e.g., Algebra II) is associated with better secondary and postsecondary outcomes, but also because there is a high demand for these skills in California and jobs in these fields tend to be high paying.
To see how many of California’s public school students are taking advanced courses in math and science, we looked at enrollment in a few benchmark STEM courses, which include Algebra II, biology, chemistry, physics, and computer science.2
In 2012-13, 30 percent of high school students (grades 11 through 12) were enrolled in Algebra II, representing a 76 percent increase from 1997-98.3 Enrollment is higher among girls (32%). A much smaller (but growing) number of students were enrolled in other advanced math courses such as probability and statistics (2%), calculus (1%), AP calculus AB (5%), AP calculus BC (1%) and AP statistics (3%), with no meaningful difference between boys and girls (Figure 3).
Figure 3. Enrollment in advanced math courses has risen-especially in Algebra II-but is still low
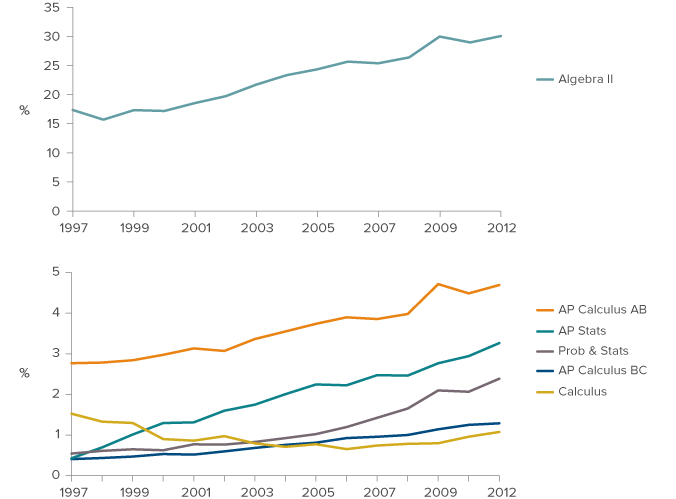
SOURCE: California Department of Education, 1997-2012.
NOTE: Course standards and sequencing are different in the common core era (post-2012), therefore we do not show the numbers for 2013 and beyond.
The share of high school students (grades 11 and 12) taking biology, chemistry, and physics courses has grown steadily since 1997, though growth has been slower in physics (Figure 4). There is no marked difference between boys and girls, though slightly more girls than boys have been enrolling in chemistry (30% to 26%). Participation in advanced biology, chemistry, and physics courses is much lower (under 3%).
In light of recent efforts to narrow the gender gap in computer science, we also looked at boys’ and girls’ participation in AP computer science courses. After a dramatic increase in the late 1990s, there has been a decline in student participation in AP computer science courses. It is not until lately that we see a dramatic increase in AP computer science enrollment. The gender gap, after narrowing in the early 2000s, is now growing again (Figure 4).
Figure 4. More high school students are enrolling in science and computer science courses
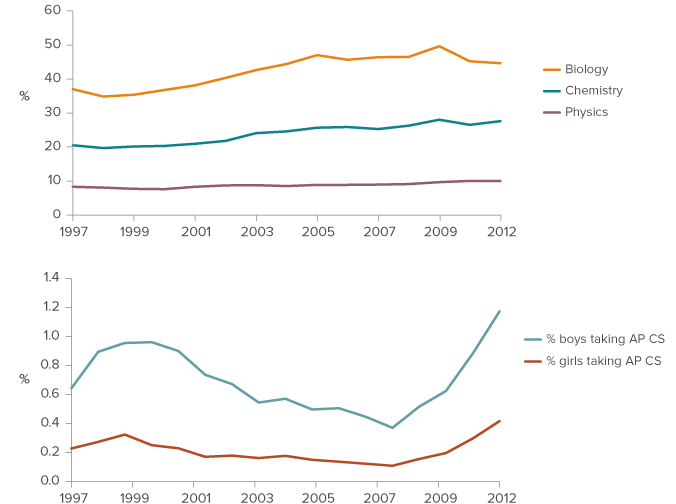
SOURCE: California Department of Education, 1997-2014.
NOTES: Course completion of students in grades 11-12. Because science course standards and sequencing are different in the Common Core era, we do not show the numbers for 2012 and after. AP computer science includes both AP CS A and AP CS AB.
Despite the improvement in STEM course-taking over the years, racial disparities persist. In 2014-15, only 8 percent of Latino and African American students enrolled in advanced math (e.g., above algebra II), compared to 29 percent of Asian students and 17 percent of white students. Enrollment in first-year chemistry and physics follows a similar pattern (Table 1). No racial breakdown is available for previous years, but limited data from 2008-09 suggest that enrollment has increased for all students except for Latinos, whose participation in advanced math, first-year chemistry, and physics has decreased.
Table 1. There are persistent disparities in STEM course-taking across racial/ethnic groups
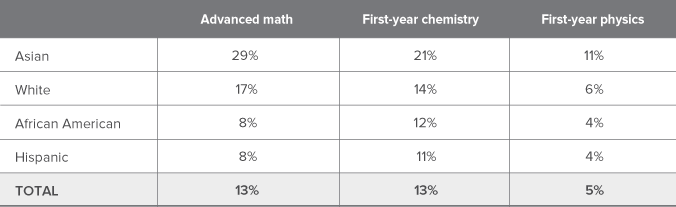
SOURCE: California Department of Education, 2014-15.
NOTE: Table shows shares of 11th- and 12th-graders taking these courses in 2014-15; racial/ethnic breakdowns are not available for previous school years, with the exception of the 2008-09.
AP Exams
To receive college credit for AP courses, students must take exams administered by the College Board. We tracked the shares who took and passed at least one exam from 2003-04 to 2013-14. Students typically take AP exams in 11th or 12th grade, though in recent years we have seen dramatic expansions in earlier grades, particularly in social sciences.
In 2013-14, 25 percent of California’s public 11th- and 12th-graders took at least one AP exam, up from 15 percent in 2004 (College Board 2014). All major demographic groups have experienced a steady increase in AP participation. Most notably, the share of Latino students taking at least one AP exam has risen from 11 percent in 2003-04 to 19 percent in 2013-14 (Figure 5).
Figure 5. Overall participation in AP exams has been increasing but is still low among most student groups
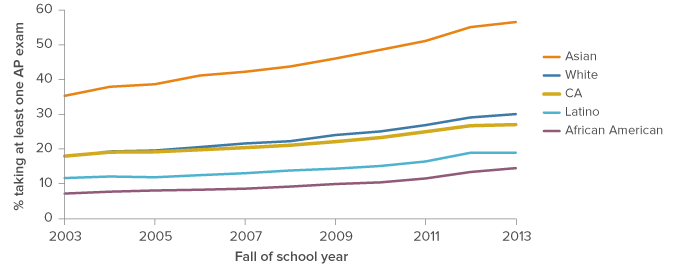
SOURCE: College Board, 2003-2013; California Department of Education, 2003-13.
NOTES: Sample includes all 11th- and 12th-graders taking at least one AP exam in a particular school year. Participation rate is calculated by dividing the number of AP test takers (from the College Board) by the number of students enrolled (from the California Department of Education). The sample includes students attending private schools because breakdowns by grade level and school type are not directly available from the College Board. Including private schools has minimal impact on our conclusion: according to the College Board, in 2013-14, 25 percent of public-school 11th- and 12th-graders took at least one AP exam, and including private schools (as we did in this figure) increases the number to 27 percent.
Statewide, 60 percent of AP test takers in 2013-14 passed at least one STEM subject exam; this rate has held steady over time. Passage rates among whites, African Americans, and Asians have risen slightly since 2003. Among Latinos, the passage rate has declined very slightly-this is not surprising, since increases in participation among students with historically low levels of college readiness tend to be associated with lower scores (Figure 6).
Figure 6. The passing rate on AP exams covering STEM subjects has held steady for most student groups
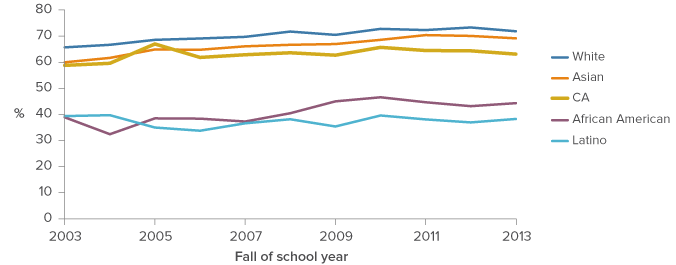
SOURCE: College Board 2014.
NOTE: The sample includes all public- and private-school seniors. There is no marked difference between 11th- and 12th-graders, except among Asians and Latinos, for whom passing rates are lightly higher for 11th-graders (+0.10 and +0.04 respectively).
Looking beyond STEM subjects, gaps in overall AP passage rates between some racial/ethnic groups have shifted. The gap has narrowed slightly between Asians and whites, as has the gap between whites and African Americans, while the white-Latino gap has widened-again, this is not surprising, given the historically low levels of college readiness among Latinos (Figure 7).
Figure 7. Some AP performance gaps have shifted
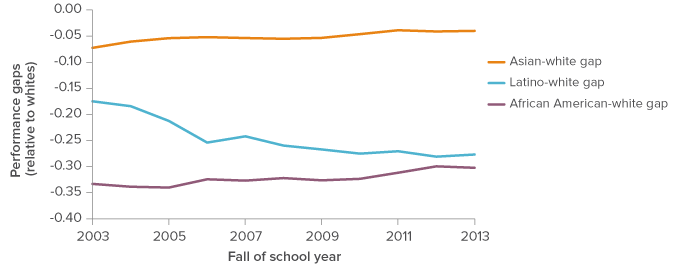
SOURCE: College Board, 2003-13; California Department of Education, 2003-13.
NOTES: Passing rate is calculated by dividing the number of passing exams by the number of exams. Performance gap is the difference in the share of students passing at least one AP exam. Sample includes all public high school students who have taken at least one AP exam in a particular school year. Participation rate is calculated by dividing the number of AP test takers (from the College Board) by the number of 11th- and 12th-graders enrolled (from the California Department of Education). Sample includes all students in grades 11 and 12.
Increased participation in AP exams among underrepresented student groups is a hopeful development. However, in order to take an AP exam, a student must enroll in an AP course. And, as we have seen, AP and advanced science and math course-taking remains low among all student groups.
Looking Ahead
We have seen that, despite the enormous educational and economic benefits of rigorous courses, a large number of California high school students do not complete the a-g requirement or take advanced STEM courses. This raises questions that future research could address. For example, what are the key obstacles to satisfying the a-g requirement? How do district placement policies affect the a-g completion rate? Future research should also go beyond academic preparation and examine non-academic factors that may play an important role in preparing students for college.
As policymakers consider new indicators to include in the high school accountability framework, we offer the following recommendations.
Because the high school graduation rate used for federal accountability purposes tells us little about student readiness for college, it should be in used in conjunction with other indicators. One possibility is to give bonus points for graduates who have successfully completed the a-g requirements. At the same time, policymakers should be aware that a number of high school graduates who did not meet the a-g requirements have nonetheless enrolled in college, and that making a-g completion a graduation requirement would hurt those students, especially when they are pursuing career and technical education (Betts, Zau, and Volz Bachofer 2013; Betts et al. 2016).
Because so few high school students are taking courses that best prepare them for college and beyond, policymakers need to incorporate benchmark course-taking in the state’s new accountability system. Benchmarks such as participation in rigorous math and science courses can help measure student progress over four years of high school. The benchmark indicator needs to include measures of student performance on end-of-course exams because-as we have seen-most of the variation in student outcomes stems from differences in performance, not participation.
A well-designed accountability system should include subgroup breakdowns to address persistent achievement gaps. By focusing on subgroup analysis, schools and districts can provide educational resources to students who need them most. The key challenge is to help schools and districts expand access to college preparatory coursework without leaving lower-performing students behind.
Topics
Access Higher Education K–12 Education