

Key Takeaways
In the last few years, California’s voter registration rate has surged. Two important policy changes—a version of automatic voter registration (AVR) and a change that helps update addresses on file when registrants move across county lines—may explain the surge. We examine how address updates and new registrations have changed in the voter file over the last few years, looking at race/ethnicity and age, and we place California’s changes in a national context to better understand the contributing role of automatic voter registration.
- Address updates and new registrations both increased between 2016 and 2020, to roughly equal degrees. →
- Between the two policy changes, AVR has been far more instrumental at encouraging people to update their addresses, a somewhat surprising outcome given the ease of address updates through the DMV before the state adopted the new AVR system. →
- Address updates and new registrations increased in other AVR states, but less so than in California. This comparison confirms the importance of California’s version of automatic voter registration for the state. →
- Asian American residents have benefited most from address updates and new registrations, while rates for address updates improved slightly more for Black and Latino residents than for white residents. →
These registration reforms have not improved equity around registration in all cases. Middle-aged Californians, rather than young people, have seen the greatest increases in address updates and new registrations, and Black and Latino residents have seen only small increases in new registration rates.
While both approaches lead to greater numbers of voters participating in elections, new registrants—especially those registered through AVR—have less experience with the political system and need more engagement to become regular voters. As a consequence, connecting voters to the political process arguably will demand greater outreach to new registrants than to address updaters.
Introduction
California’s voters in many ways do not represent the broader state population—they are older, wealthier, and more likely to be white, and they hold different opinions on many policy issues (Baldassare et al. 2019; Fraga 2018). California adopted its version of automatic voter registration to minimize registration as a barrier to participating in elections and to help close the gap between those who vote and those who do not.
The law—known as California New Motor Voter (CNMV)—has rightly been credited with boosting the state’s voter registration rate in recent years. It requires many customers at the Department of Motor Vehicles (DMV) to answer questions about voter registration in order to complete a transaction. The state’s voter registration rate has grown roughly 8 percentage points since the state implemented the reform in April 2018, and CNMV may have accounted for more than half that change (McGhee, Hill, and Romero 2022).
It may be natural to assume that the law has mostly drawn in new voters, expanding the electorate to new communities. But CNMV does more than just add new registrants. Many updates to addresses in the registration file now come through CNMV (McGhee, Mehlotra, and Romero 2020), and at least some of those updates may not have occurred without the new policy.
California has also made a less-noted change to the way it handles voters who have moved from one county to another. Californians are now re-registered more or less automatically when they update their address with the DMV or the post office. In the past, Californians moving across county lines would have to cancel their old voter registration and re-register in the new county, and failure to re-register would leave them off the voter file in their new county. Address updates help ensure that voters receive election information, have a more seamless process for voting, and remain listed as active voters.
This report takes a more detailed look at the effects of these recent registration policy changes. While past studies have examined the effect on total registration, this report explores the effect on new registrations and address updates separately, breaks down these differences by race, ethnicity, and age, and compares the California experience to other states.
We show that a substantial portion of the changes in the registration file have been address updates through CNMV that might not have been processed in the past. We also reveal that the equity effects of the policy changes have not been as large as might have been hoped. Finally, we confirm that of the two types of outcomes, new registrants are less engaged with elections and will need more outreach to become regular voters.
California’s Registration Policy Changes
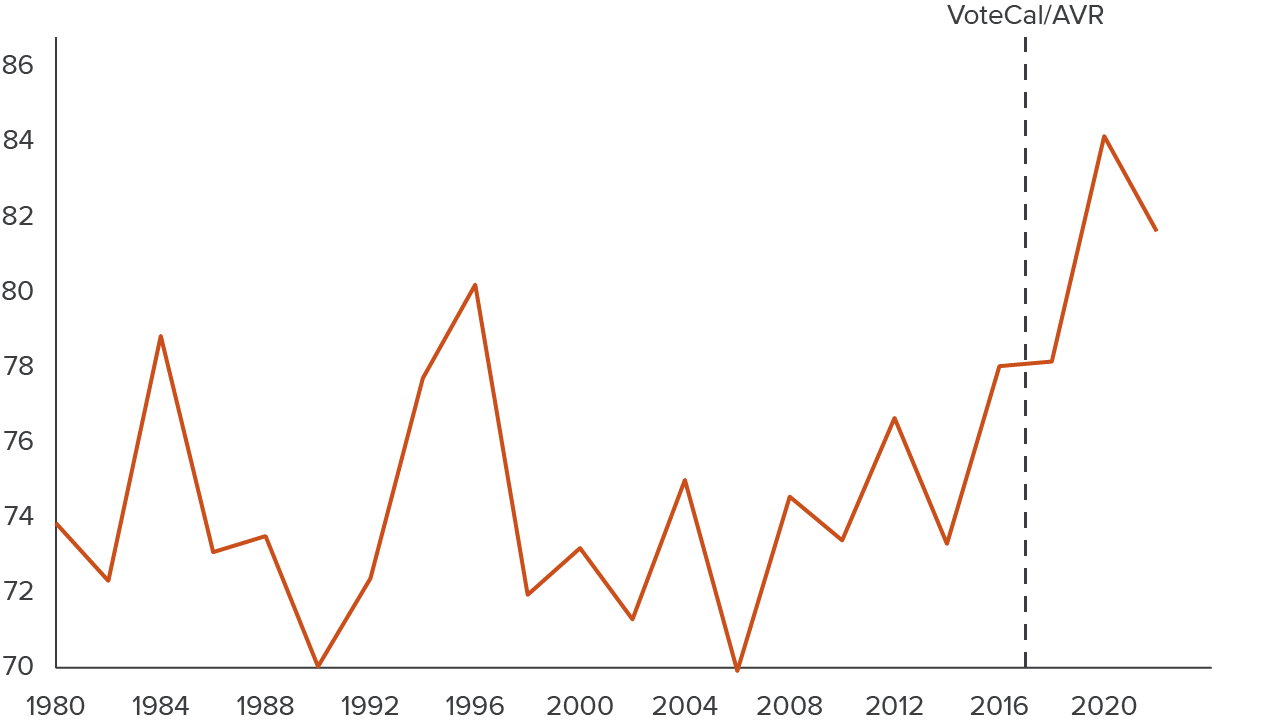
Voter registration swelled in California between the 2016 and 2020 presidential elections, reaching levels without precedent in recent memory (Figure 1). In 2016, the ranking for California’s registration rate languished at 47 out of 50 states; it has since climbed to 41—still quite low, but a considerable improvement.
More Options Are Available for New Registrations
CNMV was a critical development during this time. It went live in April 2018 and immediately became one of the most common avenues for voter registration (McGhee, Mehlotra, and Romero 2020). Federal law had long required the DMV to offer voter registration as part of certain driver’s license or state ID transactions, but customers often did not respond to the registration questions in the California DMV’s paper-based system.
Under CNMV, DMV customers now use an electronic touch screen for applications and renewals of driver’s licenses or state IDs, and that interface compels users to answer registration questions in order to complete the transaction. This ensures that customers do not leave the DMV without giving an answer one way or the other about voter registration.
California also adopted other reforms around the same time to facilitate registration. For example, residents who are 16 or 17 years old can “pre-register” with a dormant record that automatically activates when they turn 18. The state also now has “conditional” registration (called “Election Day” or “same day” registration in other states) that allows eligible residents to register and then vote at in-person voting locations.
While these other developments have been important, they do not replace CNMV in potential impact. CNMV arguably complements pre-registration, while conditional registration can reach only those who have already decided to vote in any given election.
California’s voter registration rate has climbed in the last few years with automatic registration options
Registered as a share of eligible (%)
SOURCE: California Secretary of State
NOTE: The trend line shows the official registration rate as a share of the total voting-eligible population. The vertical dotted line indicates the point at which both the single statewide voter file (VoteCal) and California’s version of automatic voter registration (California New Motor Voter) went live.
Address Updates Now Use a More Seamless System
Separate from CNMV, California has a robust system for catching voters who have moved. When movers update the address on their driver’s license through the DMV, their address for voter registration is updated more or less automatically: on the DMV’s address update form, customers must check a box if they do not want their new address shared with the registrar of voters.
Registrars also send out cards to registered voters before every election and record the ones returned with a forwarding address. That forwarding address starts a process to update the address on file. Voters whose cards are returned without a forwarding address are moved to an inactive file, but they can still reactivate their record by voting a provisional ballot at an in-person voting location. Because California has Election Day registration—which allows eligible residents to register for the current election as late as Election Day—recent movers can update their registration information right before they vote.
California is not alone in maintaining a fairly robust system for catching address updates. In fact, many aspects of this process are mandated by the National Voter Registration Act of 1993, including the “opt out” approach to DMV address updates and a process of proactively identifying recent movers. But California is relatively lenient about letting voters get back on the active rolls after a move, and only the states that offer Election Day registration allow voters to re-register at the polls.
Though this address update system is designed to be comprehensive, before VoteCal there were gaps. The most glaring gap concerned cross-county movers. Links between county files used to be an administrative challenge, because each county maintained its own registration list and there was no unified statewide file. Voters moving within a county had relatively easy options to update their addresses; but those moving across county lines had to cancel their registration in the old county and completely re-register in the new one.
Now county files are linked through VoteCal—a single statewide voter file that went live in 2016—so both types of movers get the same easy process. While the federal Help America Vote Act of 2002 requires all states to have a central statewide registration file, it is not clear how many states have adopted California’s more seamless approach to cross-county moves, since such a proactive cross-county update system is not required by federal law.
This post-VoteCal system might still miss movers who do not update their information with the postal service or the DMV, and who are unlikely to vote without a prompt from voter materials arriving in the mail. If they remain alert to renewing their driver’s license or state ID, CNMV might catch them when the other elements of the address update system have failed. There is no question that many movers use CNMV: 25 percent of address updates now come through the system. The key question is how many of these registrants would have updated their addresses anyway without the new system.
Address Updates versus New Registrants
To understand the impact of CNMV and the change in address update policy, we compare snapshots of the voter file from just before the 2016 and 2020 fall presidential elections—the presidential elections immediately before and after CNMV was implemented. In each case, we have merged the snapshot to a similar snapshot from the last presidential election four years earlier (2012 in the case of 2016; 2016 in the case of 2020). For each pair of matched files, new registrants are those present in the more recent file and not the earlier one. Address updates are registrants present in the earlier file but with a different address. Because both CNMV and the new process for managing cross-county address updates began between these two points in time, the change between the two files should reveal the magnitude of each policy’s effect on the voter rolls.
Were there more address updates and new registrations than before, and if so, which was larger? The simplest way to understand the effect of the policy is to compare the change in the number of address updates to the change in the number of new registrations. This tells us something about the basic dynamics of the voter file.
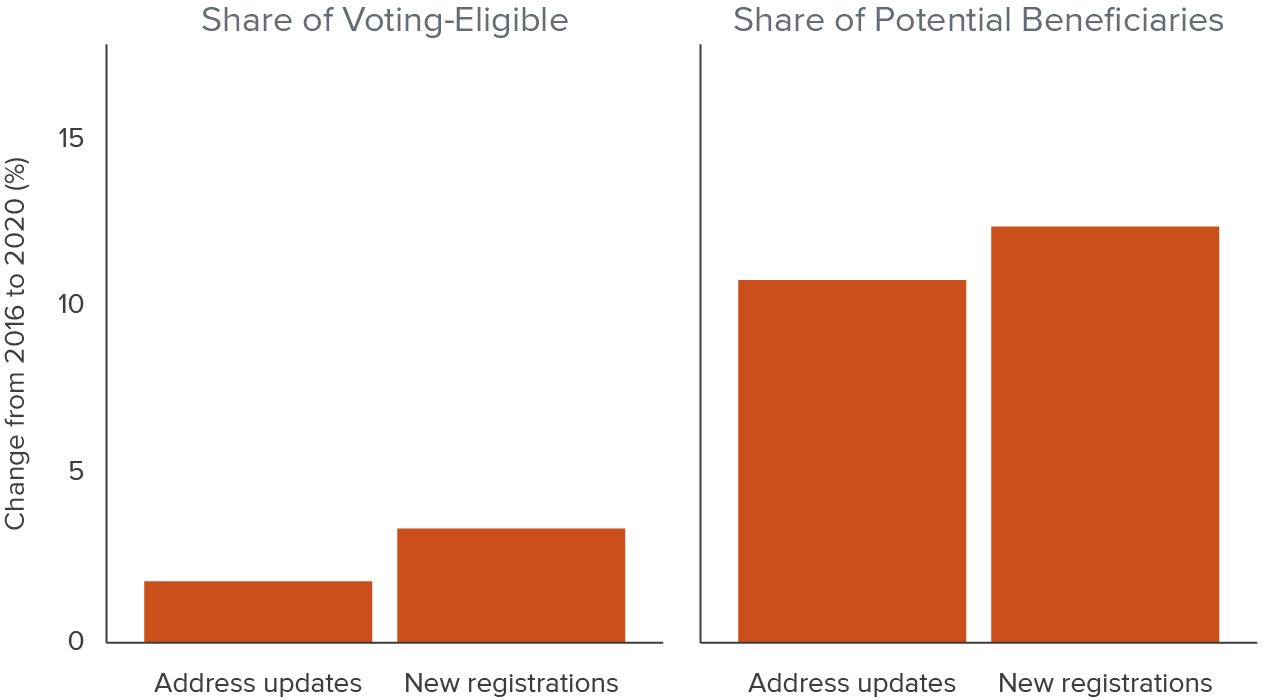
In raw numbers, there were about 1.1 million additional new registrations versus 600,000 additional address updates. As a share of the voting-eligible population (Figure 2), new registrants increased by about 3.4 points from 2016 to 2020, while address updates increased by about 1.8 points. Because there are more new registrants even as a share of the total voting-eligible population, the change cannot be explained solely by a growing eligible population.
Over the same period, the easier process of cross-county address updates under VoteCal appears to have led to more updates across county lines. Cross-county updates as a share of all cross-county moves increased 9.8 percentage points compared to 8.0 percentage points for within-county address updates. However, because the difference between these two numbers is small but the increase in within-county updates is large—and VoteCal had no impact on within-county updates—CNMV may have played a far stronger role in promoting address updates, whether across or within counties.
Estimating the Change as a Share of Those Potentially Affected
Realistically, these registration outcomes affect just a fraction of California’s voting-eligible population. Only those who are not already registered can register for the first time; only those who are registered and change their address can update an address in the registration file. If either the unregistered-but-eligible or the registered-and-moving grew over the period of time we consider here, that alone might account for any increase in new registrants or address updates.
To address this issue we need to calculate new registrations and address updates as a share of the number of people who can potentially experience these outcomes. In the case of address updates, it means estimating the number of Californians registered to vote four years earlier who later moved within the state. In the case of new registrations, it means estimating the number of Californians currently eligible to vote who were not registered in California four years earlier—either because they were not eligible then; were in the state, eligible, and unregistered; or were eligible but not in the state (see Technical Appendix A for calculations). When we use these numbers as our denominators, we gain a better estimate of how well the policy changes have reached those potentially affected by them.
New registrations as a share of eligible-but-unregistered residents (+12.4pp) increased more than address updates as a share of recent movers (+10.8pp), but the gap between them is proportionally somewhat smaller than in the earlier estimates (Figure 2). In fact, while the raw number of address updates in the file grew between 2016 and 2020, the number of registered Californians moving around the state actually declined. Accounting for this decline makes clear that address updates are now much more likely to reach each mover than before CNMV was implemented.
Both address updates and new registrations have greatly increased under California New Motor Voter
SOURCES: Political Data, Inc. (registration data); IPUMS USA (migration, citizenship, age); Centers for Disease Control and Prevention (deaths).
NOTE: “Voting-Eligible” is the citizen voting-age population, a measure of the number of residents who are eligible to vote. “Potential Beneficiaries” are the residents who can potentially realize each outcome: in the case of address updates, it is those who were registered four years earlier and moved within the state in the intervening period of time; in the case of new registrations, it is those registered or eligible to be registered, but who were not registered in California four years earlier (for whatever reason). See Technical Appendix A for further details
Putting California’s Experience in Context
California’s electoral landscape changed between 2016 and 2020 in ways unrelated to the new registration policies. Most importantly, excitement about national politics reached a fever pitch during the Trump presidency. Turnout in both California and the nation as a whole surged from high rates in 2016 to record rates in 2020. Did the state gain new registrations and address updates because voters were more engaged, or did the policy changes themselves have some effect?
Answering this question requires stepping outside California to compare changes in states that did and did not adopt new registration policies. In particular, we compare states that adopted Automatic Voter Registration (AVR) between 2012 and 2020 to those that never adopted the policy. Was the change in address updates and new registrations larger after states adopted AVR? How do the effects look compared to California?
States that adopted AVR saw a disproportionate change in address updates and new registrations compared to those that did not (Figure 3), whether calculated as a share of the voting-eligible population (the two bars on the left) or as a share of potential residents benefiting from the policy change (the two bars on the right).
By their very nature, these numbers account for each state’s initial level of address updates or new registrations and any change that the excitement around the 2020 election might have prompted across all states (whether AVR or not). The estimates also come from a broader statistical model that accounts for effects from the adoption of Election Day registration and online voter registration, as well as the competitiveness of the presidential race in each particular state. (It is worth noting that we see only small effects of these other policies in our statistical models, at least when calculated as a share of the potentially impacted populations in each case.)
Also similar to California, the magnitude of the effect is about the same for both address updates and new registrations. As a share of potential beneficiaries, AVR increased the chance of an address update by about 5.2 percentage points, and the chance of a new registration by about 3.5 percentage points. The difference between those two numbers falls within the margin of error.
As a share of the voting-eligible population, AVR increased both address updates and new registrations by about 1 percentage point. AVR also increased total registration by about 2.4 percentage points (not shown). This suggests a little less than half of AVR’s overall effect on registration could come from new registrations, and about the same amount from address updates.
Automatic Voter Registration (AVR) led to more address updates and more new registrations across all states adopting it

SOURCES: Catalist (registration data); Census Bureau (migration, CVAP); IPUMS USA (migration, citizenship, age); Centers for Disease Control and Prevention (deaths).
NOTE: “Voting-Eligible” is the citizen voting-age population, a measure of the number of residents who are eligible to vote. “Potential Beneficiaries” are the residents who are potentially able to realize each outcome: in the case of address updates, it is those who were registered four years earlier and moved within the state in the intervening period of time; in the case of new registrations, it is those registered or eligible to be registered, but who were not registered in the same state four years earlier (for whatever reason). See Technical Appendices for further details.
The magnitude of the AVR effect across all states is mostly smaller than the effect for California alone, especially when calculated as a share of potential beneficiaries. This may partly reflect the effect of the excitement around the 2020 election, since the numbers in Figure 3 estimate the effect of that excitement and statistically remove it from the results and the California numbers in Figure 2 do not. However, California’s policies also may have been more successful than those in other states. The change California made to the address update policy may help explain its exceptionally large effect in that area.
Equity in Address Updates and New Registrants
More than just adding new registrants or keeping more existing ones on the rolls, the changes to California’s registration policy are meant to make the electorate more representative. The goal is to ensure that historically underrepresented groups are especially likely to be drawn to registration or kept on the rolls through address updates. When we analyzed shifts by race, ethnicity, and age, we found that increased registrations and updates led to only small improvements in representation for historically underrepresented groups.
There are already demographic differences between those who register for the first time and those who are already registered and update an address. The population of all movers who are registered to vote—who form the pool of potential address updates—is substantially younger than the voting-eligible population as a whole. Over half (52%) of these movers are under 35, compared to about a third of the voting-eligible population. But they are disproportionately young and white: Asian Americans make up a smaller share of address updates (9.8%) than of the eligible population (14.6%), as do Latinos (26.5% vs. 30.5%).
The opposite is true of the eligible, unregistered population—which forms the pool of potential new registrants. While they are also disproportionately young (51.6% under 35 vs. 32.0% of voting-eligible population), this group includes higher shares of Latino residents (35.7% vs. 31.9%), Asian American residents (20.7% vs. 14.4%), and Black residents (7.5% vs. 6.3%).
Thus, while both address updates and new registrations could increase representation for young people, only new registrations hold that promise for communities of color. However, address updates are driving much of the effect of California’s registration reforms, which therefore limits the potential equity gains in terms of race and ethnicity.
Of course, California’s registration reforms could alter these underlying demographics by having a stronger effect on underrepresented groups. Figure 4 begins to explore this idea by showing the change in address updates by age. While address updates improved for all ages, middle-aged Californians improved the most, by close to 15 percent.
Across ages, address updates have improved most for middle-aged Californians
Change in movers as a share of potential: 2016 to 2020 (%)

SOURCES: Political Data, Inc. (registration data); Census Bureau (migration, CVAP); IPUMS USA (migration, citizenship, age); Centers for Disease Control and Prevention (deaths).
NOTE: Bars show changes between the 2016 and 2020 presidential elections in address updates as a share of those in each group who were registered four years earlier and had moved within the state in the intervening time. See Technical Appendix A for further details.
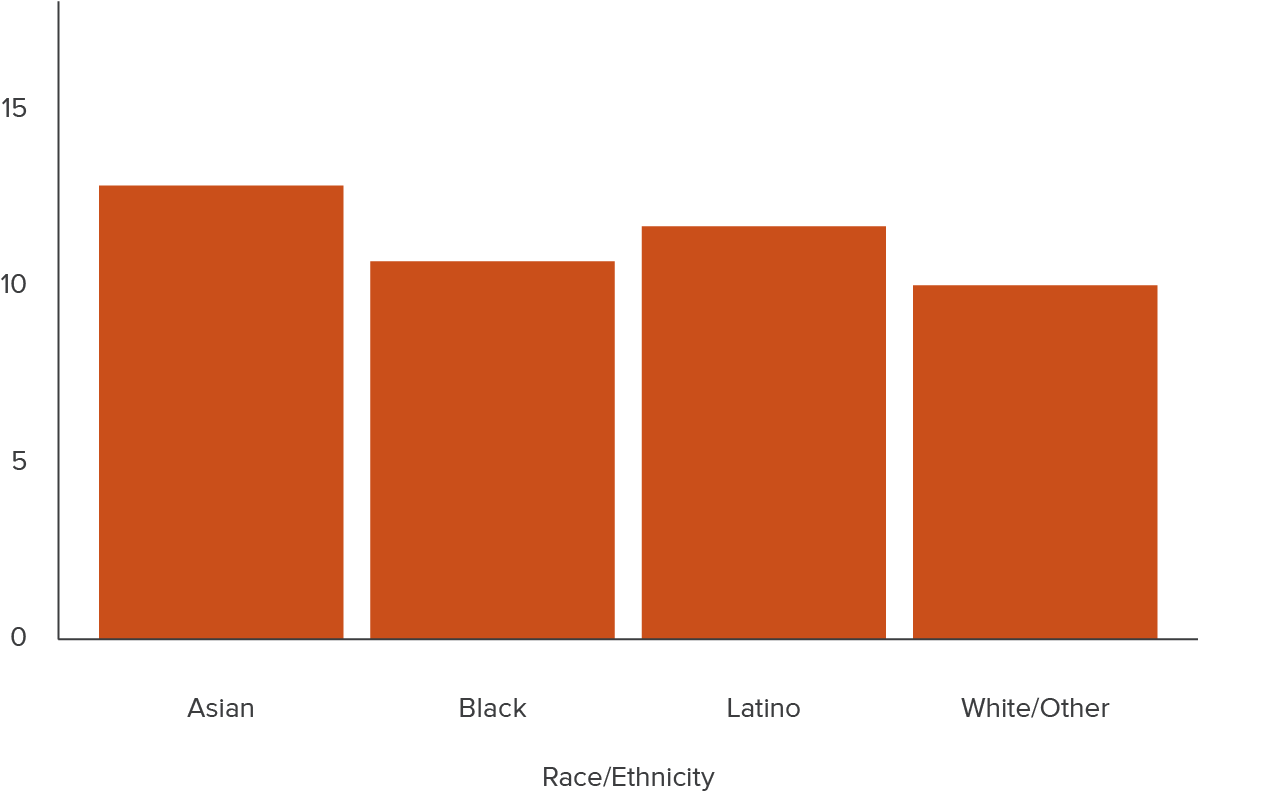
Figure 5 continues with address update changes by race/ethnicity. Gains were distributed somewhat more evenly here—with all groups seeing gains of near 10 percent or more—but the largest improvements were for Asian Americans.
Across races/ethnicities, address updates have improved most for Asian American Californians
Change in movers as a share of potential: 2016 to 2020 (%)
SOURCES: Political Data, Inc. (registration data); Census Bureau (migration, CVAP); IPUMS USA (migration, citizenship, age); Centers for Disease Control and Prevention (deaths).
NOTES: Bars show changes between the 2016 and 2020 presidential elections in address updates as a share of those in each group who were registered four years earlier and had moved within the state in the intervening time. “Asian” includes non-Hispanic Asian Americans, but not Pacific Islanders. See Technical Appendix A for further details.
Figure 6 shows the same changes for new registrations as a share of eligible but unregistered residents. Again, all ages improved, with middle-aged Californians seeing the largest gains of over 15 percent. New registrations for young people under 25 also increased significantly.
Across ages, increases in new registrations have been concentrated among young and middle-aged Californians
Change in new as a share of potential: 2016 to 2020 (%)

SOURCES: Political Data, Inc. (registration data); Census Bureau (migration, CVAP); IPUMS USA (migration, citizenship, age); Centers for Disease Control and Prevention (deaths).
NOTE: Bars show changes between the 2016 and 2020 presidential elections in new registrations as a share of all those in each age group registered or eligible to be registered, but who were not registered four years earlier (for whatever reason). See Technical Appendix A for further details.
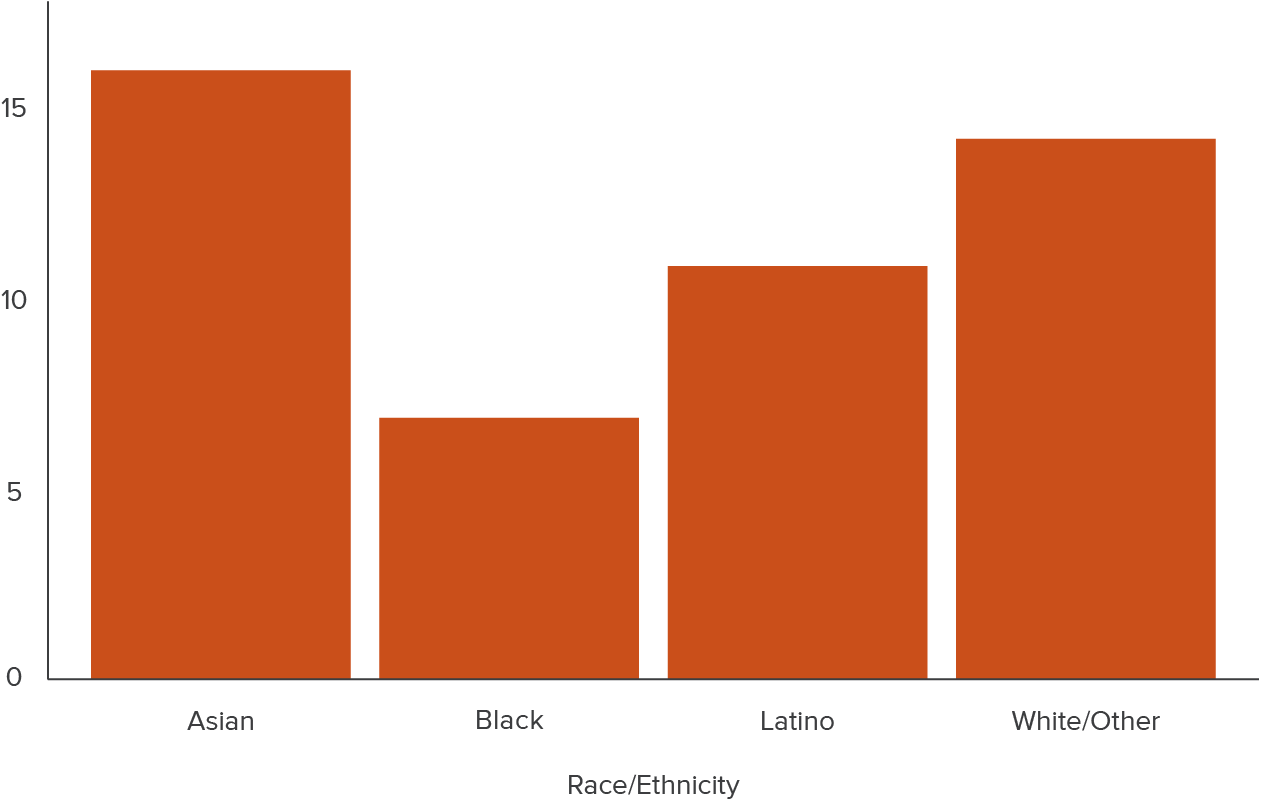
Figure 7 shows the changes by race/ethnicity. New registrations improved among all racial/ethnic groups, but the largest gains were once again for Asian Americans, at over 15 percent. New registrations also increased a considerable amount for non-Hispanic white Californians.
Across races/ethnicities, increases in new registrations have been highest among Asian American Californians
Change in new as a share of potential: 2016 to 2020 (%)
SOURCES: Political Data, Inc. (registration data); Census Bureau (migration, CVAP); IPUMS USA (migration, citizenship, age); Centers for Disease Control and Prevention (deaths).
NOTES: Bars show changes between the 2016 and 2020 presidential elections in new registrations as a share of all those in each age group registered or eligible to be registered, but who were not registered four years earlier (for whatever reason). “Asian” includes non-Hispanic Asian Americans, but not Pacific Islanders. See Technical Appendix A for further details.
While all groups have seen gains, registration policy changes have not always improved equity in the way that might have been expected. Given that Latino and Black residents and young people participate in elections at lower rates, gains in registration needed to be larger than those of older or white Californians in order to correct these past imbalances. That said, the rise in registrations among Asian American residents is consistent with creating greater equity, and the new registrations for the youngest eligible Californians have also improved in the expected way.
It is worth repeating that these numbers do not identify the demographic profile of address updates or new registrants. In particular, new registrants are much younger and more diverse than the registered population as a whole. But that difference stems from the broader demographics of the state itself and would be true without any policy intervention. Policy changes that seek greater equity must accelerate the demographic change beyond what would otherwise occur, and there are only limited signs of such an effect for the changes in registration policy.
Lower Turnout for New Registrants
If the goal of registration reforms is to engage young and diverse Californians with the political system and voting, new CNMV registrants must be a key focus of that effort. New registrants do not have experience with voting. Those who register through CNMV may be especially unfamiliar with the voting process and may not have been expecting to register before they went to the DMV. By contrast, address updates have already been registered and these residents have at least some experience with the process of voting.
As a result, efforts to engage and mobilize new CNMV registrants will need to be stronger to encourage this group to become regular voters. Moreover, while California’s registration reforms have sought to elevate participation for all Californians, new registrants are the harder group to reach. The ability to draw them into the process is a key metric for the success of these reforms, so it is important to understand how effective the recent reforms have been at achieving that objective.
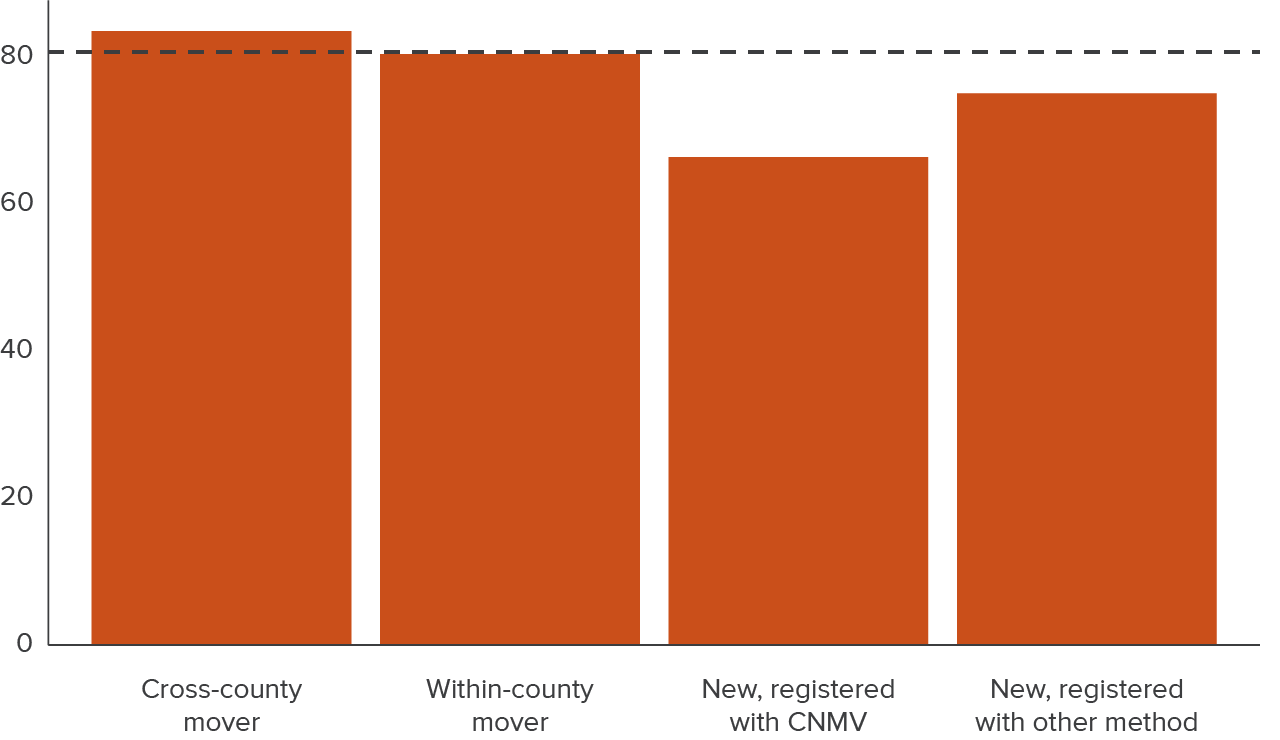
Figure 8 illustrates this point with data from the 2020 presidential election. The figure shows voter turnout for several groups of registrants: address updates across county lines, address updates within county lines, new registrations through CNMV, and new registrations through some other method. The dotted black line is the average turnout rate for the whole state in that election—a rate just over 80 percent.
The cross-county movers impacted by the change to address update policy have the highest voter turnout of any of these groups, reaching over 80 percent. The new CNMV registrants have by far the lowest voter turnout, falling below 70 percent. Average turnout also varies across race/ethnicity and age (not shown), but consistent with other research, the new CNMV registrants always have the lowest turnout within each of those groups (Meier, Romero, and McGhee 2023).
New CNMV registrants have especially low voting rates
Turnout in 2020 (%)
SOURCE: Political Data, Inc.
NOTE: Bars show the average turnout among registered voters for those who used each method of registration. The dotted line shows the average registered turnout for California as a whole in the 2020 election.
Conclusion
California’s recent registration policy reforms are part of a substantial effort over the last 10 to 15 years to ensure that all Californians are drawn in and made part of the elections process. California New Motor Voter (CNMV) has received most of the attention, and largely as a way to bring new registrants to voting. But CNMV did almost as much to maintain registrants accurately on the file as to add new registrants who had not been there before. Between the two types of effects, new registrations bring in Californians who have been most underrepresented in the political status quo and who likely need the most outreach to become regular voters.
CNMV’s strong role in promoting within-county address updates is somewhat surprising, since California already had a robust system for catching such movers. But the state is catching far more within-county movers than it used to, and CNMV is the most plausible explanation. In fact, we find that Automatic Voter Registration (AVR) systems across the country have had a positive effect on address updates, despite the wide variation in the specifics of these systems and each state’s general approach to voter file maintenance. This suggests that the feature all these AVR systems share—a more insistent urging of voter registration through the DMV—has a more general effect of improving address updates as well.
CNMV has often been viewed as a way to make the electorate more representative by drawing in young Californians and Californians of color who do not participate at rates proportional to their share of the eligible population. We find some evidence of this effect within California, with especially large increases in new registrations for Asian Americans and young people. But new registrations for Black and Latino residents have grown less, and address updates for young people have not grown as much as for middle-aged Californians. It is possible that Black and Latino residents are less likely to have a driver’s license or state ID and so have less exposure to CNMV. Moreover, the roughly even mix between address updates and new registrations can limit the equity effects from CNMV, as communities of color are more strongly represented among the unregistered but eligible population.
Our findings hold two important implications. First, the balance of address updates and new registrations, as well as the demographic pattern of the effects, should calibrate expectations about the pace of change from registration reform. The growth in address updates is a significant policy success, but by its very nature it helps to maintain the existing voter file rather than expand it to new communities.
To be clear, each address update represents a voter who might not have voted or even remained on the file otherwise, and so each also contributes to a broader goal of making voting available to every eligible resident in the state. Nor do address updates and new registrations compete against each other; both have grown as a consequence of the changes in registration policy.
Rather, our point is that a simple look at changes in total registration masks the fact that much of the impact of the reforms has been to maintain the voter file as it is. This should encourage a discussion about how to promote more new registrations. California could extend something like the CNMV approach to more agencies and programs. These might include Covered California (health insurance exchange), Medi-Cal (California’s implementation of Medicaid), CalWORKs (California’s implementation of cash assistance), or the California Earned Income Tax Credit. There might be modifications to CNMV itself that could promote more new registrants through that process as well.
Second, new registrants are generally less familiar with the electoral process, so they require more outreach to ensure they turn out to vote. New CNMV registrants voted in 2020 at rates far below the state average. The difference was on a par with the gap between turnout among seniors and registrants under 25. Extra efforts to mobilize new CNMV registrants are especially important given this low participation rate. More research is needed to understand how new CNMV registrants feel about voting and participation and what might be holding them back from greater engagement.
Another recent reform allows 16- and 17-year-olds to “pre-register” with a voter record that lies dormant until they turn 18. To the extent that this pre-registration happens through CNMV, it might also be an opportunity to take a more systematic approach to alerting these newly registered students about their registration in their high school course work, and to prepare them for participation.
CNMV has helped elevate California’s voter registration rate. But its impact can be broadened and accelerated, especially among the underrepresented communities who were an important target for the reforms in the first place.
Topics
Political LandscapeLearn More

California’s Voter Turnout Sank in 2024

Who Is Switching Political Parties in California?

Video: Do Registration Reforms Add New Voters or Keep Californians Registered?
Commentary: Change Automatic Voter Registration Process to Track Equity in Elections

Improving California’s Automatic Voter Registration

Implementing Automated Voter Registration in California
