- The share of felony arrests dropped after Prop 47.
In November of 2014, Prop 47 reclassified many lower-level drug and property offenses from felonies to misdemeanors. Partly as a result of this policy change, the felony proportion of arrests dropped to 26% for the next two years. Before this shift, the share of arrests for felony offenses had increased for decades, from 24% of all arrests in 1980 to 34% in 2014. - Violent offenses were the largest category of felony arrests.
In 2016, arrests for violent crimes constituted the largest share (37%) of felony arrests statewide. Most violent felony arrests were assaults (75%), followed by robberies (14%). All other arrests for violent felony offenses, including rape, kidnapping, and homicide, each constituted less than 3% of the statewide total. - Property crimes were the second most common felony arrest.
Felony property arrests constituted the second-largest group, with 19% of all felony arrests. Theft (37%), burglary (31%), and motor vehicle theft (25%) accounted for nearly all arrests for felony property crimes. Remaining felony arrests covered warrant arrests (14%), drug arrests (11%), and other arrests (18%). - African Americans are disproportionately arrested for felony offenses…
In California, the felony arrest rate of African Americans was 3,229 per 100,000 in the population, or three and a half times the overall rate (897). The rate for Latinos (945) also exceeded the state average, while rates for whites (751) and Asian Americans (198) were lower. Overall, the felony arrest rate of African Americans was 4.3 times the white rate. This level of discrepancy extended to arrest rates for violent and property felonies, for which African American arrest rates were 5.3 times and 4.0 times higher than the white arrest rate, respectively. - …but African Americans are twice as likely as whites to be released without charges.
Nearly 9% of African Americans were released after being cited or booked following an arrest for a violent felony, while about 5% of whites were released. For property felonies, 6% of African Americans were released after arrest compared to 3% of whites. That is, in a greater share of felony arrests involving African Americans, charges are not filed with the county district attorney. - The highest felony arrest rates occur in sparsely populated regions.
The four most sparsely populated regions of California posted the highest felony arrest rates in 2016—each with more than 1,000 arrests per 100,000 in the population. The rate in the Northern region was highest, at 1,424. Conversely, the four most densely populated regions had the lowest felony arrest rates, with Orange County posting the lowest rate (659).
Rural regions had higher felony arrest rates in 2016
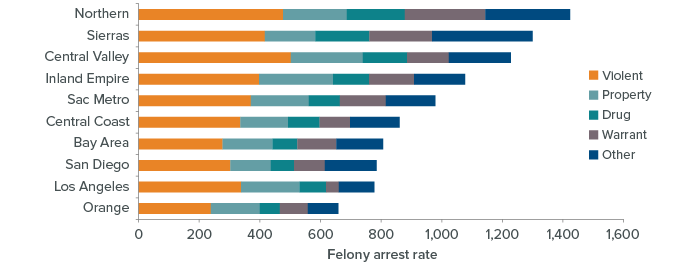
SOURCE: Authors’ calculations based on California Department of Justice’s Monthly Arrest and Citation Register and California Department of Finance Population Data, 2016.
NOTE: Arrest rates calculated per 100,000 residents.
- Greater racial/ethnic discrepancies appear in densely populated regions.
The San Francisco Bay Area (6.4) and Orange County (5.8) had the largest disparities between African American and white felony arrest rates in 2016. The less-populated Sierra and Inland Empire regions had the smallest disparities (2.8 and 3.0). This pattern holds when comparing ratios of Latino to white felony arrest rates—Orange and Los Angeles Counties showed the strongest discrepancies, while in the Northern region whites were arrested for felonies at higher rates than Latinos.
Disparities in felony arrest rates appear most severe in the most populous regions

SOURCE: Authors’ calculations based on California Department of Justice’s Monthly Arrest and Citation Register and California Department of Finance Population Data, 2016
.
NOTE: Maps show arrest rates per 100,000 residents in each of the relevant demographic groups, divided by arrest rates for whites.
Topics
Criminal Justice Population