
Law enforcement funding comes mainly from local sources.
- California cities spent more than $16.4 billion on policing in the 2023–24 fiscal year, while counties spent $8.4 billion, and the state spent $3 billion on the California Highway Patrol (CHP).
- Police services are the largest category of city spending (over 14% on average statewide); fire services are the next largest spending category (6.2%). However, there is substantial variation in spending on police services across cities.
- The average officer base salary in 2023 was approximately $110,000, but it varies significantly across the state, with agencies in rural counties generally having lower salaries.
- Funding for city and county police protection comes from several sources: property, business, and sales taxes; federal and state grants; local fees and fines; and voter-approved general and special sales taxes.
Staffing levels ticked up again in 2024, but they remain lower than in 2020.
- In 2024 (the latest year of data), there were over 119,400 full-time law enforcement employees in California; roughly 77,200 were sworn law enforcement officers (with full arrest powers) and about 42,200 were civilian staff.
- The number of officers per 100,000 residents declined steeply in the wake of the Great Recession (2007–09) and has remained at or close to these low levels ever since.
- From 2022 to 2024, the state gained over 1,000 sworn and about 2,400 civilian staff. The increases come after two years of large decreases in both. From 2020 to 2022, the state lost nearly 3,600 sworn and over 1,200 civilian staff. Sworn staffing levels are down by 3.2% compared to 2020.
The number of patrol officers per 100,000 residents continues to be historically low
Officers per 100,000 residents
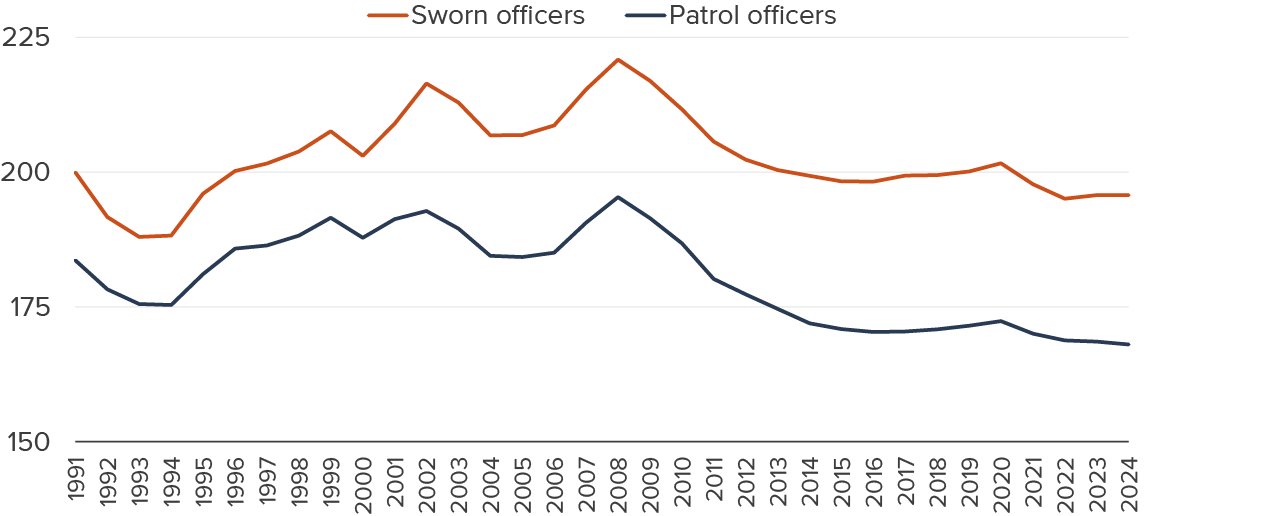
SOURCE: Authors’ calculation based on California Department of Justice’s Law Enforcement Personnel Survey and California Department of Finance Population Data, 1991–2024.
NOTES: The patrol officers category includes all sworn law enforcement personnel who are not jail employees. Most of these officers patrol highways and neighborhoods, but the category also includes police chiefs, supervisors, and detectives. Data unavailable before 1991.
Almost half of California’s sworn officers work for municipal police departments.
- Of all sworn officers, about 48% were municipal police officers, while 39% were county sheriff deputies and 9% worked for the CHP. About 4% were employed by other agencies, such as university, port, transportation districts, and the California Department of Parks and Recreation.
- Of the roughly 77,200 sworn officers in 2024, about 66,200 were patrol officers and around 10,900 worked in county jails. Of all sworn officers, 86% were male. Comparatively, there were roughly 32,300 civilian staff in municipal police departments, CHP, and other non-jail settings, and over 9,900 civilian staff in jails. Of all civilian staff, 38% were male.
- In 2024, roughly 46% of sworn officers were white, while 40% were Latino, 6% were Asian, and around 5% were Black. The average age of an officer was around 41 years old.
The share of Latino officers grew over the last decade, while the white officer share declined
Percent of overall officer count
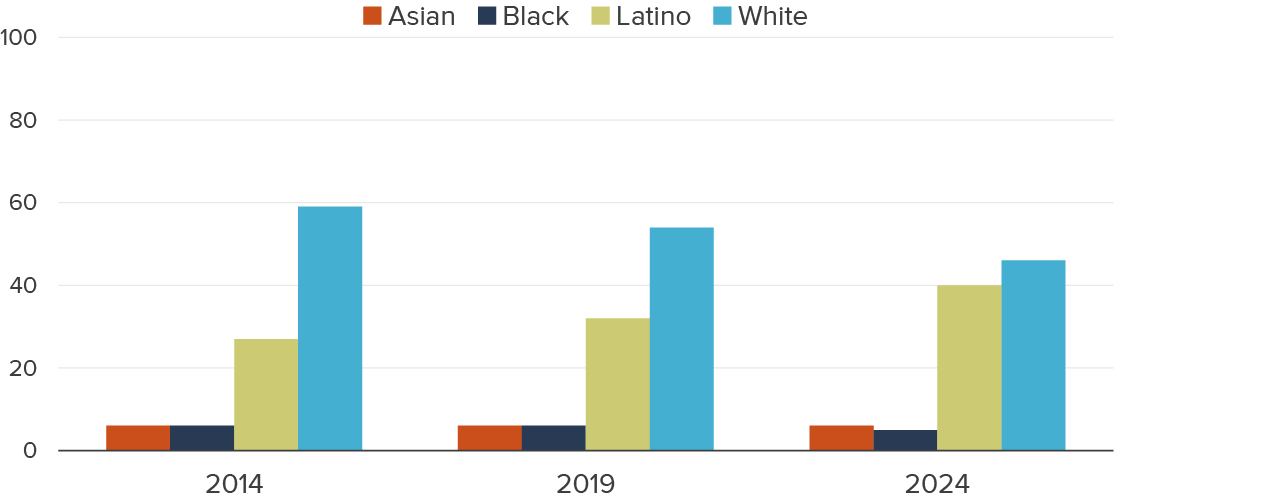
SOURCE: POST Officer Demographics Data Warehouse.
NOTE: The four race/ethnicity categories will not add to 100 percent, as we exclude several smaller race/ethnicity categories contained in the POST data.
Identifying equitable, cost-effective ways to prevent crime is vital.
- Recent research finds that increased police staffing can help prevent crime: each additional officer results in 3 fewer violent crimes and 4.2 fewer property crimes per year, primarily through deterrence. Research also estimates that the crime-reducing benefits of hiring an additional police officer exceed the average budgetary cost.
- While research finds that increased staffing results in a greater reduction in homicides with Black victims than those with white victims, it also finds increases in arrests for lower-level offenses such as liquor violations and disorderly conduct that disproportionately involve Black residents.
- Concerns about police practices and staffing could prompt communities to explore other programs and strategies that may also prove cost-effective. Possible approaches include preventive interventions among at-risk youth, people with behavioral and substance use challenges, and other targeted groups. The use of policing technologies, such as DNA databases, license plate readers, and drones, may prove successful as well.
Topics
Criminal JusticeLearn More
Report · April 2026
Understanding Trends in Law Enforcement Staffing

Report · March 2026
Have Racial Disparities in Law Enforcement Stops Narrowed?

Blog Post · June 4, 2025
How Is California Handling Allegations of Police Misconduct?

Blog Post · May 15, 2025
A Closer Look at Behavioral Health Crises and Police Responses

Blog Post · February 14, 2023
California’s Notable Declines in Law Enforcement Staffing

Blog Post · February 25, 2022
Historic Law Aims to Improve Police Accountability and Transparency

Report · October 2021
Police Use of Force and Misconduct in California
