

Key Takeaways
Funding for California’s schools has reached record-high levels, although the pandemic has exacerbated longstanding inequities in student outcomes. As policymakers grapple with questions around how much to fund schools and how that funding should be distributed, existing research can provide insights into where and how to use additional funds to improve outcomes. In this review of the research, several key themes emerge:
- Several years of sustained spending increases improved student outcomes. A robust body of research shows that across a variety of outcomes such as test scores, graduation rates, and college attendance, student performance improves with greater spending. Over the long term, students gain important benefits on economic outcomes such as wages. Benefits tend to be greater for lower-income students and districts. →
- How—and to whom—spending is targeted matters. Policies that target district characteristics may not fully address gaps in spending and student outcomes, depending on how funding is targeted across students and schools within the same district. In California, spending is higher for low-income, Black, and Latino students—but current spending progressivity is not enough to close existing test score gaps. →
- The labor market for educators may constrain spending policies and create tradeoffs. Often, high-poverty schools rely on lower-paid and less experienced teachers, but have smaller class sizes. Large-scale policies to increase spending on new staff—such as the class size reduction of the 1990s—may adversely affect experience and credentials over the short run, limiting potential benefits per dollar. →
- Cost pressures in California schools affect the efficiency of funding. Declining enrollment, rising employee benefit costs, and staffing shortages in some areas limit how efficiently funding translates into better school resources. →
Introduction
California serves roughly 6 million K–12 students, spending $61 billion in state and $36 billion in local funding annually to operate them. After several years of declining or lagging funding in the aftermath of the Great Recession, school funding increased substantially in California. It is now at record highs, over $22,000 dollars per student in 2021–22, including federal stimulus funding, and is projected to be around $21,000 per year in 2022–23.
Significant new sources of state and federal funding—provided to help schools respond to the COVID-19 pandemic and provide supplemental services—mean that, for the time being, California’s K–12 system has more financial capacity than at any point in its history. Per student, current K–12 spending (i.e., staff, materials, operations, but not capital) in California has quickly risen since the depths of the Great Recession, recently surpassing the average in other states for the first time since 1986–87 (Figure 1 reports nationally comparable data up to 2018–19, the most recent available year; see Technical Appendix Figure A1 for a longer time series back to 1967 using district-level data).
Similarly, test scores in California have lagged behind other states, but grew faster than the rest of the nation in the 1990s and 2000s before stagnating in the 2010s in some grades and subjects, in the aftermath of the Great Recession. Growth since has been inconsistent across grades and subjects (Technical Appendix Figures A2–A5).
California K–12 spending per student has grown 60 percent since 1987, but has been lower than in other states most years

SOURCES: National Center for Education Statistics (F-33 survey); author’s calculations.
NOTES: Average current per-pupil spending at the state-level. Average for the rest of the nation is weighted by student enrollment. Expenditures are inflation-adjusted to June 2021 dollars using the CPI-U.
Despite expanded fiscal capacity, the California K–12 system has faced an array of challenges. The COVID-19 pandemic led to school closures, reduced instructional time, and uneven access to remote learning. Preliminary data on the pandemic’s effects suggest lower test scores, widening disparities across racial and income groups, and higher rates of social and emotional distress (Lee 2020; Little Hoover Commission 2021; Pier et al. 2021). The infusion of state and federal funding and the return to safe in-person learning should help relieve these challenges.
However, other demographic and financial pressures will pose difficulties over the coming decade. Enrollment is projected to further decline across most of the state, meaning many districts will be forced to make difficult downsizing decisions year after year as the number of children recedes from its plateau over the past decade and a half (California Department of Finance 2021). Rising health and benefit costs will continue to increase staffing costs (Koedel and Gassman 2018; Krausen and Willis 2018). Staffing shortages in key subjects add further difficulty, especially in lower-income schools and districts (Darling-Hammond et al. 2018).
State policymakers find themselves with greater tax revenues and greater capacity to spend more on K–12 education. Furthermore, longstanding disparities by race, income, and language motivate calls to improve school resources, perhaps by paying higher salaries, reducing class sizes, providing wider access to technology, or by offering additional services to students and families. What insights does the existing research provide into using additional funds to improve student outcomes? Policymakers face difficult questions and tradeoffs when crafting school funding policy, but unfortunately much of the research has been inaccessible to a policy audience. For many years, academic debates on the questions have centered on whether “money matters,” providing little consensus or actionable insights useful for policymakers.
In this report, we summarize the key takeaways from recent research on the effects of school funding, providing a discussion of the findings, nuances, and unanswered questions. We examine quantitative research from around the United States—both nationally and in specific states—and provide additional discussion of some of the key research on school spending in California.
A Brief History of School Funding in California
For most of California’s history, public schools were locally funded—primarily through property taxes—with some supplemental aid from state and federal governments. Given large differences in property wealth and revenue-raising capacity across districts, lower-income areas generally spent less on public education than wealthier areas.
This school funding system was found to be unconstitutional by the California Supreme Court in 1971 in Serrano v. Priest. The court ordered the state legislature to devise a system that would equalize funding across districts. The state responded by capping the amount of per pupil revenue each district could receive, effectively equalizing funding across districts.
After Proposition 13 (1978) capped local property tax rates and shrank the funding available for local public schools, the burden of school funding shifted to the state government. In 1988, Proposition 98 set minimum state spending requirements for K–12 education; the state must spend roughly 40 percent of General Fund revenues in its public schools (including community colleges). Most school district funding came through Prop 98 in the form of “revenue limits”—a base amount of per pupil funding needed for school operations—for each district. Districts with local revenues that fell short of their limits received additional state funding to fill the gap.
In addition, the state and federal governments provided restricted funding through categorical programs. These programs supported services such as teacher professional development and special education. By the onset of the Great Recession, roughly 20 percent of state revenues were allocated through dozens of categorical programs, which placed restrictions on how the money was to be spent. One notable category of restricted funding in California was the K–3 Class Size Reduction (CSR), enacted in 1996. CSR allocated roughly $1 billion annually statewide for districts to lower class sizes to 20 or fewer students per teacher in kindergarten through third grade.
The Local Control Funding Formula (LCFF) overhauled California’s school finance system in 2013–14. Under the LCFF, districts receive a base grant per student, and get additional funding based on their share of high-need students: low-income, English Learner, and/or foster youth. In addition, many categorical aid programs were consolidated or eliminated, giving districts more spending flexibility. Under LCFF, districts now have greater local control over spending decisions than before, with the expectation that supplemental funding for high-need students be spent to improve services for these students.
School Funding Levels and Student Outcomes
Debates over school funding often have centered on whether “money matters” in education—not whether schools can operate without any resources, but rather, whether additional funding would lead to improved outcomes. The origins of this debate go back decades, at least as far as the 1966 federal report on the “Equality of Educational Opportunity,” also known as the Coleman Report (Coleman et al. 1966). The report gathered data on roughly 600,000 students across 3,000 schools, concluding that school resources played little role in student achievement independent of family background.
In the decades that followed researchers continued to study the relationship between school funding levels and student performance, with little consensus (e.g., Hanushek 2003; Krueger 2003). Given the lack of a consistent relationship between spending and outcomes, many education policy debates shifted towards a focus on more efficiently utilizing existing resources. For example, so called “accountability” policies, such as No Child Left Behind, provided incentives for schools to perform better. Research also quantified the importance of teachers, and how teacher quality—measured by effectiveness at improving test scores—varies significantly, motivating calls to improve teacher quality (Hanushek et al. 2011; Chetty et al. 2014).
The historical lack of research consensus may in part reflect difficulty determining cause and effect when studying school funding. Funding is determined by a complex interaction of local, state, and federal rules, and reflects the socioeconomic conditions and preferences of nearby residents. Such relationships create confounds—factors that obscure a true relationship when trying to compare two things. In general, confounds have made it very difficult to uncover the actual effects of school funding on student outcomes. Past research was generally unable to account fully for potential outside factors related to both spending and outcomes (Jackson 2018), likely contributing to the lack of consensus. However, more recently, a strong consensus has emerged in the research: that increased school spending improves student outcomes.
Research Shows that Higher Spending Improves Student Outcomes
More recently, a robust body of research on school spending has emerged that uses higher-quality data and more convincing methods to establish cause and effect. A clear consensus has emerged from this research: increasing school spending improves student outcomes along a variety of outcomes including test scores, graduation, college attendance, adult earnings, and intergenerational mobility (see Jackson and Mackevicius [2021] for a review). Many of these studies rely on so-called “quasi-experimental designs”—or “natural experiments”—that provide compelling estimates of the causal effect of a change in school spending.
State-level finance reforms benefit students in the short and long run
To examine the impact of increased school spending, many researchers have studied state-level school finance reforms. These reforms were most often court-ordered mandates directing states to correct funding inequities resulting from differences in local property tax bases across districts.
Serrano v. Priest (1972) in California was the first major decision, spurring dozens more cases over the next five decades. Since 1990, over half of states have had at least one significant reform (Lafortune, Rothstein, and Schanzenbach 2018).
School finance reforms generally imposed discrete and significant changes in a state’s school finance system. These changes led to varying spending changes for students in different districts within a state, or born in different years. The reforms offer a set of natural experiments for researchers to isolate spending changes due to the timing and mechanics of reforms. As such, the reforms provide some of the most compelling national evidence on school spending effects.
In national studies, increased spending under these reforms led to a number of positive outcomes. Test scores improved, graduation rates rose, and students were more likely to pursue and complete college; on the economic side, students commanded higher wages as adults, economic mobility expanded across generations, and in some districts, house prices rose. On average, these reforms led to increased spending in high- and low-income districts, and therefore provide evidence that is relevant to statewide spending policies at scale.
Among the most notable of these results is in Jackson et al. 2016, who examine the impacts of spending on student outcomes over the long run. They find that a 10 percent increase in school spending for 12 years led to 7.7 percent higher wages and a 9.8 percent increase in family income when students reached adulthood. Higher spending also led to higher rates of high school graduation, more years of completed education, and lower incidence of adult poverty.
Higher spending that capitalized into higher local housing prices is another notable result (Bayer, Blair, and Whaley 2021), with property values going up especially when spending increases went to teachers and other staff. Such estimates imply that real estate markets value spending increases in local schools more than the taxes needed to fund them. In economic terms, this suggests that nationally, district spending is inefficiently low on teacher and staff salaries.
In state-level studies, specific reforms also tend to show positive effects. Studies of Michigan’s 1994 reform provided evidence that spending improved student academic performance, graduation, and college attendance (Papke 2008; Roy 2011; and Hyman 2017).
California’s LCFF reform brings more recent and relevant evidence to California school spending debates. The switch to a weighted student funding formula led to spending increases in districts with more low-income and high-need students (Lafortune 2019). In the first four years of the reform, LCFF-induced spending increases led to higher graduation rates and 11th-grade test scores (Johnson and Tanner 2018). Concentration grant spending—additional funding for districts with high concentrations of student need—led to higher test scores in grades 3–8 (Lafortune 2021). Though LCFF was passed in 2013–14, it was not fully funded until 2018–19; more research will be needed over the coming years to understand the full effects of California’s school finance overhaul.
Some critics have argued that school finance reforms are not an ideal natural experiment. For example, positive outcomes could reflect benefits gained from other policy changes in schools or communities around the same time, or they may reflect the political “conviction” a state’s populace has around improving its schools rather than the effect of any realized spending changes (e.g., Greene 2020).
However, these reforms led to discrete increases in spending for targeted districts in a state—with no significant changes in other factors related to performance like demographics, socioeconomic conditions, or other public safety net spending (Liscow 2018; Lafortune et al. 2018, Candelaria and Shores 2019). The consistency of results across states, time periods, empirical methods, and outcomes reinforce confidence that these reforms provide useful evidence on the impacts of school spending.
Situations other than reforms influence spending and outcomes
Other settings beyond state-level reforms have been studied to identify the impact of spending on outcomes (see Table 1 for an overview of the research, grouped by study type and finding). For example, close elections in school bond and tax referenda are one scenario that can generate natural experiments around spending changes. Quirks or discontinuities in state funding formulas are another, as the formulas may allocate more or less per-pupil dollars to some districts in a seemingly random fashion. Alternatively, housing market dynamics can interact with school funding mechanisms, leading to varying funding changes when property values change, due to the specifics of a state’s funding formula.
These natural experiments document stronger student test scores, higher graduation rates and educational attainment, and even reduced criminality. Furthermore, when researchers examined how the spending declines of the Great Recession affected students—leveraging differences in spending cuts across districts—they found a negative impact on student outcomes (Table 1).
In quasi-experimental studies, spending has positive short- and long-run impacts on key student outcomes

NOTES: Unless otherwise indicated, studies are national. Not all school spending studies using quasi-experimental methods are shown; capital spending studies are discussed in further detail below. For a more complete review, see Jackson and Mackevicius (2021).
Higher funding leads to better test scores, according to meta-analysis
When Jackson and Mackevicius (2021) synthesized findings across studies, they found robust consensus among causal studies that examined relationships between funding and outcomes: most studies indicate that funding had positive effects on student outcomes. Because the tests that students take vary, researchers often use standardized scores to compute the impact, based on standard deviation units.
To do this, researchers set the average score to zero, and measure impacts in standard deviation units. When a student scores one standard deviation above or below the average, it implies that student is 34 percentile points above or below the mean. In other words, a student scoring one standard deviation above the average scores higher than 84 percent—or lower than 16 percent—of their peers. Standardized in this way, Jackson and Mackevicius find that $1,000 more in school spending for four years leads to a 3.5 percent of a standard deviation increase in test scores, and a 5.4 percent of a standard deviation increase in educational attainment.
Positive effects are generally larger for operational spending—that is, spending on teachers and classroom materials—than for capital spending. For capital spending on school facilities, Jackson and Mackevicius find positive and significant effects after several years, and argue that individual studies do not have sufficient statistical power to detect what appear to be small but meaningful impacts.
Overall, the meta-analysis offers several notable takeaways for policymakers. First, higher levels of school spending improve student test scores and educational attainment. Of course, this need not mean that all spending matters equally, or that current uses of local, state, and federal funding are efficient, or “optimal.”
Second, much of the research considers unrestricted spending increases. That is, districts tend to use additional funding to purchase school resources—smaller class sizes, more experienced teachers, more support staff, better materials, and so on—in ways that often improve academic outcomes such as test score and long-run adult outcomes such as wages, even when the extra funding has no strict incentives or accountability pressure.
While better incentives or oversight might help districts spend more efficiently or equitably, the research in this area is more limited. Some studies indicate that accountability pressures, such as those under No Child Left Behind, improved student test scores (e.g., Dee and Jacob 2011).
Finally, the positive effects occurred across many contexts and many years, which should reassure policymakers that effects could be generalized to current contexts. Some experts caution that estimates from studies of prior spending increases may be less relevant to future ones, reflecting diminishing returns from a higher spending level (e.g., Hanushek 2015). However, Jackson and Mackevicius (2021) show that the size of the effects for more recent student cohorts are similar per dollar to older ones—evidence does not yet suggest that we have reached a point of diminishing returns, on average.
Greater funding has the most impact for low-income students and districts
In many individual studies, increased funding had larger impacts for students from low-income families and/or districts. For example, Jackson et al. (2016) found larger wage gains for low-income students: those who grew up in families earning 200 percent of the federal poverty line or less saw wage gains of nearly 10 percent in adulthood from $1,000 more per year in school spending, compared to 6 percent for higher-income students.
Overall, Jackson and Mackevicius (2021) report that nearly 75 percent of studies show larger effects among low-income students and/or districts than higher-income ones. On average, estimates for test score effects are nearly twice as large for low-income than higher-income students (4.9% of a standard deviation per $1,000 in annual spending vs 2.6%), but this difference is not statistically significant as too few studies separately identify effects for both student subgroups. Thus, the evidence seems to suggest that dollar-per-dollar spending on lower-income students may yield larger academic improvements than spending on higher-income students.
Capital spending produces more mixed results
In studies that focused on school capital spending—spending on the construction and renovation of school facilities—findings are more mixed, ranging from positive effects to no effects. When Jackson and Mackevicius (2021) aggregated studies, capital spending appeared to improve test scores after several years; overall, the impact on student outcome may be smaller dollar for dollar—and may vary more across contexts. For example, effects likely depend on prior building conditions, environmental contexts, and grade level, as well as what the expenditure goes towards (e.g., instruction space, technology upgrades, or athletic facilities).
When studies look at specific districts or at specific facility issues, evidence is stronger that funding has quantifiable, positive effects. Large, urban districts that engaged in large-scale projects to construct new schools and renovate existing ones had notable positive effects on test scores and attendance (Neilson and Zimmerman 2014 in New Haven, CT; Lafortune and Schönholzer 2022 in Los Angeles Unified).
Air conditioning and climate control is one aspect of school facilities that has been linked to student learning, as air conditioning mitigates the negative impacts of hot school days (Park et al. 2020). More generally, building conditions have been linked with student performance on average, but this link varies across specific facility features, grade levels, and subject areas (Gunter and Shao 2016).
Conversely, findings of positive effects are more limited in statewide or national studies. Several have examined local capital spending shocks, often driven by bond elections, finding small and/or statistically insignificant effects on test scores (see Table 1). On the other hand, there are some statewide studies that find positive effects (e.g., Hong and Zimmer 2016; Conlin and Thompson 2017; Rauscher 2020). In particular, Rauscher (2020) studies local capital bonds in California, finding positive effects specifically for low-income students. Similarly, Cellini, Ferreira, and Rothstein (2010) study California school bonds, and while they do not conclude that test scores rose after the bond was passed, they did find higher home prices, which suggests that school quality improved beyond test scores. Importantly, these two studies suggest that additional capital spending may have greater effects in California than in other states, perhaps due to underlying building conditions, funding constraints, or differences in student populations.
What should policymakers make of these variable effects? For one, the research on this question is not settled. It is difficult to quantify the impact of facilities funding because this spending is infrequent and any impacts must be measured over a longer timeframe. Most studies cannot link capital spending to specific schools or to changes in conditions. Thus, it is difficult to detect individual impacts from the districtwide level; even a very small districtwide change could have a sizable impact on the affected students. For example, building a new school for 500 students in a district of 5,000 would have an impact on the outcomes of only 10 percent of students.
Second, effects likely vary across educational contexts facility conditions, and the specific facility component(s) in which schools invest. It is not hard to believe that improving buildings in more serious need of renovation/replacement may have a larger impact. Also, researchers can generally observe only certain outcomes, like test scores. Spending on school facilities also goes towards facilities that could be deemed “non-academic,” such as athletic facilities, auditoriums, and performing arts facilities. These may or may not translate into improved test scores—but may have other positive impacts for students and schools that are harder to quantify.
California-specific Research Shows Nuances of Statewide Policies
The research specific to California spending yields important and nuanced insights for policymakers. On one hand, research that links better academic outcomes to spending based on LCFF changes provides evidence that California’s landmark school finance reform is paying dividends and improving outcomes in high-need school districts. On the other hand, research on an earlier reform—the statewide class size reduction, or CSR—shows that large-scale targeted policies to increase school resources may not always be effective if there are supply constraints, such as a limited number of new educators.
For the CSR reform, initial findings were mixed—with inconclusive impacts on student test scores, reports of teachers engaging more with students, and a drop in teacher qualifications (EdSource 2002; Wexler et al. 1998; Sims 2008). Later evaluations painted a more nuanced picture: students exposed to smaller class sizes saw improved test scores, holding teacher qualifications fixed (Jepsen and Rivkin 2009; Gilraine, Macartney, and McMillan 2018).
Taken together, CSR led to more novice teachers—those without full certification, and those with no postgraduate certifications; with greater exposure to novice teachers, test scores fell at roughly the same percentage as the gains observed from smaller classes (Jepsen and Rivkin 2009). In other words, the policy led to both positive and negative impacts on students’ academic performance—that is, smaller class sizes but with more novice educators— that may have cancelled each other out in aggregate.
Thus, CSR had inconsistent effects. Large, restricted spending raised demand for early elementary teachers without increasing the supply of new, credentialed teachers. Policymakers may therefore want to approach large restricted statewide spending policies with caution: if schools are bidding against each other for a fixed supply of staff or other educational resources, it may diminish the positive effects of a program. Furthermore, the competition may deepen existing inequities, insofar as more affluent and “desirable” schools can outcompete less affluent schools for staff or other resources.
In the case of novice staff, the potential “losses” would also be short-lived—eventually these new staff become experienced and have more impact, so long as schools can retain them. More generally, this case exemplifies why large-scale spending increases may not immediately yield benefits.
A similar pattern emerged under LCFF: districts used additional funding to hire additional teachers and support staff, many of whom were novice. Academic improvements were not immediate, but accumulated over time as LCFF reached full implementation (Johnson and Tanner 2018; Lafortune 2021). While suggestive, existing research cannot definitively connect the delay in impact that occurs after spending increases to novice staff becoming more experienced; this represents a fruitful area for future policy-relevant research.
What Policymakers Can Learn from the Research
Fundamentally, the question of by how much an additional dollar improves outcomes is more relevant than understanding only whether or not increased spending improves outcomes. Schools will spend any additional funding on extra staff, higher salaries, new materials, and so on, and one would expect any such investments to have some effect on student outcomes. Understanding the benefits of additional funding, and how that funding should be distributed, are key concerns for policymakers.
Contextualizing Spending Impacts at Current Levels
When we have a more precise understanding of impact, we can then judge the value of investments, or at the very least, have more informed debates over how limited state and local funding should be applied. After all, many other beneficial state programs compete with K–12 education for funding.
On average, the research shows that $1,000 in additional spending for four years improves test scores by 0.035 standard deviations, and closer to 0.05 for low-income students. To put these effect sizes in context, we can examine existing disparities in test scores, also known as achievement gaps.
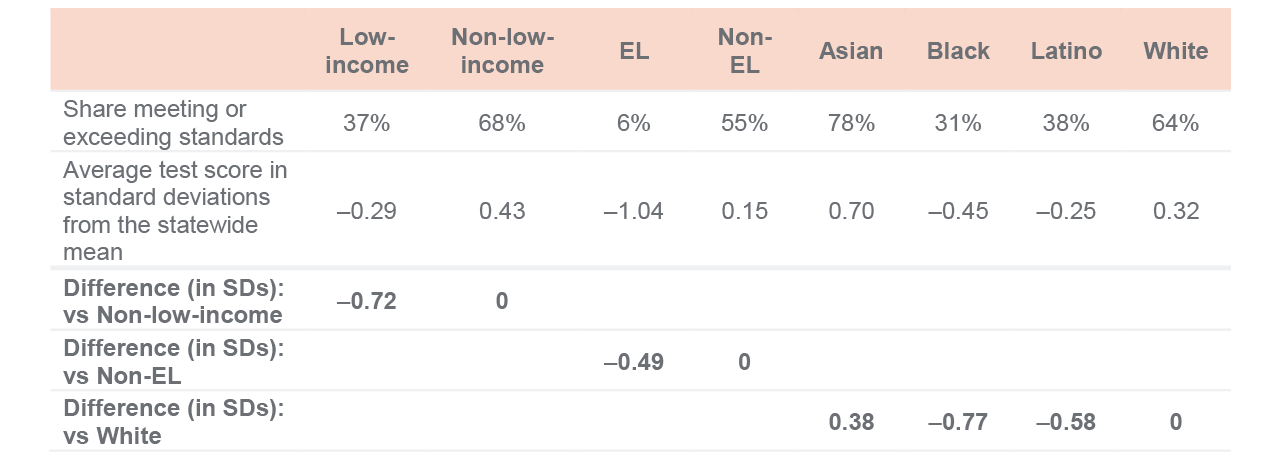
Table 2 shows 2018–19 English Language Arts (ELA) test scores for eighth-grade students in different subgroups. Over two-thirds of higher-income students are meeting grade level standards, compared to 37 percent of low-income students. Large gaps also exist by race, with Asian and white students scoring significantly higher, and by English Learner (EL) status. These gaps have persisted with little movement for much of the last two decades (Technical Appendix Figure A6).
Achievement gaps by subgroup, eighth grade ELA
SOURCES: California Department of Education, SBAC data; authors’ calculations.
NOTES: Difference rows show the stated difference in average test scores, in student-level standard deviation units relative to the statewide mean, using the statewide mean and standard deviation for a given grade-subject-year examination. Note that an increase of one standard deviation reflects an increase of 34 percentile points from the mean.
Using these estimates, we can hypothetically extrapolate the amount of funding it would take to close the gap between low- and high-income students. If we assume the effect is linear for spending—that is, it does not diminish or accumulate (a strong assumption)—it would take an additional $10,200 dollars annually for eight years to close the gap for eighth-grade low-income students.
If we assume that gains are larger for low-income students—0.05 standard deviations per $1,000 over four years, as estimated in prior studies—this additional amount falls to $7,200. The amount of funding required to close the Black-white gap would be slightly larger (between $7,700 and $11,000), and smaller for Latino-white gaps (between $5,800 and $8,300).
How do current spending differences across student groups compare to the spending that might be needed to reduce existing gaps? Table 3 shows that in 2019–20, spending per student is higher for low-income than higher-income students by $807 per student per year. There is essentially no difference between EL and non-EL students ($42). The most substantial differences are by race/ethnicity: spending is higher in the districts serving the average Black student than the average white student by roughly $1,900, and is higher for Latino students by almost $600. Spending for Asian students is more similar to spending for white students, though slightly higher ($285).
Spending by student subgroup

SOURCES: California Department of Education, SACS files, enrollment files; authors’ calculations.
NOTES: Total expenditures per student in 2019–20 reported for each student subgroup. Low-income (vs. non-low-income) refers to eligibility for free or reduced-price meals. Inflation-adjusted amounts are reported (2020$).
At current spending levels, achievement gaps may take years to close
These levels of spending progressivity are much lower than the hypothetical estimates of the spending required to close existing achievement gaps above. Using our back-of-the-envelope calculations, the extra funding allocated to low-income students is only between 8 percent to 11 percent what would be necessary to close gaps in eight years.
Put differently, it would take 70 or more years to close income or achievement gaps at current progressivity levels —holding all else equal and assuming that the additional funding annually produces the average effects documented in the literature. Given comparatively higher funding for Black students, current spending differences might close Black-white achievement gaps somewhat faster, though still in more than 30 years.
These numbers are purely extrapolations, and are meant to provide context around what current estimates and differences imply; they are not predictions of how things will evolve, nor are they prescriptions of an exact level of funding that is necessary. Importantly, lots of other things are happening at the same time that may lessen or worsen achievement gaps; the COVID-19 crisis is a prominent recent example, where gaps widened on standardized tests (Pier et al. 2021). Furthermore, if the effects of additional spending diminish at higher levels of funding, then these extrapolations would overestimate the impact of spending increases, and underestimate the time it make take to close gaps at current levels of spending progressivity.
Do estimates imply that spending policy is ineffective to reduce achievement gaps?
Caveats aside, more progressive spending could address disparities—as the above extrapolations suggest, but the state would need a degree of progressivity far beyond current levels. However, in the face of the slow progress on shrinking gaps in recent decades even as funding progressivity grew, experts have argued that spending policies are ineffective.
Setting aside the fact that effective often implies normative values and expectations that vary across individuals, two important pieces of context are worth considering. First, the same research identifying modest effects in the face of large disparities shows that increased spending passes a cost-benefit test (Jackson et al. 2016; Lafortune et al. 2018). Increased school spending acts as an investment, producing savings to the government in the form of future tax revenues (due to higher earnings) that exceed their initial cost (Hendren and Sprung-Keyser 2020).
Second, the amounts suggested by the evidence—roughly $7,000 to $10,000 per student per year—are large, but not implausibly so. Some states spend more than California by a similar margin per pupil—for example, New York, New Jersey, Connecticut—though no state has such high levels of spending progressivity (Shores, Lee, and Williams 2021). Of course, differences across states reflect differences in labor market, socio-economic, and educational circumstances, so such comparisons should be undertaken with caution.
How Spending Is Targeted Matters for Students and Districts
The estimates of spending progressivity used above assume that districts spend equally on each of their students. However, spending data at the school site level show that this is not the case in California, nor nationally: in fact, within districts, spending is slightly higher at schools with more lower-income students (Lafortune 2019, 2021; Shores, Lee, and Williams 2021). Given that school districts often serve students of varying backgrounds, how districts spend across students and school sites can determine how much finance policy affects gaps in resources and outcomes.
The literature on school finance reforms offers some important evidence in this regard. Relative spending increases of roughly $500 per student per year in low-income districts reduced test score gaps between low- and high-income districts by roughly 20 percent (Lafortune et al. 2018). However, differences in spending had no impact on test scores between low and non-low-income students. This was largely true because low-income students attend a variety of school districts, and are not perfectly concentrated in districts of a certain type (e.g., low-income or low property wealth). In other words, spending reforms targeted based on district-level characteristics improved achievement where funds were targeted, but as they were not well targeted to specific student groups, they were not effective at reducing achievement gaps across student groups.
Concerns over how districts target funding have been an area of great policy concern since California implemented LCFF (California State Auditor 2019; Hahnel and Humphrey 2021). For example, after Michigan’s 1994 reform, relatively more-affluent schools within a district saw larger increases than less-affluent schools in the same district (Hyman 2017). In California, available federal data suggest districts spend more at high-need school sites, but less than what would be implied if districts fully targeted funds based on the amount generated at a specific school site (Lafortune 2021).
Insofar as districts have schools of varying racial and socioeconomic composition—which is the case for most of the state’s medium and large districts—within-district targeting can act as either a complement or an impediment to the state’s intended spending distribution. Efforts to distribute funds more directly to students and schools would be worth considering by policymakers interested in addressing disparities.
Spending on Staff Quantity and Quality Can Be a Tradeoff
Spending effects are computed per dollar in most research; the effect represents an average over some combination of school resources, such as new staff, higher salaries, classroom materials, facility improvements, or educational technology. Each of these resources may have different effects on student outcomes. For example, spending $1 more on teachers may be more effective than spending $1 more on school administrators.
In practice, it is difficult for research to determine which resource has an effect, as there are fewer settings where a natural experiment drives the level and composition of spending. Furthermore, districts may have varying needs, and what is best for one district may not be the best pattern of spending for another. Even when a researcher could identify a specific dollar amount spent on a specific resource, these dollars may not be spent equivalently.
For teachers and other staff, there is a notable dichotomy: districts can spend on either staff quantity or staff quality (or some combination of the two). In practical terms, this is often a tradeoff—we can spend more to hire additional teachers, but we may have to hire more novice educators that are initially less effective. Indeed, the evidence from the CSR of the late 1990s makes this tradeoff clear.
Furthermore, effects may lag for policies that could improve teacher quality (such as increased salaries, benefits, or professional development): it may take several years for a higher-quality teaching pool to accumulate via recruitment and retention, and new teachers may initially be less effective. As staffing makes up the lion’s share of school spending, these dynamics are important for policy evaluation. Indeed, many school spending studies tend to find positive effects on students only after several years.
In California, higher-need districts have less-experienced teachers. And within districts, higher-need schools have less-experienced and lower-paid teachers—but spend slightly more on teachers, due to having smaller class sizes (Lafortune 2019; Lee, Fuller, and Rabe-Hesketh 2021). Would our dollars be better spent having more even class sizes but more qualified teachers across higher-need schools and districts? Unfortunately, existing research can offer no clear answers about whether a dollar spent on teacher quantity or quality is better spent; this is an area where further research could be of great importance to policymaking.
Other Financial Challenges for California Schools
Per-student spending in California grew consistently over the past several decades, with robust spending growth in the recent recovery since the Great Recession (see Figure 1, earlier). Increases since 2012–13 have coincided with LCFF, which directed additional funds to higher-need districts. However, these increases have also coincided with added cost pressures for districts.
Benefit Costs Are Rising
Nationally, health care costs have been rising continuously (at a rate faster than inflation in most years), putting pressure on school budgets even with no changes in staffing levels or regular compensation. In addition, pension contribution costs have climbed for districts—more than doubling since the state’s 2013 pension reform.
These benefit contributions have crowded out increased spending on students under LCFF. Given higher spending on staff salaries due to new hiring, raises, and annual step increases, we estimate that in 2019–20, roughly $650 per student in annual spending went towards covering higher contribution rates, rather than towards school resources. This amount is higher in the highest-need districts—over $700 per student—due to larger spending and staffing increases since 2013 (Technical Appendix Figure A7). The amount per student represents nearly 25 percent of the annual increase in operational spending since LCFF began in 2013–14.
Notably, the rise in contribution rates can be viewed as a spending cut, as the $650 per student is money that could be spent on other school resources. Of course, this rise occurred during a period of robust annual funding increases, meaning most districts had the financial means to absorb these increases. Still, when policymakers contextualize spending and funding increases from recent years, they must consider the higher costs schools face to provide the same resources, resources that ultimately determine a school’s ability to improve the academic outcomes of its students.
Teacher Shortages Constrain Districts
Teacher shortages—particularly in hard-to-staff subjects like math, science, and special education—have been a major area of policy concern in recent years (Darling-Hammond et al. 2018). And despite additional state and federal funding since the onset of the COVID-19 pandemic, staffing challenges may constrain districts’ ability to use the available funding.
As the pandemic wanes and as enrollments decline in many districts, these challenges may lessen. However, if early reports hold true that many educators are considering leaving the profession—and prospective teachers are choosing to forgo it altogether—districts may face a situation where wages must increase to attract and retain a consistent labor force. Inflation may also put similar upward pressure on district salary and other expenditures.
But even if these predictions do not hold over the longer term, other factors may drive salaries higher. Wage growth has been substantial for California’s labor market in recent years (Bohn, Lafortune, and Malagon 2022). Cost of living increases, particularly for housing, mean that teaching salaries are often insufficient to live comfortably in many high-cost coastal and metro areas. Any rise in teacher salaries will require greater funding to achieve the same staffing levels and quality, meaning that some portion of spending increases ought not be expected to provide improvements in student outcomes.
This general phenomenon—that increases in wages in other sectors can cause increased compensation in another sector, despite no underlying increase in productivity—is often referred to as Baumol’s cost disease (Baumol and Bowen 1993). In the context of increasing benefit costs, increases in staffing costs driven by higher cost of living or dissatisfaction with the teaching profession may impose a growing financial constraint on school districts in the coming years, and one which we would not expect to generate a commensurate improvement in outcomes.
One-Time Funding Effects Are Uncertain
Much of the increased funding provided to schools since the onset of the pandemic is “one-time” in nature, meaning that it will expire without renewal at some point in the future. Federal COVID stimulus funds must be spent by 2023–24, and many one-time state programs may subside in the coming years, especially if the budget retreats from record highs.
Unfortunately, research is limited on the efficacy of such limited-duration spending increases. Before the COVID-19 pandemic, federal stimulus during the Great Recession fit this category. Much of this funding was used to backfill budget cuts, for which it was partially effective in California (Lafortune, Mehlotra, and Paluch 2020). Federal stimulus during the recession also included competitive grant programs to foster innovation and school improvement—School Improvement Grants (SIGs) and Race to the Top (RTTP)—though available evidence suggests little impact on student outcomes (Dragoset et al. 2016, 2017).
Importantly, research finds that when school spending increases are sustained for several years, schools see positive effects. State and federal stimulus dollars have helped districts maintain operations and provide safer in-person learning environments. Beyond this, however, additional academic gains may depend crucially on whether schools prioritize investments that may have long-term returns, how spending is phased in and out, and the extent to which schools persist with the increased services provided (e.g., Willis, Krausen, and McClellan 2021).
Declining Enrollment Poses New Challenges—and Opportunities
Statewide, California projects public K–12 enrollment to decline by roughly 9 percent over the coming decade (Department of Finance 2021). Most counties expect to see declines, particularly in Southern California, along the coast, and in much of the Central Valley. Projected declines are largest in the Los Angeles area, continuing a pattern of lower student enrollments that began in the mid-2000s for most LA County districts. These are largely due to a drop in fertility rates and in net migration; COVID-19 has exacerbated recent declines (Lafortune, Prunty, and Hsieh 2021).
Financially, districts in decline are protected from enrollment declines in the year in which they occur—often referred to as a one-year “hold harmless.” However, enrollment declines are typically not one-year events: sustained declines continue in many districts for a decade or longer (Warren and Lafortune 2020). Because district funding depends on the number of students enrolled, districts often need to reducing staffing levels, cut student services, eliminate special programs, or even close school sites to balance their budget.
California’s hold harmless policy has an important implication when it comes to funding received per student while losing enrollment: per-student funding is actually higher for many years, for as long as the decline persists. On average, for the declines in California over the last three decades, this amounts to an additional $500 per currently enrolled student (Warren and Lafortune 2020). Downsizing may be inefficient and requires more than just proportional decreases in teachers and classroom materials, meaning this extra funding may not help students as much as it otherwise would in a stable or growing district.
On the other hand, research from a similar provision in New York State suggests that this may not be the case: students in districts that saw an additional $1000 per year under the hold harmless policy saw test score gains of 4 percent to 5 percent of a standard deviation (Gigliotti and Sorensen 2018). Statewide, declining enrollment also allows for increasing funding per student: because state funding is a roughly fixed share of the budget, lower enrollment will mean more resources per student in future years. As enrollment declines are projected to accelerate over the coming decade(s), more research on how declines affect students and school resources could help policymakers better determine how to allocate resources to aid districts in managing declines.
Conclusion and Discussion
In past decades, prominent academic and policy debates over whether “money matters” clouded the ability of school finance research to provide meaningful advice to policymakers seeking to understand whether and how to craft school finance policies. Recent quantitative research has yielded important and credible estimates. Using better data and research methods, the research finds that increases in spending lead to improved student outcomes, ranging from test scores, to graduation, to college attendance, to adult earnings and poverty.
These findings hold across a variety of studies and settings in the United States. Notably, dollar-per-dollar effects are larger for low-income students. Effects are also larger and more consistently positive with operational spending—teachers, support staff, materials—than for spending on facilities, though the literature on capital spending in California is more positive than studies in other states.
Importantly, the research does not say that spending will always translate into improved outcomes, nor that how money is spent does not matter. The effects identified in the existing research are averages; some types of spending are likely more important for outcomes than others, and some districts may allocate resources in more efficient ways. To be more useful for policymaking, future research should seek to provide more specific guidance on the most effective types of spending—and under what circumstances spending is most effective.
The research also makes clear that how funding is targeted—be it to students, schools, or districts—matters. Given existing patterns of residential segregation and school attendance boundaries that sometimes exacerbate segregation within districts (Monarrez and Chien 2021), how districts choose to spend across school sites has significant implications on spending equity, and ultimately, on the efficacy of state-level policies to promote more equitable outcomes.
Furthermore, when it comes to staffing, a dollar in spending can represent very different strategies and student experiences. In general, districts face tradeoffs between increasing staff quality and quantity. Research shows that while spending is similar or slightly greater at less-affluent schools within a district, these spending levels are achieved in different ways: more-affluent schools spend more per teacher, but have larger class sizes, while less-affluent schools rely on more novice teachers, but with smaller class sizes.
As California policymakers confront the continued challenges—such as the COVID-19 pandemic, declining enrollment, and teacher shortages—it will be important that research evidence provides a foundation for statewide policy decisions, where good evidence exists. While state and federal funding are currently at record-high levels, longstanding inequities by race and socioeconomic status bring continued urgency to policy debates over the adequacy, equity, and efficiency of school spending.
Still, there are many important questions where further research is needed. To date, most studies consider the effects of general spending increases, but there is greater debate and less recent evidence about how best for states to structure incentives and accountability to ensure funding is spent efficiently and equitably. Clearly, how dollars are spent matters, but so far the research has yielded relatively few actionable insights. In particular, many districts have responded to student needs in the pandemic with an increased emphasis on mental health and social-emotional learning. More research is needed on the effects of these investments, and when and where they may be most effective. In addition, there are few definitive answers about the best level of oversight and accountability when allocating state funds. Should state funding be restricted to certain categories and/or be contingent on pre-defined benchmarks? Unfortunately, we do not have clear answers to such questions.
Finally, most school spending research has considered a limited scope of outcomes, generally student test scores. However, schools spend significant time, money, and energy on non-academic services and supports; for such expenditures, it is unlikely that test scores are a complete proxy for effectiveness. Plans to launch a statewide longitudinal data system in California will aid considerably in this regard, allowing for more precise and compelling research, and examination of important longer-run impacts beyond test scores that are often unable to be considered in most school spending studies. As we continue to ask schools to play large roles supporting student mental, emotional, and social wellbeing, so too should research seek to broaden the set of outcomes used to define an “effective” spending policy.
Topics
K–12 Education Population Poverty & Inequality