

Table of Contents
- Introduction
- School Spending under LCFF
- Targeted Funding and Student Test Scores
- Targeting Student Need under LCFF
- LCAPs as Evidence of Targeted Spending
- Targeted Funding and School-Level Spending
- Discussion and Policy Takeaways
- Notes and References
- Authors and Acknowledgments
- PPIC Board of Directors
- Copyright
Key Takeaways
Now entering its second decade, the Local Control Funding Formula (LCFF) fundamentally shifted school finance in California. Under LCFF, the robust state revenue growth of the past decade led to even greater increases for the state’s highest-need districts. LCFF also brought about more flexible funding—along with concerns about whether additional funding is reaching the high-need students and schools for which it was intended. In this report, we provide comprehensive new evidence on the targeting and efficacy of LCFF funding for high-need students.
- Spending on concentration grants improved test scores in high-need districts. Concentration grants add funding above the LCFF base grant to districts with higher shares of high-need (English Learner, low-income, and/or foster youth) students. For these districts, the additional funding led to higher math and ELA scores, with the largest impact among 11th graders, who have had the longest exposure to increased LCFF funding. →
- Local Control and Accountability Plans (LCAPs) show incomplete targeting of funds to high-need students. Nearly 60 percent of districts in 2021–22 reported plans to spend less on high-need students than the additional funding they received for high-need students. The extent of targeting varies widely across districts, and gaps between spending on high-need students and the additional funding intended for them tend to be greater in higher-need districts. →
- Districts spend funds more evenly across schools than schools generate funds. Schools with more high-need students generate more funding, but most districts do not spend these additional dollars in the same proportion. In 2020–21, spending at high-need schools was 75 cents higher per dollar of extra funding, compared to roughly 45 cents on the dollar in the two prior school years. However, districts vary in this proportion, with nearly 80 percent of concentration districts spending dollars more evenly across schools than LCFF would imply if districts allocated additional funding in proportion to a school’s high-need share. →
Despite evidence that LCFF funding is working to improve outcomes at the district level, progress on achievement gaps has been slow, motivating efforts to improve targeting. Incomplete targeting of funds dilutes the funding impact of LCFF on high-need students, limiting the extent to which LCFF can affect achievement gaps. To better measure the effectiveness of funds in helping high-need students, the state should improve data on within-district spending and consider adding reporting for school sites. Simplifying the document for Local Control and Accountability Plans and moving it to an online form could also benefit local stakeholders and statewide analysts by making it easier to access information and improve consistency in financial reporting.
As federal stimulus funding wanes, and the state projects revenue shortfalls in the coming years, maximizing the equity and efficiency of LCFF funding will become more important to continue the progress that emerged in LCFF’s first decade.
Introduction
In 2013–14, California implemented the Local Control Funding Formula (LCFF)—the state’s school funding formula for transitional kindergarten through 12th grade (TK–12)—greatly changing the level, distribution, and mechanism of funding across school districts. LCFF consolidated dozens of “categorical” funding streams, a change that allowed districts more flexibility and required less accountability around spending. The LCFF introduced a weighted funding formula, giving districts with higher shares of high-need (English Learner, low-income, and/or foster youth) students additional funding—known as supplemental and concentration grants.
The state’s financial system does not explicitly track the use of these additional funds, nor the students or school sites on which the funding is spent. Rather, districts must provide plans that document how they use these funds to proportionally increase or improve services for high-need students, via Local Control and Accountability Plans (LCAPs) that involve local stakeholder input and county office of education or state review.
Roughly $600 billion of state K–12 education funding has been distributed through LCFF, reaching a high in 2022–23 of nearly $75 billion. Of that $75 billion, $12.7 billion (17%) was for supplemental and concentration grants meant to improve services for high-need children. School spending per pupil is now roughly 65 percent higher than a decade ago when LCFF was passed—nearly $22,684 per student in 2021–22 compared to about $14,245 in 2012–13.
Progress on standardized test scores suggests this additional funding is improving student outcomes across grade levels and student groups. Indeed, research into pre-pandemic cohorts finds evidence that test scores, graduation rates, and college readiness have improved due to the formula (Johnson and Tanner 2018; Lafortune 2021; Johnson 2023).
At the same time, California’s academic achievement remains an area of policy concern: before the pandemic, 51 percent of students scored at grade level in English Language Arts (ELA), 40 percent did so in math. After the pandemic, students across the state suffered severe learning losses, with test scores in many grades dropping to 2015 and 2016 levels: statewide proficiency rates in 2021–22 fell to 47 percent in ELA and 33 percent in math.
California is below the national average in math on national exams, and at the national average in reading among eighth graders, as of 2022. Progress on narrowing achievement gaps has also been slow: for example, while the proficiency gap in math between low- and non-low-income students has fallen 2 percentage points since LCFF, it remains high at 30 percent (21% proficient among low-income students vs. 51% proficient among non-low-income students).
In this report, we closely examine two aspects of LCFF. First, we examine the impact of weighted funding on student outcomes, providing new estimates of the impact of additional funding on test scores, both pre- and post-pandemic through 2022. Second, we consider how funding is distributed, compiling new data from LCAPs and from school spending reports to estimate how much LCFF supplemental and concentration funding is reaching the high-need students for whom it is intended. Our LCAP analyses represent the first near-comprehensive statewide examination of spending on LCAPs, to our knowledge. We collected roughly 99 percent of district LCAPs in 2021–22, and, with our final analysis set we can examine planned spending for nearly 700 districts, representing about 81 percent of the state’s K–12 enrollment.
Understanding the Funding Formula
Before LCFF, school districts relied on a combination of state aid and local revenues (mainly property taxes) to fund day-to-day school operations. This system resulted in mostly equal base funding for school districts, with state-funded “categorical” programs to earmark funds for specific purposes. At their peak, roughly 20 percent of total state funding for K–12 public schools came through categorical programs.
While some categorical programs were intended for high-need student populations, LCFF distributes additional funding in districts with more high-need students. In the decade from 2012–13 to 2021–22, districts with the most high-need students—80 percent or more—saw revenues increase by over $8,000 per student; for those with the fewest high-need students—less than 30 percent—revenues increased by around $4,000 per pupil (Technical Appendix Figure E3).
With the LCFF, districts receive a base grant per unit of average daily attendance (ADA), which varies depending on the grade level. Districts then receive additional funding on top of the base grant based on the proportion of high-need students they serve—often referred to as the unduplicated pupil percentage, or UPP.
For every additional high-need student, the district receives 20 percent of the base grant in supplemental grant funding. In districts with a share of high-need above 55 percent—or concentration districts—each additional high-need student generates additional funding beyond the 55 percent threshold at 65 percent above the base grant—referred to as the concentration grant.
Thus, a district that is 40 percent high-need gets 8 percent additional funding on top of their base grant, per student; a 60 percent high-need district (roughly the median statewide) gets 15 percent more; and an 80 percent high-need district receives 32 percent more (Figure 1). In 2021–22, the state increased the concentration grant from 50 percent to 65 percent of the base grant, providing even greater funding increases for very high-need districts. For an 80 percent high-need district with the same shares of students across grades as the statewide average, this amounts to roughly $385 more per student than under the old concentration grant (Technical Appendix Figure E1)
Funding formula directs additional funding on top of base funding as a district’s high-need share increases
Percentage increase in funding
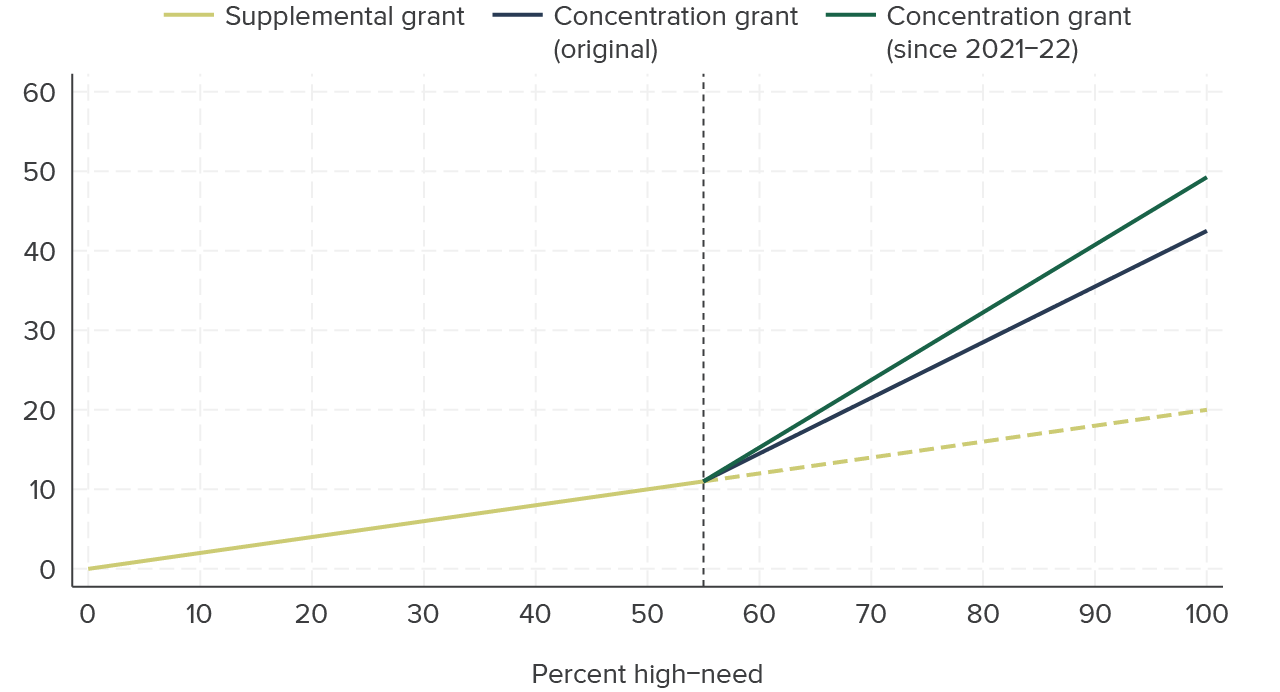
SOURCE: California Department of Education.
NOTE: High-need represents the “unduplicated pupil percentage” of low-income, English Learner, and/or foster youth in a district; the figure shows the percent increase in base grant funding for a district with a given share of high-need students.
School Spending under LCFF
After significant cuts during the Great Recession, school spending in California reached a trough in 2012–13. As the state budget—and K–12 education funding—recovered, the introduction of LCFF meant that these revenue and funding increases targeted student need much differently than the prior formula. Districts now receive a base grant as well as additional funding that targets the area’s high-need students. Under LCFF, districts with the most high-need students were able to increase spending by greater amounts than districts with fewer high-need students, reflecting the formula’s emphasis on targeting student need. This change in emphasis also meant greater spending growth in districts with greater shares of Black and Latino students and low-income students.
We examine these changes by focusing on the growth in district-level spending per student from 2012–13 to 2021–22, the most recent year of district-level financial data. We consider both total and current spending over the last decade. Current spending includes staff salaries, benefit payments, classroom materials, and other services: that is, spending directed to current TK–12 students. It excludes capital outlay, debt service, and other spending that does not directly benefit current TK–12 students in a district.
Spending Rose Most in Highest-Need Districts since LCFF
Since the introduction of LCFF, districts of all levels of student need saw substantial increases, with the largest in higher-need districts. The average increase in total spending from 2012–13 to 2021–22 ranged from roughly $6,500 per student in the lowest-need districts (less than 30% high-need), to just over $10,000 per student in the highest-need districts (80% or greater high-need) (Figure 2).
Spending has risen steadily since 2012–13, the year prior to LCFF implementation
Increase from 2012–13 to 2021–22 ($$ per pupil)

SOURCE: California Department of Education, district finance data and enrollment files; Authors’ calculations.
NOTES: Figure plots the change from 2012–13 to 2021–22 in total and current spending per pupil (see text for definition), in inflation-adjusted 2021 dollars. High-need refers to the “unduplicated pupil percentage” of low-income, English Learner, foster youth, and homeless students in a district. Averages are weighted by average daily attendance (ADA). Districts with ADA less than 250 are excluded. Districts with greater than 500 percent or less than 20 percent of California mean spending per pupil or funding formula revenues per pupil are excluded. See Technical Appendix A for further detail on data sources and sample restrictions.
While all districts increased spending regardless of need, the highest-need school districts have seen a relative increase of roughly $4,000 per student annually, in both total and current spending. That is, the highest-need districts increased current spending by roughly $9,000 per student compared to roughly $5,000 in the lowest-need districts.
These spending increases exceed the rise in state funding formula revenues (Technical Appendix Figure E2)—because federal and state stimulus dollars target low-income students, schools, and districts (see Lafortune et al. 2023 for an overview). Relative differences in spending between high- and lower-need districts predate LCFF but grew considerably after LCFF was introduced (Technical Appendix Figures E4 and E5). By category, spending on staff salaries and benefits are the largest increases, followed by materials, services, and other current spending subcategories (Technical Appendix Figure E6).
Spending Rose Most for Low-Income, EL, Black, and Latino Students
When we examine the spending increases for student groups, we assume that each student receives the average per student spending in their district; that is, that targeting of LCFF funding is equal (Table 1). As the vast majority of LCFF funding is base funding and not supplemental and concentration funding, we believe this is a reasonable starting point for assessing the impact of LCFF on spending. Later, we discuss how targeting affects the distribution of spending across students and schools and estimate how well districts target funds specifically to high-need students.
If each student receives the average spending in their district, high-need, low-income, EL, Black, and Latino students have all seen over $7,200 higher spending per student on average since 2012–13. Among racial groups, Asian and white students saw the smallest increases—$6,149 and $5,836, respectively—similar to those for non-high-need and non-low-income students.
The difference in spending growth between high-need and non-high-need students was nearly $1,300 per student, considerably smaller than the $4,000 difference in growth between the highest (80%+) and lowest-need (0–30%) districts. This variation is in part due to student demographics: while 81 percent of high-need students are in districts that receive concentration funds, 43 percent of non-high-need students are also in concentration districts. Thus, nearly half of the state’s non-high-need students may benefit from concentration grant funding, while the approach may miss about one-fifth of the state’s high-need students. Furthermore, the average student attends a district with a high-need share of nearly 60 percent; most California students attend districts that receive concentration grants.
LCFF has led to spending increases for all student groups

SOURCES: California Department of Education, SACS district finance data and enrollment files; Authors’ calculations.
NOTES: Assumes districts spend equally on all students. Concentration refers to districts with 55 percent or greater high-need student share. Excludes independent charter schools and district-affiliated charter schools not reporting on a district’s general fund. Excludes districts with fewer than 250 students. Low-income defined as students eligible for free/reduced-price meals.
Finally, Table 1 also shows that 80 percent of Black students are in districts receiving concentration funds. In fact, under the formula, Black students have seen the largest increase in spending of any student group (assuming each student receives the average per student spending in their district), even though the formula does not explicitly target any specific race or ethnic background.
Targeted Funding and Student Test Scores
Before the pandemic, trends suggested that additional LCFF funding leads to higher test scores, and studies support that increased funding—in particular, concentration grant funding—did improve student outcomes (Johnson and Tanner 2018; Lafortune 2021; Johnson 2023). Do these findings still hold post-COVID? In this section, we examine test scores from the 2022 Smarter Balanced Assessments and show that LCFF concentration grant funding continues to show positive impacts on test scores.
Specifically, we estimate the impact of concentration grant funding by studying the change in the relationship between district need and test score outcomes at the 55 percent threshold across districts in each year (Figure 1, above). During this time, while other changes besides LCFF may have affected the relationship between the share of high-need students in a district and test scores in that district, none would be expected to change abruptly at the 55 percent threshold except concentration grant funding.
Concentration Grant Funding Has Had an Impact on Test Scores
To assess the effect of LCFF funding on test scores, we rely only on differences in test scores on the same exam in the same year. The funding formula has a sharp “kink” when it reaches 55 percent high-need, which indicates a change in the relationship—or “slope”—between district share of high-need students and funding. No such kink existed before LCFF; therefore, we can examine whether a similar kink emerges post-LCFF in the relationship between student test scores and district share high-need. Any distinct change in the slope in student test scores at the 55 percent threshold would reflect the impact of the additional concentration grant funding per district.
Before LCFF, a notable downward relationship existed between district share high-need and the share of students meeting or exceeding grade-level standards, but there was no kink in the relationship near the 55 percent threshold (Figure 3). By 2021–22, a kink in the slope is visible at 55 percent, suggesting that additional concentration grant funding was effective in improving test scores.
Concentration grants appear to improve test scores in high-need districts above the 55 percent threshold

SOURCES: California Department of Education, California Assessment of Student Progress and Performance research files, enrollment files; Authors’ calculations.
NOTES: Each dot is a “bin” depicting the average share meeting or exceeding standards for multiple districts within a narrow range of share high need, the share meeting standards in 2012–13 (top panel) and 2021–22 (bottom panel). Only districts within 40 percent of the cutoff on either side are shown. Includes both math and ELA scores. For comparability over time, only test scores in grades 3–7 are included. Solid blue line displays the line of best fit above and below the 55 percent cutoff; the dashed blue line extrapolates the line of best fit from below the 55 percent cutoff. Each dot contains an equal number of district-grade-subject observations (unweighted); binned averages and lines of best fit are adjusted for average differences in the share meeting standards across grade-subject exams.
Concentration funding took several years to show an effect on test scores
When we account for differences due to enrollment, demographics, county, grade, and subject, we estimate that the changes in student proficiency at the 55 percent threshold shown in Figure 3 accumulate gradually after LCFF is introduced (Figure 4). The effects of new spending often take time to accumulate and lead to improved test scores and other academic outcomes (e.g., Jackson, Johnson, and Persico 2016; Lafortune et al. 2018; Jackson and Mackevicius forthcoming); we see this slow effect when we examine changes to test scores year by year.
In the first few years, as the state gradually implemented LCFF, we see only small and statistically insignificant effects. By 2017–18, test score effects are larger (and statistically significant) and they persist into 2018–19 and beyond the pandemic into 2021–22, despite the heavy learning losses faced across districts and student groups.
The effects of LCFF on test scores begin to emerge in 2017–18 and persist through the pandemic
Test score increase for 95% high-need district due to concentration grant

SOURCES: California Department of Education, California Assessment of Student Progress and Performance research files, enrollment files; Authors’ calculations.
NOTES: Figure shows separate estimates by year. Model includes average test scores for each grade-subject combination by district. Solid bars denote statistically significant estimates at the 5 percent level. Figure shows equation (2) estimates of the change in slope (kink) at the cutoff for the percent proficient, by year. Year corresponds to fall year. Some years are excluded: 2013–14 was a transition year between CST and SBAC, there was no exam in 2019–20, and the SBAC was optional and had low take-up in 2020–21. Bandwidth of 20 percent; see Technical Appendix D for full details on estimation and Technical Appendix Figure D4.
The share meeting standards is 13 percentage points higher for districts with a 95 percent high-need share than it otherwise would have been without the concentration grant kink in the funding formula. Analogously, funding is nearly $16,000 higher per student—an average annual increase of $1,750 per student over nine years—for these districts than it would have been without the concentration grant (Technical Appendix Table D2). If we instead measure the impact using pre-pandemic test scores in 2018–19, per dollar impacts are slightly larger: a 13 percentage point increase from an average annual increase of $1,354 per student over six years.
Concentration funding had the largest impact on 11th grade test scores
When we examine differences in scores by grade, we find that the effects of LCFF funding are similar across grades 3–8 (Technical Appendix Figure D9); the impact is slightly larger in grade 4 and grade 6. Estimated test score impacts were larger for 11th graders, which may reflect the length of exposure to LCFF for this cohort, who began in kindergarten in 2010–11 and attended schools that received LCFF funding for 9 of their 12 years in school. By subject, there is no difference in the magnitude of the impact of LCFF funding on math or ELA test scores (Technical Appendix Figure D10).
Targeting Student Need under LCFF
The relative rise in spending—and outcomes—for higher-need school districts reflects LCFF’s weighted funding formula. But LCFF’s ability to address longstanding achievement gaps—by income, race, and region—also depends on how well the formula can target resources across districts and on how districts deploy that funding to specific student groups and school sites. We’ve shown that higher concentration grant funding improved student test scores in math and ELA in the districts with the most high-need students. However, even before pandemic-induced learning losses, achievement gaps were large and showed only modest progress in LCFF’s first decade. How can both be true?
There are several reasons why LCFF’s formula may “imperfectly” target student need. Here, we use “imperfectly” in quotes because whether the funding is well-targeted or not depends on the specific gap that is being measured. For example, we tend to discuss gaps by student group—but LCFF targets funding to districts and not students. If districts spend additional funding intended for high-need students equally across students within districts or only partially target that funding to high-need students, then the actual spending increase for high-need students is less than the funding formula would imply. Indeed, far more progress was made on pre-pandemic gaps between the highest- and lowest-income districts than between low-income and non-low-income students (Lafortune 2021). Furthermore, since LCFF does not target student groups by race or ethnicity, its ability to target racial achievement gaps is limited by the correlation between student race and income, foster status, or EL status.
These concerns are not just theoretical. A 2018 study of state school finance reforms from 1990–2011 found that while reforms increased spending and outcomes in low-income school districts, they were not well-targeted to low-income students, and had no impact on statewide funding and achievement gaps between low-income and higher-income students (Lafortune, Rothstein, and Schanzenbach 2018). While low-income districts had higher shares of low-income students than other districts, they also had many non-low-income students—and vice versa.
How districts spend additional state funds also matters: a long-term study of Michigan’s 1994 school finance reform found that relatively more-affluent schools within districts saw larger increases in spending, even if the reform targeted dollars progressively to less-affluent school districts (Hyman 2017). Such concerns have also been raised with respect to LCFF supplemental and concentration funding (e.g., Roza, Coughlin, and Anderson 2017). Most notably, an investigation by the state auditor had difficulty tracking this additional spending (Howle 2019). Unfortunately, besides the specific districts examined by the state auditor or complaints brought against districts by education advocates, we have little systematic data documenting the extent to which supplemental and concentration dollars are targeted to high-need students within districts.
Overall, the extent to which policies like LCFF increase relative spending for high-need versus non-high-need students depends on how districts allocate funds across school sites and programs. Later, we assess the extent to which districts spend additional funds for high-need students “proportionally”—that is, whether districts spend additional funding on the students and/or school sites in proportion to the additional funding those students and schools generate. We use district LCAP plans and school-level spending data to provide new information on targeted spending patterns and proportionality.
Equal Spending within Districts Dilutes the Impact of LCFF on High-Need Students
How districts choose to spend on their high-need students and schools affects how effectively the funding formula might narrow achievement gaps. In Table 1 earlier, we showed the differences by student group if a district spends equally on all its students, but this need not be the case. For example, a district could spend all its supplemental and concentration dollars on high-need students. But if districts spend funding equally across all students—or even regressively (giving more funding to non-high-need, higher-income students)—then the funding formula will generate smaller relative differences when we compare spending on students as opposed to on districts.
Consider the following stylized example: suppose the state were to grant each school district an additional $2,000 per high-need student. If all districts had baseline funding of $10,000 per student (roughly the average LCFF base grant in 2022–23), this funding scheme would be equivalent to the LCFF funding formula with only the supplemental grant. To show how within-district targeting affects funding for high-need students, we will consider four scenarios:
- Fully targeted spending within district: Districts target all the additional funding to high-need students.
- Half-targeted spending within district: Districts target half of the additional funding to high-need students, and then spend the rest equally.
- Equal spending within district: Districts spend equally across all students.
- “Half-regressive” spending within district: Districts spend half of the additional funding on non-high-need students, and then spend the rest equally.
We then compute the average increase in spending for high-need and non-high-need students at every district in California under each scenario, using 2022–23 district enrollment. Under this hypothetical scenario, two things stand out.
The amount of increased funds reaching high-need students depends on how districts target spending
Only when districts fully target would the relative difference in spending be the same as the amount of state funding granted per high-need student (Figure 5). When districts spend equally across all students, we would see a $1,443 increase in spending for high-need students—but also a $1,025 increase in spending for non-high-need students. That corresponds to a relative increase of only $418 per high-need student, even though the policy intended to target $2,000 per high-need student and none for non-high-need students.
When funds are partially targeted, with half spent equally and half specifically on high-need students, this relative difference increases to over $1,200 per student ($1,722 for high-need vs. $513 for non-high-need). Finally, if districts do partial, regressive spending, we would actually see larger average increases for non-high-need than high-need students statewide—despite the fact that the policy was explicitly progressive at the district level, with greater funding increases for districts with more high-need students.
Under a hypothetical $2,000 per high-need student policy, the amount reaching high-need students depends on within-district allocations

SOURCES: California Department of Education, enrollment files; Authors’ calculations.
NOTES: See text for complete explanation. Equal spending scenario assumes districts spend equally on students. Fifty percent targeted scenario assumes half of money is spent specifically on high-need students, with the rest distributed equally across students. One hundred percent targeted scenario assumes all is spent on high-need students. Fifty percent regressive scenario assumes half is spent on non-high-need students, with the rest spent equally. Enrollment data from 2022–23 used to calculate spending increases. Charter schools not reporting on a district’s general fund are excluded.
When funding is not perfectly targeted within districts, large spending differences for high-need students emerge at different districts
Under partial- or no-targeting scenarios, spending increases for high-need students would vary widely for different districts. In the lowest-need districts (under 30% high-need) per-student increases would be smallest—and if they spend equally, then their average high-need student would see an additional $466 in spending. At the other end, the highest-need districts (80% high-need) would see the greatest increases per student, and if they spend equally across students, their average high-need student would get an additional $1,744. More succinctly, without perfect targeting, high-need students would see more funding in the higher-need districts. See Technical Appendix Table E2 for full detail on high-need and non-high-need students under all four scenarios.
Schools with the Same High-Need Shares May Get Different Funding because of Concentration Grants
By design, concentration grants generate greater total LCFF funding for districts with the highest concentration of high-need students. This design has an important implication for how funding targets high-need students: high-need students generate more funding in concentration districts, and even more in districts with very high concentrations of need.
Indeed, this was part of the rationale for the concentration grant: to acknowledge differences in the challenges and needs that come with higher concentrations of low-income, EL, and/or foster children in a school (Bersin, Kirst, and Liu 2008). Nevertheless, acknowledging the difference within the high-need student category—that high concentrations of need require additional funds—differs from the typical way in which achievement gaps are measured by income and/or race.
Policymakers, advocates, and district leaders have also raised concerns about the funding implications for schools with concentrated need that are in non-concentration districts. In 2021–22, a school with 100 percent high-need students will generate anywhere from $1,200 to nearly $4,000 per student in supplemental and concentration dollars, depending on the level of need districtwide (Figure 6). In fact, a school at or near 100 percent high-need in a district that is 60 percent high-need will generate about the same supplemental and concentration funding as 50 percent high-need school in an 80 percent high-need district.
Thus, even if a district were to perfectly allocate all supplemental and concentration dollars to exactly the students and school sites that generate those dollars under the formula, the “kink” in the funding formula would generate substantial differences in spending across schools with similar demographics but in districts of varying need.
High-need schools generate different levels of funding depending on their district’s share high-need
Supplemental and concentration dollars generated at site

SOURCE: California Department of Education, LCFF summary files and UPC enrollment files; Authors’ calculations.
NOTE: Each dot contains multiple schools with similar share high-need (horizontal axis) and shows the average supplemental and concentration funding generated at a school site for those schools (vertical axis). Solid lines show the line of best fit between the points. Each dot is weighted to contain equal numbers of students within each district grouping (e.g., equal in each “District <50% high-need” dot).
LCAPs as Evidence of Targeted Spending
While districts might be expected to use their supplemental and concentration grants to improve services for the high-need students who generated the funds, the regular financial reports that districts submit do not account for expenditures at such a level of detail. Instead, the main mechanism for understanding how districts are using LCFF funding to improve services for high need students is the Local Control and Accountability Plans (LCAP).
The LCAP is a district’s three-year plan that describes its goals, services, and expenditures to support equitable student outcomes. Districts incorporate input from local stakeholders and their county office of education. LCAPs are meant to hold districts accountable for their expenditures, gather feedback and comments from interested parties within a district’s local community, and to use strategic planning to improve student outcomes and achievement. The state required school districts to adopt their respective LCAPs starting in the 2014–15 school year with the shift to LCFF. The state requires each district to publicly post their final LCAPs online and update the report annually.
In this section, we review total expenditure tables from each district’s 2021–22 LCAP to shine light on the share of funding that districts are spending on high-need student groups. In particular, we examine how proportional the planned spending outlined within LCAPs is to the actual supplemental and concentration funding amounts districts received. We also examine which expenditure actions (e.g., professional development, mental health services, and parent and family engagement) districts plan most commonly on their LCAPs to support high-need students.
The LCAP Shows Planned Spending in Total Expenditure Tables
LCAPs can often reach over one hundred pages in length; the required detail and planning process can place strain on districts’ administrations, and smaller districts may face a greater burden producing such a large document annually. The largest districts, such as Los Angeles Unified school district, have LCAP documents reaching almost 400 pages.
Though summaries of LCAPs are often available, sizeable LCAPs make it difficult for parents and families to navigate the full document. Likewise, the length and variation in how districts complete LCAPs makes it difficult for other interested parties, such as researchers or statewide analysts, to use LCAPs to glean broader insights across districts and statewide. Among other components, the LCAP has data entry tables, including the total planned expenditures table, which is the piece of the LCAP this report evaluates.
Total planned expenditure tables contain general information on the subgroup and amount of funding targeted for specific actions. Spending is reported separately by category, including LCFF spending, other state spending, local spending, federal spending, and total spending (the sum of the other financial variables).
Total expenditure tables detail efforts to improve student outcomes
Past LCAP analyses have raised concerns about expenditure reporting and whether district actions to increase or improve services to high-need students are proportional to the additional funding they receive—but have typically focused on a sample of LCAPs or the LCAPs from a specific county (e.g., Li, Ochi, Provenza, and Leung 2023).
To evaluate how funding is targeted throughout California, we use the total planned expenditure tables from as many district LCAP reports as possible for the 2021–22 school year; we collected tables from 1,008 reports. Due to inconsistencies, missing information, and non-machine-readable tables, we limit attention to a final data set of total planned expenditure tables from 692 districts. This covers 69 percent of school districts in California and 81 percent of the state’s student population.
Figure 7 is an example of a page from a typical total expenditure table. Each row represents an action description, the student groups the action intends to impact, and how much funding the district (Fremont Unified) is planning on using for the action. An action can target spending to multiple student groups. The first five rows of the table are each of the steps that Fremont Unified will take to achieve their goal number 1, to “Provide an educational environment that is conducive to learning.” For instance, the fourth row (Goal 1, Action 4) illustrates their plan to spend $295,000 in LCFF funding on professional development opportunities for instructional staff, to support English Learners, foster youth, and low-income students.
A page in Fremont Unified’s total expenditure table shows the planned actions and funding amounts

SOURCE: Fremont Unified School District annual LCAP update for the 2021–22 school year
NOTE: This figure displays the first page of the total expenditure table from Fremont Unified 2021–22 annual LCAP update. Note that any blank cell for any financial variable column (LCFF funds, other state funds, local funds, federal funds, and total funds) equates to no funding being spent.
Expenditure Tables Offer Insights into Targeted Spending
To investigate how much districts plan to spend on high-need student groups, we rely on the Student Group(s) and financial variables within the LCAP total expenditure tables. We compare planned LCFF funding and planned total funding to the amount of supplemental and concentration—and total LCFF—funding that a district receives. While there is no strict requirement for districts to spend dollars proportionally—defined in this report as spending additional funding on high-need students and/or school sites in the proportion in which funding is generated—comparing planned expenditures to actual funding amounts provides a useful baseline to assess the extent to which high-need students are experiencing supplemental expenditures under LCFF.
Overall, the average district plans to spend almost $33 million in LCFF funding and approximately $43 million in total funding; 59 percent of their total LCFF funding is included on their LCAP. This does not mean that districts do not have spending plans for the remaining 41 percent of funding; rather, districts report only the planned spending that is associated with goals/actions. The median district is right under 46 percent; however, almost 90 percent of districts plan to spend at least as much as their total supplemental and concentration grant funding allocation.
Nearly all districts include English Learners, low-income, and foster youth in spending plans
Most actions on LCAP expenditure tables cover several standard student subgroup categories such as: all students, English Learners (EL), low-income (LI), foster youth (FY), students experiencing homelessness (HL), students with disabilities (SWD); we classify the remainder as “other.”
English Learners, low-income, and foster youth student subgroups appear in nearly 98 percent of districts in the data set, more than the “other” student subgroups, or the “all” group (Table 2). Furthermore, EL, LI, and FY student groups account for around 25 percent of cumulative district LCFF and total planned spending each. Homeless students—though also classified as low-income students—appear separately on only 7 percent of district LCAPs, but account for less than 1 percent of planned LCFF spending. Students with disabilities appear as a student group in 52 percent of districts and account for 5 percent of cumulative district planned LCFF spending.
Nearly all districts report spending on high-need student groups on their LCAPs

SOURCES: District LCAP total expenditure tables; Authors’ calculations
NOTES: See Technical Appendix B for details on the data sample. Table details the share of districts and share of LCFF spending on each student subgroup. Because we cannot discern proportions spent per subgroup when multiple subgroups are listed for a specific expenditure, we count all spending towards all listed subgroups, meaning that the expenditure shares sum to greater than one in the second row.
On average, districts are planning to spend 38 percent of their reported LCAP LCFF expenditures on high-need student groups (Table 3). This share varies widely: the top 5 percent of districts are planning to put virtually all reported LCFF spending towards improving student outcomes for high-need student groups, while the bottom 5 percent are targeting roughly 2 percent or less.
Districts vary in the share of planned LCFF spending they allocate to high-need students
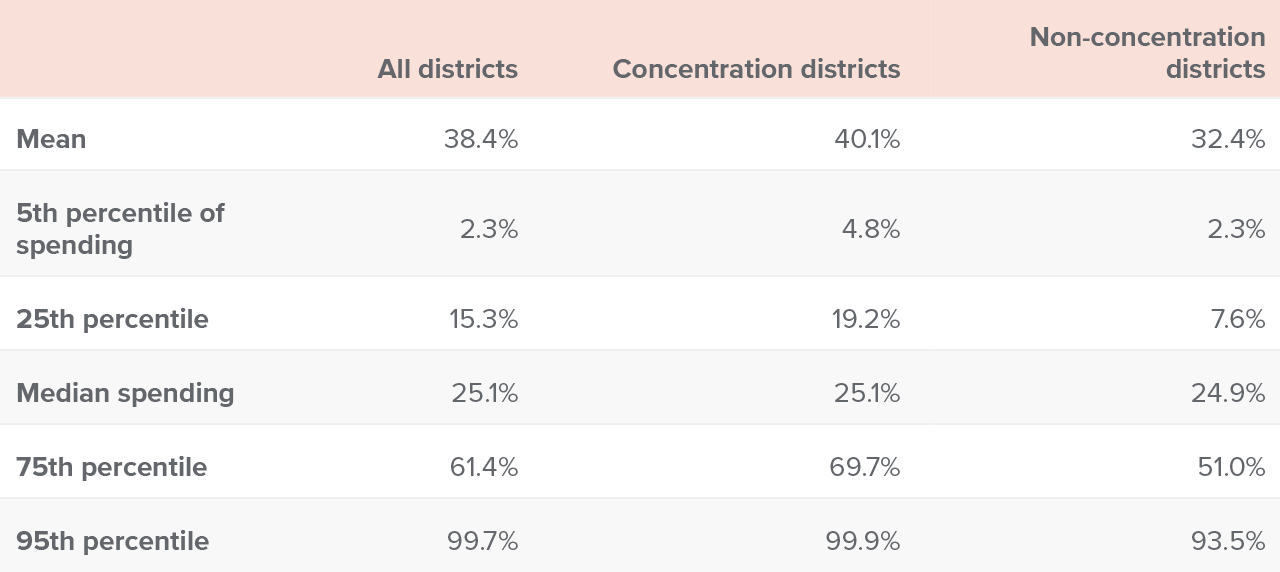
SOURCE: District LCAP total expenditure tables; Authors’ calculations
NOTES: The table depicts the ratio of LCFF funding on a district’s LCAP to be spent on any high-need student subgroup(s) for the following statistics: the mean (average), 5th percentile, 25th percentile, median, 75th percentile, and 95th percentile. Reported statistics are weighted by enrollment. Concentration districts refer to districts with at least 55 percent of students classified as high-need. Non-concentration districts refer to districts under the 55 percent high-need threshold.
Districts serving higher proportions of high-need students typically plan to spend more LCFF spending on high-need students than districts with lower populations of high-need students (Figure 8). Furthermore, as the share of high-need students increases, the share of resources being allocated toward them typically increases, too. The ratio of LCFF funding on a district’s LCAP to be spent on any high-need student group(s) may underestimate the positive relationship between districts serving the highest proportion of high-need students because they may have recorded the student group for these rows as “all” instead of any high-need student groups.
The share of LCAP spending on high-need students increases with district share high-need
% LCFF planned spending on high-need students

SOURCES: District LCAP total expenditure tables; California Department of Education; Authors’ calculations.
NOTES: Bin 1: 0 percent to 30 percent high-need. Bin 2: 30 percent to 55 percent; Bin 3: 55 percent to 80 percent; Bin 4: 80 percent+. Top 1 percent of observations trimmed from the data creating this figure. Reported statistics are weighted by enrollment. Enrollment data is from the 2021–22 school year.
Most districts report less spending on high-need students than they receive in supplemental and concentration grants
Examining the share of spending on high-need students conflates base grant with supplemental and concentration (S&C) grant funding, making it difficult to discern proportionality in spending. To assess whether districts are planning to spend their S&C dollars proportionally on high-need students, we compare a district’s planned LCFF spending on high-need students to their actual 2021–22 S&C funding. Ultimately, most districts are not planning LCFF expenditures on their LCAP for high-need student groups in proportion to their S&C allocation: approximately 60 percent do not report LCFF planned spending at or above their level of S&C funding on high-need students.
In Table 4, a share of 100 percent indicates that each planned dollar of LCFF spending on high-need students is matched by $1.00 of S&C funding in the same district. A share below 100 percent signifies that a district is planning to spend less LCFF funding on high-need students than the amount of S&C funding. Fifty-nine percent of planned total expenditure tables have a share less than 100 percent. On the other hand, nearly one-quarter of districts are planning to spend more than 5 percent above the level of supplemental and concentration grant funding they are allocated in 2021–22.
Planned LCFF spending on high-need students often less than a district’s total supplemental and concentration grant allocation

SOURCE: District LCAP total expenditure tables; Authors’ calculations
NOTES: The table depicts the ratio of planned LCFF spending on high-need student subgroup(s) compared to the district’s supplemental and concentration grant allocation for the following statistics: the mean (average), 5th percentile, 25th percentile, median, 75th percentile, and 95th percentile. Reported statistics are weighted by enrollment. Concentration districts refer to districts with at least 55 percent of students classified as high-need. Non-concentration districts refer to districts under the 55 percent high-need threshold. The observations making up the top 1 percent of this ratio were excluded because they were considered drastic outliers.
Proportionality of supplemental and concentration spending falls as high-need share rises
A significant negative relationship exists between the amount of planned LCFF spending on high-need students as a proportion of total S&C funding versus the share of high-need students a district serves (Figure 9). Districts serving comparatively low populations of high-need students are most likely able to have higher ratios because their S&C funding allocation is much lower to begin with. On the other hand, districts serving higher populations of high-need students appear to spend more evenly, as funding spent districtwide in these districts is much more likely to support high-need students.
The highest-need districts (80%+) report less planned expenditures than they receive in supplemental and concentration funding
% planned spending on high-need students from S&C funding

SOURCES: District LCAP total expenditure tables; California Department of Education; Authors’ calculations.
NOTES: Bin 1: 0 percent to 30 percent high-need. Bin 2: 30 percent to 55 percent; Bin 3: 55 percent to 80 percent; Bin 4: 80 percent+. Weighted by student enrollment within bin. Top 1 percent of observations trimmed from the data creating this figure. Reported statistics are weighted by enrollment. Enrollment data is from the 2021–22 school year.
Targeted Funding and School-Level Spending
Districts are required to report data on school-level spending under the federal Every Student Succeeds Act (ESSA); in these data, districts separate their site and central spending into either combined state and local funds or into federally funded components. Because most district spending goes to staffing and materials—and most staff and materials are specific to a school—these data provide key insights about how districts target LCFF funds from the differences in spending levels at schools within the same district, and whether they spend across schools proportional to the way schools generate supplemental funding.
We use three years of these data, starting in 2018–19—the first year these data became publicly available—and going to 2020–21, the most recent year available at the time of publication. First, we discuss how to use school-level spending to estimate LCFF targeting to school sites. Then we report estimates of targeting at the district level, for large districts with 10 or more schools, followed by statewide estimates that use data from all districts with more than 250 students.
School-Level Spending Can Indicate the Extent of Targeting
District LCFF funding is driven by the student population at its schools. How much higher is spending from state and local sources at one school relative to others in the same district that generated less additional high-need student funding under the funding formula? In other words, is district spending across schools more or less equal to the level implied under the formula?
Spending at different school sites in the same district can differ for a lot of reasons: differences in site maintenance and operation costs, in class size, teacher experience/credentials, programmatic offerings, grade-level costs (e.g., elementary vs. high school classes), and special education student needs. Some of these differences—like grade-level costs, special education, and maintenance—likely are outside of the scope of a district’s ability to “target” supplemental and concentration funding. However, differences in other spending—like student services, educator staffing, and educator credentials—across higher- versus lower-need school sites can inform whether LCFF supplemental and concentration dollars are reaching the schools within districts that generate those dollars.
We know how much LCFF funding districts receive that is intended for high-need student services; using the share of high-need students at a school and a district’s total supplemental and concentration funding allocation, we can calculate the amount of supplemental and concentration funding generated at each school. This calculation gives us a baseline to compare how spending varies across schools with different high-need student populations within a school district. That is, we can compare spending across schools relative to this benchmark.
Because we examine differences across schools in a district, we exclude central spending—spending that is not specific to a school site. This is a limitation of our analysis: central spending makes up about 30 percent of total spending reported by districts. Importantly, for our targeting analysis, excluding central spending is equivalent to assuming these dollars are equally allocated across schools. If this is not the case, and some central dollars are targeted to higher-need school sites, then our estimates will understate the extent of actual targeting. Conversely, if these central funds are targeted regressively—in a higher proportion to lower-need schools—then these measures will overstate the extent of within-district targeting of high-need students.
Example districts show how spending can vary across schools
What would it look like for districts to target their supplemental dollars across schools in proportion to how much funding each of those schools generate under the formula based on their demographics? Figure 10 shows how targeting appears for four large districts in California with varying degrees of spending progressivity across schools. Each bubble is a school; larger schools appear as larger bubbles. The dotted line shows the average relationship—or slope—between a school’s funding and its spending from state and local sources.
The first panel shows San Francisco Unified (SFUSD) spent roughly $1.06 in schools for each $1.00 that school generated in supplemental and concentration funding (that is, it has a slope of 1.06). The second panel shows Los Angeles Unified (LAUSD) allocated even more towards high-need schools: $1.36 for each $1.00 generated by supplemental and concentration funding. This indicates LAUSD is spending more progressively than the funding formula would imply across school sites. This may be the result of LAUSD funding schools using a “student equity needs index,” which considers additional factors beyond the LCFF high-need categories.
The bottom two panels show large districts with partial targeting and with slightly regressive targeting. Garden Grove Unified has partial targeting, but it is a somewhat segregated district—with a handful of lower-need school sites and most schools with very high levels of student need. Conversely, Long Beach Unified has slightly regressive spending: the district has schools with varying levels of need, but on average, sites with fewer high-need students see slightly higher spending.
Targeted spending at schools differs from supplemental and concentration dollars generated by schools at four large districts

SOURCES: California Department of Education, ESSA site-level spending data, LCFF summary files and UPC enrollment files; Authors’ calculations.
NOTES: 2019–20 spending data. Each bubble shows an individual school in the district, with the bubble size proportional to school enrollment. The horizontal axis shows the school-level supplemental and concentration funding generated at a site based on an equal apportionment of district supplemental and concentration dollars to each high-need student at their school site. The vertical axis shows the site-level state and local spending from ESSA school-level spending data. The dotted line shows the average slope (equivalently, the line of best fit). The estimated slope is reported in the subtitle. Two outliers with spending above $20,000 per student are not shown on the figures for Long Beach USD and Garden Grove USD.
The four districts in Figure 10 also show substantial differences in spending, even among schools that generate similar supplemental and concentration funding. For example, while SFUSD spends roughly $1.00 more for every $1.00 generated at a school in S&C dollars, this is not a perfect relationship, and there are high-need schools that generate significant additional funding that see lower spending. This situation underscores that our measure of progressivity estimates only what the district is doing on average, and does not capture all differences in spending across schools of varying levels of need.
School-Level Targeting by Districts Varies Greatly
Next, we estimate the extent to which districts are targeting spending proportionally across school sites, for all large California public districts with 10 or more schools (see Technical Appendix C for full details). When we measure the proportionality of state and local spending to funding generated, on average across schools in a district, two notable patterns emerge.
First, the proportionality of spending across schools of varying need varies widely across districts. Figure 11 shows our estimates of targeting by year and whether a district is above 55 percent high-need (concentration) or not. Each circle is the estimate of a specific district’s targeting proportionality. Districts with proportionality of one spend additional funding for high-need students, dollar-per-dollar, across higher-need school sites on average; districts with an estimate of zero spend equally across schools of varying need; those with less than zero spend regressively, allocating less funding to higher-need schools. While many districts spend at high-need schools at or above the level of funding those schools generate under LCFF, a majority do not; that is, they target partially across schools. About one quarter of districts allocate regressively.
Targeting varies greatly across districts—but on average, higher-need districts distribute funding more evenly (each dot is one district)
Within-district average proportionality

SOURCES: California Department of Education, LCFF summary files and UPC enrollment files; Authors’ calculations.
NOTES: Solid line denotes the median. Each dot is a district. Reports average within-district proportionality of across-school spending by year, for concentration (55%+ high-need) and non-concentration (<55% high-need) districts. District estimates above 2 (below -2) are top-coded (bottom coded) at 2 (-2). Only districts with at least 10 schools included. Outliers and districts with incomplete data excluded; see Technical Appendix A for more information about the data sample.
Second, we see notable differences between concentration and non-concentration districts. A much higher share of non-concentration districts spend more progressively than the LCFF formula across school sites (i.e., spend more than a dollar per dollar that school site raises in extra funding). The median non-concentration district spends proportionally across school sites on average (roughly dollar for dollar), while the median concentration district spends more equally, targeting only 50 cents of each dollar across schools on average.
The fact that concentration districts tend to spend more equally—and not in proportion the LCFF funding generated by higher-need schools—may be a function of the higher share of funding they receive through supplemental and concentration grants. It may be easier for a lower-need district to target a smaller amount of supplemental funding to specific school sites for high-need students. On the other hand, for a high-need district that receives a more substantial share of their funding through supplemental and concentration grants, more of that funding may go into general funding—such as staff salary increases—that affects all students, with most being high-need. Importantly, this is an allowable use for districts, so long as districts document in their LCAPs how across-the-board salary increases may benefit high-need students (e.g., through improved recruiting and retention). Finally, these differences across districts may in part reflect differences in how districts account for central expenditures that support sites. As mentioned earlier, if districts allocate central funding in greater proportion to high-need students and school sites, it means our estimates of targeting will be underestimates.
Statewide Estimates Show Incomplete Targeting to Schools
How proportional are dollars spent on average, statewide? To answer this question, we estimate the average level of targeting using all districts statewide. We compare spending within districts for schools that generated different levels of supplemental and concentration funding. Because of funding differences by grade level, we report estimates with and without controls from enrollment at the grade level at each school. (See Technical Appendix C for details.) Figure 12 reports these statewide estimates, pooled across years, and separately by year.
Pooled across all years, on average, districts spent 63 percent of supplemental and concentration grant funding generated at the school sites that generated them, with the other 37 percent distributed more equally across the district. Without controlling for enrollment, this share is higher, around 78 cents of every dollar.
Over the past three years, targeted spending has not been proportional to funding levels
Average within-district spending proportionality

SOURCES: California Department of Education, LCFF summary files and UPC enrollment files; Authors’ calculations.
NOTES: Estimates shown with 95 percent confidence intervals. The first column shows pooled estimates across all years. Estimates of equation (1) with and without enrollment controls reported in the purple and red bars, respectively. See Technical Appendix C for full details and exact point estimates.
Targeting was lower in 2018–19 and 2019–20 (roughly 45 cents on the dollar) compared to 2020–21 (75 cents on the dollar). Why might this be the case? It could indicate that spending has become more progressive, and is better targeted in 2020–21, perhaps due to legislative actions in response to the critical 2019 state audit. But it may also indicate spending patterns unique to the pandemic and virtual learning, such as targeted spending on student devices and connectivity, tutoring, and other outreach. Importantly, these site-level spending data do not include federal stimulus spending; it is possible that increased state funding in 2020–21 may have allowed for greater resource targeting across school sites and/or that the pandemic altered the extent to which districts target resources to higher-need schools. Whether this pattern persists will be an important question for future research when additional years of data become available.
Discussion and Policy Takeaways
Now entering its second decade, the LCFF fundamentally changed school finance in California. The weighted funding formula enabled a decade of state revenue growth to translate to even greater increases for the state’s highest-need districts: while spending went up across the board, for districts with 80 percent or greater shares of high-need students, per student spending increased more than $4,000 annually, compared to districts with 30 percent or fewer high-need students. This increase is driven largely by the concentration grant, which has worked to improve test score outcomes in high-need districts—both before and after the pandemic.
LCFF also brought about more flexible funding for districts, granting them greater autonomy over local spending decisions. But this flexibility raises concerns about whether districts are proportionally targeting their supplemental and concentration grant funding to the high-need students and school sites for whom it is intended.
In 2021–22, most districts report planned spending on high-need students that is less than what they received in supplemental and concentration grant funding. While the median is not far off from proportional spending—the median district reports planned LCFF spending that totals 90 percent of supplemental and concentration dollars—many districts report planned spending on high-need students far below what these students generate in funding. Our analysis of spending on schools within districts over multiple years corroborates these findings: targeting is incomplete and it can vary widely, especially in concentration districts.
Though there is no strict legal requirement to target all supplemental and concentration funds to high-need students—districts need only demonstrate proportional improvements in services for high-need students—the incomplete targeting of these funds in many districts limits the extent to which LCFF can affect achievement gaps. Motivated by these findings around targeting—and our evidence that concentration funding is improving outcomes when measured at the district level—we provide some recommendations to further improve the efficacy and equity of LCFF over the coming decade.
Target high-need students more completely to narrow achievement gaps. Evidence indicates that LCFF concentration grant spending has improved student test scores, particularly for 11th graders. This improvement suggests that, without the progressive LCFF formula, achievement gaps may have grown even more during COVID. But achievement gaps remain large and widened slightly post-pandemic after a modest decline over several years. Amidst projected state revenue shortfalls in the coming years, efforts to maximize the equity, efficiency, and efficacy of the state’s funding formula will be key to addressing ongoing educational inequities and ensuring an equitable recovery from COVID-era learning losses. And yet, the data suggest that supplemental funding for high-need students is not proportionally spent, limiting its ability to reduce these gaps.
Improve and regularize data on within-district spending. Without more systematic and comparable statewide data on within-district spending, any attempt to measure whether supplemental and concentration funds are spent on high-need students will have limitations.
To fully account for and track spending, CDE should consider adding reporting codes for these funds within the districts’ standardized accounting reports (SACS). It should also explore adding a site-level code for at least some expenditures, so long as these efforts comply with ESSA requirements: doing so would help systematize and expand upon the required site-level data collection already happening under federal mandate. Many districts and states already do this.
The National Center for Education Statistics (NCES) is piloting a more comprehensive school-level finance survey, so districts may soon be federally mandated to report similar data. These data would allow local and statewide stakeholders better, more accurate information to understand how resources are distributed across their local schools—and whether supplemental and concentration grant funding is leading to improved spending in the highest-need school sites.
Streamline the LCAP document to improve spending transparency for local stakeholders and statewide analysts. LCAPs—even with their revised expenditure tables—are difficult to compile, parse, and analyze when trying to use them to analyze cross-district patterns. They are also very long, repetitive, and complicated; transitioning the LCAP to an online document could be an opportunity to further simplify the LCAP document and reporting for districts while also making it easier for interested stakeholders to access information.
While LCAPs may not have been intended to provide information for statewide analysis, improving the consistency of financial information reported on LCAPs would go a long way to improve financial transparency of LCFF spending. However, given the many reporting burdens placed on districts, any efforts to revise LCAPs should be developed jointly with districts and should explore ways to lessen the overall reporting burden of LCAPs.
Topics
Equity Higher Education K–12 EducationLearn More

Updating California’s School Funding Formula

Financing California’s Public Schools

Teacher Staffing Trends in California

Funding Student Need

Testimony: Achieving Funding Equity in LCFF Grant Design

Commentary: On California Funding Formula’s 10th Anniversary, Celebrate Progress but Double Down on Fairness

Video: Examining the Reach of Targeted School Funding
